Dysregulated gene-associated biomarkers for Alzheimer's disease and aging
←
→
Page content transcription
If your browser does not render page correctly, please read the page content below
Translational Neuroscience 2021; 12: 83–95
Research Article
Min Li, Rongxin Geng, Chen Li, Fantao Meng, Hongwei Zhao, Jing Liu, Juanjuan Dai,
Xuezhen Wang*
Dysregulated gene-associated biomarkers for
Alzheimer’s disease and aging
https://doi.org/10.1515/tnsci-2021-0009 contribute to the early detection, differential diagnosis,
received September 24, 2020; accepted January 18, 2021 treatment, and pathological analysis of AD.
Abstract: Alzheimer’s disease (AD), the most common Keywords: Alzheimer’s disease, aging, differentially
type of dementia, is a neurodegenerative disorder with expressed genes, blood, hippocampus
a hidden onset, including difficult early detection and
diagnosis. Nevertheless, the new crucial biomarkers for
the diagnosis and pathogenesis of AD need to be explored
further. Here, the common differentially expressed genes 1 Introduction
(DEGs) were identified through a comprehensive analysis
of gene expression profiles from the Gene Expression Alzheimer’s disease (AD), the most common cause of
Omnibus (GEO) database. Furthermore, Gene Ontology dementia, has become an increasingly severe global public
and Kyoto Encyclopedia of Genes and Genomes pathway health concern, placing a colossal burden on both families
analyses revealed that these DEGs were mainly asso- and society [1]. AD is an age-related disease characterized
ciated with biological processes, cellular components, by initial difficulties with memory, progressive cognitive
and molecular functions, which are involved in multiple impairment, dysfunctions in daily activities, and abnormal
cellular functions. Next, we found that 9 of the 24 genes mental and behavioral changes. The cardinal pathological
showed the same regulatory changes in the blood of hallmarks of AD include intracellular neurofibrillary tan-
patients with AD compared to those in the GEO database, gles and accumulation of extracellular amyloid-β condu-
and 2 of the 24 genes showed a significant correlation cive to senile plaques [2]. However, the lack of targeted
with Montreal Cognitive Assessment scores. Finally, we biomarkers for diagnosis and pathogenesis was one of
determined that mice with AD and elderly mice had the the key reasons for the current unavailability to treat or
same regulatory changes in the identified DEGs in both prevent AD [3].
the blood and hippocampus. Our study identified several Considerable evidence shows that the development
potential core biomarkers of AD and aging, which could of AD involves a genetic component and that the muta-
tion or abnormal expression of genes triggers the occur-
rence and the progression of its core pathology [4].
Genetic analyses have determined four causal or genetic
* Corresponding author: Xuezhen Wang, Department of Neurology,
risk genes implicated in AD, such as amyloid-β protein
Binzhou Medical University Hospital, No. 661 Huanghe 2nd Road, precursor, presenilin 1 (PS1), PS2, and apolipoprotein E
Binzhou, Shandong, 256603, China, [5]. Clinically, the diagnosis of AD mainly relies on the
e-mail: xuezhen_wang@126.com history of individual cognitive and behavioral changes,
Min Li: Department of Neurology, Binzhou Medical University opinions from other family members, cognitive tests, neuro-
Hospital, No. 661 Huanghe 2nd Road, Binzhou, Shandong, 256603,
logic examinations, blood tests, and brain imaging rul-
China
Rongxin Geng: Department of Neurosurgery, Renmin Hospital of ing out other potential causes of dementia symptoms [6].
Wuhan University, Wuhan, Hubei, 430000, China However, the novel pathological genes of AD require further
Chen Li, Fantao Meng, Jing Liu: Institute for Metabolic & exploration.
Neuropsychiatric Disorders, Binzhou Medical University Hospital, Age-related cognitive despair is a major risk factor for
Binzhou, Shandong, 256603, China
AD. Some genes or pathway deficits, such as insulin,
Hongwei Zhao: Department of Neurosurgery, Binzhou Medical
University Hospital, Binzhou, Shandong, 256603, China
IGF-1 signaling, and neuronal glucose transport, are involved
Juanjuan Dai: Cancer Research Institute, Binzhou Medical University in energy metabolism and inflammatory responses,
Hospital, Binzhou, Shandong, 256603, China and their connections are hallmarks of aging and
Open Access. © 2021 Min Li et al., published by De Gruyter. This work is licensed under the Creative Commons Attribution 4.0 International
License.84 Min Li et al.
neurodegenerative disorders such as AD [7]. In recent dec- ncbi.nlm.nih.gov/geo/geo2r). The adjusted p < 0.05 and
ades, microarray technology and gene expression profile |log FC| > 1 were defined as the cutoff criteria. Venn ana-
analysis have become conventional means of exploring lysis was utilized to identify the common DEGs. Gene
and screening differentially expressed genes (DEGs), thus Ontology (GO) and KEGG analyses were performed using
enabling the identification of changes between patients the Database for Annotation, Visualization and Integrated
and healthy individuals at the gene expression level. Mole- Discovery (DAVID, http://david.ncifcrf.gov), an online
cular network analysis of the aging human frontal cortex bioinformatics database that consists of integrated biolo-
has revealed co-expressed genes between aging and AD gical data and stable analysis tools [10].
and its neuropathologic and cognitive endophenotypes
[8]. Therefore, the identification of specific, sensitive, and
reliable biomarkers and pathological genes is crucial for
the early diagnosis and the therapeutic development of AD. 2.2 Subjects
Nevertheless, common functional genes in the blood and
the brain involved in the pathology of AD and aging require Blood samples from patients with AD and NECs were
further identification. collected from the Department of Neurology, Binzhou
In this study, we first analyzed the gene expression Medical University Hospital, Binzhou, China. The patients
profiles of GSE4226, GSE4227, and GSE4229, which were were diagnosed with AD based on the Montreal Cognitive
selected from the Gene Expression Omnibus (GEO) data- Assessment (MoCA) scores and cortex and hippocampus
base, to identify the key genes associated with AD. Then, atrophy detection results from magnetic resonance ima-
GEO2R online tools and Venn analysis were utilized to ging (MRI); neurologic examinations were used to exclude
analyze and identify the common DEGs. Furthermore, other potential causes of dementia symptoms. Information
biological processes (BPs), cellular components (CCs), regarding age, sex, disease duration, MoCA scores, and
molecular functions (MFs), and the Kyoto Encyclopedia MRI results are summarized in Table 1. Blood samples
of Genes and Genomes (KEGG) pathways of the common were collected and stored immediately at −80°C.
DEGs were analyzed. Next, validation tests were conducted
on human blood samples using quantitative real-time
PCR (qPCR) to confirm the common DEGs, which may be 2.3 Animals
served as the candidate biomarkers for AD early diagnosis.
Finally, the expression of these DEGs was validated in the Male wild-type (WT) C57BL/6J mice (Stock No. 000664)
blood and hippocampus of AD and aged mice to identify were purchased from the Jackson Laboratory (Bar Harbor,
the potential targeted genes for diagnosis and pathological ME, USA) and maintained as a colony. APP/PS1 (Stock No.
researches of AD (Figure 1a). 004462) mice [11,12], which express a chimeric mouse/
human amyloid precursor protein (APP) and mutant
human presenilin 1 (PS1) in neurons, were obtained from
the Jackson Laboratory. For genotyping, the following PCR
2 Methods primers were used: PS1: forward-5′-AATAGAGAACGGCAG
GAGCA-3′, reverse-5′-GCCATGAGGGCACTAATCAT-3′; APP:
forward-5′-AGGACTGACCACTCGACCAG-3′, reverse-5′-CGG
2.1 Processing microarray data from the GEO
GGGTCTAGTTCTGCAT-3′. All mice were housed in groups
database of five per cage under a 12 h light/dark cycle (lights on at
7:00 am) with ad libitum access to water and standard food
Three databases (GSE4226, GSE4227, and GSE4229), which pellets.
included the gene expression profiles of whole peripheral
blood from patients with AD and normal elderly controls Informed consent: Informed consent has been obtained
(NECs), were searched and obtained from the GEO data- from all individuals included in this study.
base (http://www.ncbi.nlm.nih.gov/geo/) [9]. The num-
bers of subjects in each database were as follows: Ethical approvals: (1) The research related to human use
GSE4226: 14 AD and 14 NECs; GSE4227: 16 AD and 18 has been complied with all the relevant national regula-
NECs; and GSE4229: 18 AD and 22 NECs. GEO2R, an open tions, institutional policies and in accordance the tenets
and shared interactive online tool, was utilized to identify of the Helsinki Declaration, and has been approved by
DEGs between patients with AD and NECs (http://www. the authors’ institutional review board (approval number:Biomarkers of aging and Alzheimer’s disease 85 Figure 1: Analysis of differentially expressed genes in AD patients’ blood samples. (a) The framework of the whole study design. (b) The common DEGs derived from the Venn analysis of the three expression profiles (GSE4226, GSE4227, and GSE4229). (c) Expression levels of the common 24 DEGs in AD blood samples. The red column represents upregulated DEGs, and the blue column represents downregulated DEGs. (d) GO and KEGG pathway analyses of the DEGs.
86 Min Li et al.
Table 1: Information of 20 cases Alzheimer’s disease (AD) and 21 cases normal elderly controls (NECs)
Subjects Gender Age (YEARS) Duration (YEARS) MoCA Hippocampus atrophy Cortex atrophy
AD-1 Female 63 3 15 Yes Yes
AD-2 Male 55 2 13 Yes Yes
AD-3 Male 66 5 21 Yes Yes
AD-4 Female 64 4 8 Yes Yes
AD-5 Male 64 5 19 Yes Yes
AD-6 Male 66 3 3 Yes Yes
AD-7 Female 64 4 13 Yes Yes
AD-8 Male 65 5 14 Yes Yes
AD-9 Female 65 4 15 Yes Yes
AD-10 Female 66 5 8 Yes Yes
AD-11 Male 55 3 13 Yes Yes
AD-12 Female 67 4 0 Yes Yes
AD-13 Female 63 5 7 Yes Yes
AD-14 Female 65 3 10 Yes Yes
AD-15 Male 58 4 14 Yes Yes
AD-16 Male 55 2 17 Yes Yes
AD-17 Female 68 3 9 Yes Yes
AD-18 Male 64 4 10 Yes Yes
AD-19 Female 63 5 6 Yes Yes
AD-20 Male 61 4 15 Yes Yes
NEC-1 Male 68 0 27 No No
NEC-2 Male 56 0 29 No No
NEC-3 Female 64 0 28 No No
NEC-4 Male 65 0 30 No No
NEC-5 Male 62 0 28 No No
NEC-6 Female 62 0 27 No No
NEC-7 Female 58 0 30 No No
NEC-8 Male 57 0 28 No No
NEC-9 Female 65 0 27 No No
NEC-10 Male 61 0 26 No No
NEC-11 Female 68 0 29 No No
NEC-12 Female 61 0 27 No No
NEC-13 Female 55 0 27 No No
NEC-14 Male 68 0 28 No No
NEC-15 Male 66 0 26 No No
NEC-16 Female 59 0 29 No No
NEC-17 Female 62 0 26 No No
NEC-18 Male 65 0 30 No No
NEC-19 Female 68 0 28 No No
NEC-20 Female 67 0 30 No No
NEC-21 Male 66 0 28 No No
2019-LW-009). (2) The research related to animals’ use has manufacturer’s recommendations. cDNA was synthesized
been complied with all the relevant national regulations using a RevertAid First Strand cDNA Synthesis Kit (K1622,
and institutional policies for the care and use of animals. Thermo Fisher Scientific, Waltham, MA, USA). The resulting
cDNA was used for qPCR quantification using a
StepOnePlus Real-Time PCR system (Applied Biosystems,
2.4 Quantitative real-time PCR analysis Waltham, MA, USA), in accordance with the manufacturer’s
instructions. Gene expression levels were normalized to
Mice were decapitated, and the blood and hippocampi those of GAPDH. The 2−ΔΔCT (cycle threshold) method was
were rapidly collected. Total RNA was extracted from used to calculate and analyze relative mRNA expression
the blood or hippocampi using TRIzol reagent (Invitrogen, levels [13–17]. All primer sequences are listed in supplemen-
Carlsbad, CA, USA) and purified according to the tary Table S1.Biomarkers of aging and Alzheimer’s disease 87
2.5 Morris water maze distributed data. For escape latency in the MWM test,
two-way repeated-measures ANOVA followed by Tukey’s
The Morris water maze (MWM) test was performed as test was used. The percentage of male and females in both
described previously [18]. Briefly, the water maze (1.50 m normal and AD groups was analyzed by the Chi-square
in diameter and 0.50 m in height) was filled with water test. The linear relationships between two variables were
(20 ± 1°C; dyed white) to maintain the water surface height determined by calculating Pearson’s correlation coeffi-
at 1.50 cm. The tank was divided into four quadrants. cient. P < 0.05 was considered as statistically significant.
The hidden platform remained at a constant position All data are presented as the mean ± standard error
throughout the trials and was placed at the center of either (s.e.m.).
quadrant. Video tracking software was used to track the
animals. Learning and memory acquisition lasted for 5
days. Animals were placed in the water at four points ran-
domly every day until they reached the platform and
remained there for 10 s within 1 min; otherwise, the mouse
3 Results
was manually guided to the platform. On the day, the
learning and memory test was carried out, the platform 3.1 Identification of DEGs from the GEO
was removed, and the mice were placed in the water in database
the opposite quadrant to where the platform was pre-
viously located, and the number of times the mouse We aimed to identify the DEGs by comparing the gene
crossed the platform’s previous location, total distance, expression profiles of patients with AD and NECs. In the
and total time were recorded within 60 s. GEO database, three gene expression profiles (GSE4226,
GSE4227, and GSE4229) were acquired by searching for
AD of Homo sapiens, which was not really included in the
previous studies. The DEGs were selected and detected
2.6 Y maze using the GEO2R online tool with default parameters.
Compared with the NECs, 61 upregulated and 53 down-
The Y maze (YM) test was conducted as described pre-
regulated DEGs were detected from GSE4226, 28 upregu-
viously [19]. In brief, the apparatus for the YM test con-
lated and 22 downregulated from GSE4227, and 38 upregu-
sisted of gray plastic (with each arm 40 cm long, 12 cm
lated and 15 downregulated from GSE4229. Venn analysis
high, 3 cm wide, and 10 cm wide at the top) at the bottom.
was utilized to handle three expression profiles (GSE4226,
The three arms were connected at an angle of 120°. The
GSE4227, and GSE4229) and acquire 24 common DEGs,
mice were placed at the end of an arm and allowed to
including 15 upregulated and 9 downregulated genes
explore the maze freely for 10 min. The total arm entries
(Figure 1b and c). In addition, GO function and KEGG
and spontaneous alternation percentages (SA%) were
pathway analyses of the 24 common DEGs were performed
measured. SA% was defined as the ratio of the arm
using DAVID tools. The results indicated that the common
choices that differed from the previous two choices (“suc-
cessful choices”) to total choices during the test. DEGs were mainly enriched in the BP, MF, CC, and KEGG
pathways. Common DEGs for BP accounted for gene
expression, CC biogenesis, intracellular transport, estab-
lishment of localization in cells, and cellular localization.
2.7 Statistical analysis Common DEGs for the CC analysis were chiefly implicated
in extracellular exosomes, extracellular vesicles, extra-
All statistical analyses were performed using the statis- cellular organelles, membrane-bound vesicles, and extra-
tical software GraphPad Prism 7. Shapiro-Wilk test and cellular regions. Common DEGs for MF were mainly related
F test were used to test the normality and equal variance to RNA binding, poly(A) RNA binding, structural molecule
assumptions, respectively. To compare two groups, two- activity, structural constituents of ribosomes, and cadherin
tailed t tests were used for normally distributed data. binding involved in cell–cell adhesion. KEGG pathway
Two-tailed t-tests with Welch’s correction were used analysis demonstrated that common DEGs were enriched
with normally distributed data for unequal variances. in the ribosomes, proteoglycans in cancer, and hippo-
Mann-Whitney U tests were used for the nonnormally campus signaling pathway (Figure 1d).88 Min Li et al.
3.2 Verification of the identified DEGs in expression levels of ACTG1 and ALDOA were positively
blood samples from patients with AD correlated with MoCA scores, with the RPS6KB2 gene
showing a trend for significant positive correlation with
The identified DEGs were confirmed using the blood sam- these scores (Figure 4a). The other genes showed no
ples of patients with AD collected from our hospital. obvious correlation with the MoCA scores (Figure 4b).
There was no statistical difference between those with
AD and NECs in terms of age and sex (age: p = 0.8206;
sex: p = 0.7773, Figure 2a and b), while these patients had
significantly lower MoCA scores and evident cortex and
hippocampus atrophy than the control subjects (p <
0.0010; Figure 2c and Table 1). Our qPCR results indi-
cated that the mRNA levels of RPL23 (p = 0.0050) in blood
significantly increased in patients with AD, whereas mRNA
levels of ACTG1 (p = 0.0136), DDX5 (p = 0.0348), RPS6KB2
(p < 0.0010), ALDOA (p < 0.0010), NOL6 (p < 0.0010),
EFHD2 (p < 0.0010), HERPUD1 (p < 0.0010), and PRRT1
(p = 0.0424) significantly decreased compared to those in
the NEC group (Figure 3a), and the change in the expres-
sion of these genes was in line with the results of the GSE
data analysis. Furthermore, the mRNA levels of RPL37A
(p < 0.0010), RPL5 (p = 0.0084), PPP1CB (p < 0.0010),
RPL24 (p < 0.0010), THRA (p < 0.0010), CASP2 (p =
0.0077), SMARCD3 (p < 0.0010), NLN (p < 0.0010), MSH5
(p < 0.0010), and EPDR1 (p = 0.0099) genes were signifi-
cantly lower in the patients with AD than in the NEC group
(Figure 3b), and the change in expression of these genes
was in direct contrast to the results of the GSE data ana-
lysis. Nevertheless, there were no differences in the mRNA
levels of CDH1 (p = 0.3189), OTUB1 (p = 0.4458), RASL11B
(p = 0.4007), COMMD8 (p = 0.1035), and LAT2 (p = 0.1093)
genes between patients with AD and the NECs (Figure 3c).
Correlation analysis was conducted between the
mRNA expression levels of nine identified genes whose
change in expression was similar to that observed in GSE
data analysis and MoCA scores. We found that the
Figure 3: Detection of DEGs in the blood samples of patients with
AD. (a) Significant changes in gene expression in line with the GSE
data, (b) significant changes in gene expression in direct contrast to
Figure 2: The age, sex, and MoCA scores of the patients. (a) Age, those in the GSE data analysis, (c) no changes in gene expression.
(b) sex, and (c) MoCA scores of patients with NECs and AD. NECs: NECs: n = 21; AD: n = 20. *p < 0.05; **p < 0.01; ***p < 0.001
n = 21; AD: n = 20. ***p < 0.001 compared to control subjects. compared to normal.Biomarkers of aging and Alzheimer’s disease 89
Figure 4: Correlation analysis of the nine identified DEGs with MoCA scores. (a) The genes showing significant positive correlation with
MoCA scores. (b) The genes showing no significant correlation with the MoCA scores.
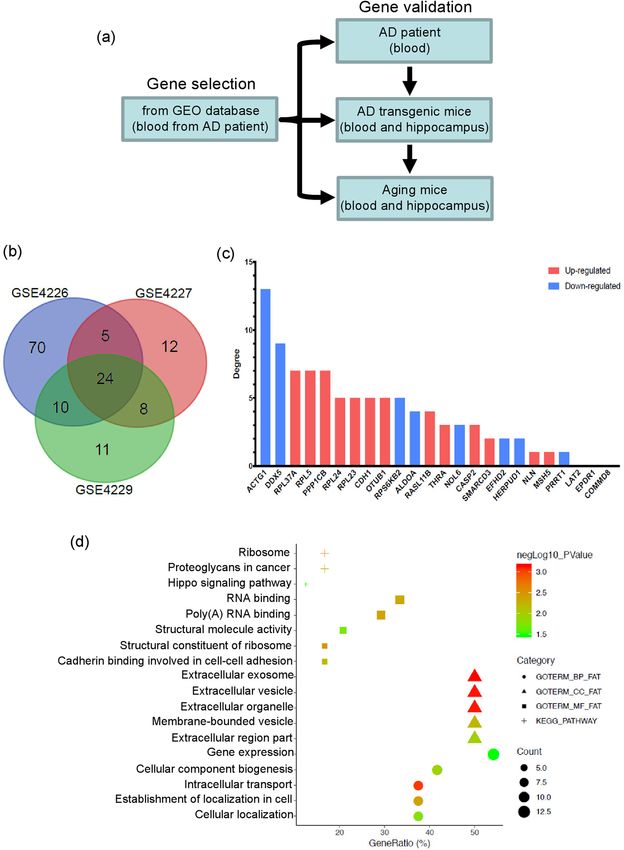
3.3 The expression profiles of the DEGs in and the results showed that the expression levels of all
blood samples from AD and aging mice DEGs decreased in the hippocampi of AD mice compared
to those in their control littermates (RPL23: p = 0.0034;
To further confirm the expression of the DEGs, we used ACTG1: p = 0.0021; DDX5: p < 0.0010; RPS6KB2: p <
AD transgenic mice (18 months old) with learning memory 0.0010; ALDOA: p = 0.0086; NOL6: p < 0.0010; EFHD2:
deficiencies [11] to test the expression profiles of the nine p < 0.0010; HERPUD1: p < 0.0010; PRRT1: p < 0.0010;
identified DEGs with a similar change in expression as that Figure 5b).
found in the GSE data analysis. The mRNA levels of all nine Aging is an important contributor to the pathology of
DEGs, except for RPL23, decreased in the blood of AD mice AD [20,7]. Therefore, we next analyzed the expression
compared to those in the blood of WT mice (RPL23: p = of these identified DEGs in the blood and hippocampi
0.5657; ACTG1: p = 0.0188; DDX5: p = 0.0268; RPS6KB2: of aging mice. First, we evaluated the learning memory
p < 0.0010; ALDOA: p = 0.0046; NOL6: p < 0.0010; EFHD2: behaviors of the mice of different ages (2 vs 24 months),
p = 0.0188; HERPUD1: p < 0.0010; PRRT1: p = 0.0222; and the 24-month-old mice showed significantly higher
Figure 5a). Meanwhile, the expression of the nine DEGs escape latencies than the 2-month-old mice (age: F (1, 85) =
in the hippocampi of AD and WT mice were also measured, 76.6400, p < 0.0010; days: F (4, 85) = 7.5480, p < 0.0010;90 Min Li et al.
4 Discussion
In the present study, 24 common DEGs were identified by
a comprehensive analysis of three expression profile
databases (GSE4226, GSE4227, and GSE4229) associated
with AD and NECs. GO function and KEGG pathway
analyses indicated that gene expression alterations, extra-
cellular exosome abnormalities, RNA-binding dysfunc-
tions, and structural constituent disturbances of ribosomes
were significantly enriched in AD. In addition, we used the
blood samples collected from patients with AD to validate
the expression of these 24 DEGs and found that 9 DEGs
showed a similar change in expression as the mRNA levels
of ACTG1 and ALDOA showed a significant correlation with
the MoCA scores. Finally, we found that the expression of
8 of the 9 DEGs in blood and hippocampus showed the
same decreased tendency in AD and the learning memory
despairing aging mice (Table 2).
Memory difficulties are one of the most common
characteristics of AD and related tauopathies [21]. Ana-
lysis of both databases and AD blood sample revealed
that RPL23 levels were increased in AD. RPL23 is a pri-
mary binding site between eukaryotic translation initia-
Figure 5: The mRNA expression levels of the nine identified DEGs in tion factor 6 and 60S ribosomal subunit [22]. The ribo-
AD mice. The mRNA expression levels of the nine identified DEGs in some–tau binding increases in AD compared to that in
the blood (a) and hippocampi (b). WT mice, n = 11; AD mice, n = 12; the control brains; this aberrant association leads to sig-
*p < 0.05; **p < 0.01; ***p < 0.001 compared to WT.
nificantly decreased protein synthesis [23]. Ribosomal
dysfunction leading to decreased translation has been
age × days: F (4, 85) = 4.8400, p = 0.0015) in the MWM implicated as an important part of AD pathogenesis.
test. The crossing number, total distance, and total time However, RPL23 expression levels in aging mice indi-
taken by the 2-month-old mice decreased compared to cated a distinct regulatory function. The reason for this
that for the 24-month-old mice (p < 0.0010; p < 0.0010; phenomenon is currently unclear, and thus, requires
p < 0.0010) in the MWM test (Figure 6a). Our results further exploration in future.
also revealed that the SA in the YM test of 2-month-old The dysfunction of the formation and plasticity of
mice decreased compared to that of the 24-month-old synapses is one of the pathogenic targets involved in
mice (p = 0.0131; Figure 6b). AD [24]. EFHD2, a calcium-binding protein, is abundant
Next, we evaluated the expression of the nine DEGs in the central nervous system and directly or indirectly
with the similar change in expression as that found in the participates in the formation, development, and mainte-
GSE data analysis. The results revealed that the expres- nance of synapses of cortical neurons [25]. Borger et al.
sion levels of all DEGs, except for RPL23, decreased in the discovered the relationship between the expression of
blood of the 24-month-old mice compared to those in the EFHD2 and dementia through systematic and compre-
2-month-old mice (RPL23: p = 0.1882; ACTG1: p = 0.0025; hensive research, and showed that both protein and
DDX5: p < 0.0010; RPS6KB2: p = 0.0112; ALDOA: mRNA levels of EFHD2 decrease in the frontal cortex of
p = 0.0249; NOL6: p < 0.0010; EFHD2: p < 0.0010; AD and other dementias, such as frontotemporal lobar
HERPUD1: p = 0.0059; PRRT1: p = 0.0140; Figure 6c). degeneration. Meanwhile, the number of synapses is
Meanwhile, the expression of the nine DEGs in the hippo- affected by the loss of EFHD2 [26]. The survival rate of
campi decreased in the blood of 24-month-old mice com- newly formed adult neurons declines severely after
pared to that in 2-month-old mice (RPL23: p < 0.0010; ACTG1: EFHD2 knockout, beginning at the early stages of neuro-
p < 0.0010; DDX5: p < 0.0010; RPS6KB2: p < 0.0010; ALDOA: blasts. Moreover, severe tauopathy was observed in the
p = 0.0472; NOL6: p = 0.0172; EFHD2: p < 0.0010; HERPUD1: hippocampus of EFHD2 knockout mice [25]. This indi-
p < 0.0010; PRRT1: p = 0.0140; Figure 6d). cates that EFHD2 plays an essential role in the nervousBiomarkers of aging and Alzheimer’s disease 91
Figure 6: The mRNA expression levels of the nine identified DEGs in aging mice. Morris Water Maze (a) and Y-Maze tests (b) of 2- and
24-month-old mice. The mRNA expression levels of the nine identified DEGs in the blood (c) and hippocampi (d). 2 months, n = 10; 24
months, n = 9. *p < 0.05, **p < 0.01, ***p < 0.001 compared to 2 months.
system, and its altered expression is closely related to the phosphorylation of S6 leads to increased protein synth-
occurrence and development of AD. esis and cell proliferation [34]. Vázquez-Higuera et al.
DEAD-box proteins in eukaryotes (37 members in observed that compared with controls (39%), patients
humans) comprise the largest family of RNA helicases with AD (50%) showed a higher frequency of RPS6KB2
[27]; they participate in almost all aspects of RNA meta- (intron 2, rs917570) minor allele, and the age of onset was
bolism, including transcription, translation, and decay of 3 years later than that in nonminor allele carriers. More-
RNA [28]. DDX5 (p68), a critical component of the DEAD- over, the genetic variation in the tau kinase pathway
box family, is encoded by the DDX5 gene located in the (RPS6KB2 minor allele) is related to the increased risk
cell nucleus and shuttled between the nucleus and cyto- and later onset of AD [35]. The human ALDOA gene
plasm [29]. DDX5 dynamically regulates the processes of encodes the homotetrameric protein aldolase A, which
transcription, splicing programs, and miRNAs during cell is a single glycolytic enzyme in erythrocytes and skeletal
differentiation [30]. DDX5 also participates in ribosome muscle that catalyzes the reversible conversion of fruc-
biogenesis, cell proliferation, tumorigenesis, and cancer tose-1,6-bisphosphate to glyceraldehyde 3-phosphate and
development [31–33]. To date, the concrete relationship dihydroxyacetone phosphate. However, to our knowledge,
between DDX5 and AD is unknown. This study found that currently, no studies are available regarding the associa-
DDX5 significantly decreases in AD, and the downregula- tion between ALDOA and AD. RPS6KB2 and ALDOA were
tion of DDX5 may inhibit various biological functions, significantly downregulated in the present study in patients
such as ATP binding, hydrolysis, RNA binding and with AD. Moreover, ALDOA showed a significant correla-
unwinding, transcription, splicing, and cell proliferation tion with MoCA scores. Based on the previous findings, the
and differentiation, which may be the underlying patho- significant downregulation of ALDOA was assumed to lead
logical aspects of AD. to the reduction of aldolase A, which is an important reg-
The RPS6KB2 gene encodes a member of the ribo- ulator of glycolysis, which could lead to neurological
somal S6 kinase family of serine/threonine kinases, and abnormalities in patients with AD [36].92 Min Li et al.
Table 2: The summary of the gene expression files from public data and validating data
AD patients AD mice Aging mice
GEO datasets Blood Blood Hippocampus Blood Hippocampus
Upregulation RPL23 ↑ — ↓ — ↓
RPL37A ↓ ND ND ND ND
RPL5 ↓ ND ND ND ND
PPP1CB ↓ ND ND ND ND
RPL24 ↓ ND ND ND ND
THRA ↓ ND ND ND ND
CASP2 ↓ ND ND ND ND
SMARCD3 ↓ ND ND ND ND
NLN ↓ ND ND ND ND
MSH5 ↓ ND ND ND ND
EPDR1 ↓ ND ND ND ND
CDH1 ↓ ND ND ND ND
OTUB1 ↓ ND ND ND ND
RASL11B ↓ ND ND ND ND
COMMD8 ↓ ND ND ND ND
LAT2 ↓ ND ND ND ND
Downregulation ACTG1 ↓ ↓ ↓ ↓ ↓
DDX5 ↓ ↓ ↓ ↓ ↓
RPS6KB2 ↓ ↓ ↓ ↓ ↓
ALDOA ↓ ↓ ↓ ↓ ↓
NOL6 ↓ ↓ ↓ ↓ ↓
EFHD2 ↓ ↓ ↓ ↓ ↓
HERPUD1 ↓ ↓ ↓ ↓ ↓
PRRT1 ↓ ↓ ↓ ↓ ↓
Upregulation: ↑, Downregulation: ↓, None detection: ND, No change: —.
NOL6 (nucleolar protein 6) has been associated with (actin gamma 1) is involved in various types of cell moti-
ribosome biogenesis, which affects the function of many lity and in maintenance of the cytoskeleton, which also
cell types in ribosome biogenesis and protein translation affects spine formation, stabilization, and morphological
[37]. Previous studies regarding the relationship between changes of synapses [44]. All identified DEGs in the pre-
NOL6 and AD involved differential expression in sent study showed extensive biological, neuronal, and
Mn-exposed animals in frontal cortex tissues [38], and cellular functions and may be associated with the patho-
NOL6 was identified as one of the hub genes screened physiology of AD. Nevertheless, the functional role of
from the AD database [39]. HERPUD1 (homocysteine these DEGs in the progress and treatment of AD requires
inducible endoplasmic reticulum (ER) protein with ubi- further exploration in future.
quitin like domain 1) is important in the ER stress The association of AD with aging appears to indicate
response, which influences a number of diseases, that the majority of elderly people are subjected to a high
including neurodegeneration and cardiovascular disease probability of developing AD [45]. Common pathological
[40]. The expression of amyloid-β40 (Aβ40), a vital pro- factors involved in aging and AD is related to energy
tein in AD, is decreased in HERPUD1 knockout animal metabolism, inflammation, and microglial dysfunction
models [41]. PRRT1 (proline rich transmembrane protein [7]. In this study, nine DEGs reported to be associated
1) is a candidate of α-amino-3-hydroxy-5-methyl-4-isoxa- with protein synthesis, gene transcription, and glycolysis
zole-propionicacid receptor-associated protein as well as showed the same reduced changes in AD and aging.
a component of postsynaptic density [42], which is pro- Importantly, the decrease in the regulatory effect of these
minently expressed in the hippocampus, particularly DEGs was the same in the peripheral blood and central
in CA1. PRRT1 knockout mice have weaker excitatory hippocampi, indicating that they may serve as good can-
synapses, a loss of tetanus-induced long-term potentia- didates for the clinical diagnosis of AD. However, there
tion, and deficits in cognitive behaviors [43]. ACTG1 are same bioinformatics analysis researches that reportedBiomarkers of aging and Alzheimer’s disease 93
many biomarkers for AD based on the peripheral blood WT wild-type
mononuclear cell (PBMC) expression datasets [46,47]. YM Y maze
Meanwhile, the currently published relevant papers
were most associated with large-scale transcriptome or
proteomics analysis in the brain tissues and cerebro- Acknowledgements: We are grateful to all subjects who
spinal fluid samples [48–50]. The purpose of this study kindly agreed to participate in this study. This work was
is to select potential biomarkers from GSE database and supported by grants from the Projects of Medical and
validate the expression of these DEGs in peripheral Health Technology Development Program in Shandong
human AD samples and both peripheral/central nervous Province, China (2017WS157) and the National Natural
AD and aging mice samples, which could be served as Science Foundation of China (No. 81601189 to CL).
both the early diagnosis biomarkers and potential targeted
genes for pathological researches of AD or aging-related Conflict of interest: The authors state no conflict of
neurodegenerative disorders. interest.
A comprehensive analysis of gene expression profiles
was performed using systematic bioinformatics analysis Data availability statement: The datasets analyzed dur-
to select and identify 24 common DEGs. Nine of the 24 ing the current study are available in the GEO repository,
DEGs were confirmed using blood samples collected from http://www.ncbi.nlm.nih.gov/geo/. All data generated
patients with AD, and the mRNA levels of ACTG1 and and analyzed during this study are included in this pub-
ALDOA showed a significant correlation with the MoCA lished article and its supplementary information file.
scores. The levels of eight of the nine identified DEGs
were decreased in both the blood and hippocampi of
AD and aging mice, showing the same regulatory ten-
dency, which provides further evidence for the reason References
and accuracy to detect biomarkers from blood. These
eight genes could be served as both the early diagnosis [1] Alzheimer’s Association. 2020 Alzheimer’s disease facts and
biomarkers and potential targeted genes for pathological figures. Alzheimers Dement. 2020 Mar;16(3):391–460.
researches of AD. Our observations provided biomarkers [2] Kurz A, Perneczky R. Novel insights for the treatment of
for the early diagnosis, treatment, and prognosis of AD as Alzheimer’s disease. Prog Neuropsychopharmacol Biol
Psychiatry. 2011 Mar;35(2):373–9.
well as other neurodegenerative diseases.
[3] Cummings JL, Morstorf T, Zhong K. Alzheimer’s disease drug-
development pipeline: few candidates, frequent failures.
Alzheimers Res Ther. 2014 Jul;6(4):37.
[4] Karch CM, Cruchaga C, Goate AM. Alzheimer’s disease
Abbreviations genetics: from the bench to the clinic. Neuron. 2014
Jul;83(1):11–26.
AD Alzheimer’s disease [5] Giri M, Zhang M, Lü Y. Genes associated with Alzheimer’s
APP amyloid precursor protein disease: an overview and current status. Clin Interv Aging.
2016 May;11:665–81.
BPs biological processes
[6] Alzheimer’s Association. 2016 Alzheimer’s disease facts and
CCs cellular components figures. Alzheimers Dement. 2016 Apr;12(4):459–509.
DAVID visualization and Integrated Discovery [7] Yin F, Sancheti H, Patil I, Cadenas E. Energy metabolism and
DEGs differentially expressed genes inflammation in brain aging and Alzheimer’s disease. Free
ER endoplasmic reticulum Radic Biol Med. 2016 Nov;100:108–22.
GEO Gene Expression Omnibus [8] Mostafavi S, Gaiteri C, Sullivan SE, White CC, Tasaki S, Xu J,
et al. A molecular network of the aging human brain provides
GO Gene Ontology
insights into the pathology and cognitive decline of
KEGG Kyoto Encyclopedia of Genes and Genomes Alzheimer’s disease. Nat Neurosci. 2018 Jun;21(6):811–9.
MFs molecular functions [9] Edgar R, Domrachev M, Lash AE. Gene expression omnibus:
MoCA Montreal Cognitive Assessment NCBI gene expression and hybridization array data repository.
MWM Morris water maze Nucleic Acids Res. 2002 Jan;30(1):207–10.
[10] Huang W, Sherman BT, Lempicki RA. Systematic and integra-
NECs normal elderly controls
tive analysis of large gene lists using DAVID bioinformatics
PS1 presenilin 1 resources. Nat Protoc. 2009;4(1):44–57.
qPCR quantitative real-time PCR [11] Reiserer RS, Harrison FE, Syverud DC, McDonald MP. Impaired
SA spontaneous alternation spatial learning in the APPSwe + PSEN1DeltaE9 bigenic mouse94 Min Li et al.
model of Alzheimer’s disease. Genes Brain Behav. 2007 [27] Fairman-Williams ME, Guenther UP, Jankowsky E. SF1 and SF2
Feb;6(1):54–65. helicases: family matters. Curr Opin Struct Biol. 2010
[12] Jankowsky JL, Slunt HH, Ratovitski T, Jenkins NA, Copeland NG, Jun;20(3):313–24.
Borchelt DR. Co-expression of multiple transgenes in mouse [28] Dardenne E, Polay Espinoza M, Fattet L, Germann S,
CNS: a comparison of strategies. Biomol Eng. 2001 Lambert MP, Neil H, et al. RNA helicases DDX5 and DDX17
Jun;17(6):157–65. dynamically orchestrate transcription, miRNA, and splicing
[13] Livak KJ, Schmittgen TD. Analysis of relative gene expression programs in cell differentiation. Cell Rep. 2014
data using real-time quantitative PCR and the 2(-Delta Delta C Jun;7(6):1900–13.
(T)) Method. Methods. 2001 Dec;25(4):402–8. [29] Wang H, Gao X, Huang Y, Yang J, Liu ZR. P68 RNA helicase is a
[14] Li C, Meng F, Garza JC, Liu J, Lei Y, Kirov SA, et al. Modulation of nucleocytoplasmic shuttling protein. Cell Res. 2009
depression-related behaviors by adiponectin AdipoR1 recep- Dec;19(12):1388–400.
tors in 5-HT neurons. Mol Psychiatry. 2020 Jan. doi: 10.1038/ [30] Bourgeois CF, Mortreux F, Auboeuf D. The multiple functions of
s41380-020-0649-0. RNA helicases as drivers and regulators of gene expression.
[15] Li C, Meng F, Lei Y, Liu J, Liu J, Zhang J, et al. Leptin regulates Nat Rev Mol Cell Biol. 2016 Jul;17(7):426–38.
exon-specific transcription of the Bdnf gene via epigenetic [31] Sarkar M, Ghosh MK. DEAD box RNA helicases: crucial regu-
modifications mediated by an AKT/p300 HAT cascade. Mol lators of gene expression and oncogenesis. Front Biosci. 2016
Psychiatry. 2020 Oct. doi: 10.1038/s41380-020-00922-0. Jan;21(2):225–50.
[16] Meng F, Liu J, Dai J, Wu M, Wang W, Liu C, et al. Brain- [32] Yang L, Lin C, Liu ZR. Phosphorylations of DEAD box p68 RNA
derived neurotrophic factor in 5-HT neurons regulates helicase are associated with cancer development and cell
susceptibility to depression-related behaviors induced by proliferation. Mol Cancer Res. 2005 Jun;3(6):355–63.
subchronic unpredictable stress. J Psychiatr Res. 2020 [33] Saporita AJ, Chang HC, Winkeler CL, Apicelli AJ, Kladney RD,
Jul;126:55–66. Wang J, et al. RNA helicase DDX5 is a p53-independent target
[17] Liu J, Meng F, Dai J, Wu M, Wang W, Liu C, et al. The BDNF-FoxO1 of ARF that participates in ribosome biogenesis. Cancer Res.
Axis in the medial prefrontal cortex modulates depressive-like 2011 Nov;71(21):6708–17.
behaviors induced by chronic unpredictable stress in post- [34] Frödin M, Gammeltoft S. Role and regulation of 90 kDa ribo-
partum female mice. Mol Brain. 2020 Jun;13(1):91. somal S6 kinase (RSK) in signal transduction. Mol Cell
[18] Vorhees CV, Williams MT. Morris water maze: procedures for Endocrinol. 1999 May;151(1–2):65–77.
assessing spatial and related forms of learning and memory. [35] Vázquez-Higuera JL, Mateo I, Sánchez-Juan P, Rodríguez-
Nat Protoc. 2006;1(2):848–58. Rodríguez E, Pozueta A, Calero M, et al. Genetic variation in the
[19] Chiba T, Yamada M, Sasabe J, Terashita K, Shimoda M, tau kinases pathway may modify the risk and age at
Matsuoka M, et al. Amyloid-beta causes memory impairment -onset of Alzheimer’s disease. J Alzheimers Dis.
by disturbing the JAK2/STAT3 axis in hippocampal neurons. 2011;27(2):291–7.
Mol Psychiatry. 2009 Feb;14(2):206–22. [36] Vlassenko AG, Raichle ME. Brain aerobic glycolysis functions
[20] Reddy PH, Williams J, Smith F, Bhatti JS, Kumar S, Vijayan M, and Alzheimer’s disease. Clin Transl Imaging. 2015
et al. MicroRNAs, aging, cellular senescence, and Alzheimer’s Feb;3(1):27–37.
disease. Prog Mol Biol Transl Sci. 2017;146:127–71. [37] Tafforeau L, Zorbas C, Langhendries JL, Mullineux ST,
[21] Schindowski K, Bretteville A, Leroy K, Bégard S, Brion JP, Stamatopoulou V, Mullier R, et al. The complexity of human
Hamdane M, et al. Alzheimer’s disease-like tau neuro- ribosome biogenesis revealed by systematic nucleolar
pathology leads to memory deficits and loss of functional screening of Pre-rRNA processing factors. Mol Cell. 2013
synapses in a novel mutated tau transgenic mouse without any Aug;51(4):539–51.
motor deficits. Am J Pathol. 2006 Aug;169(2):599–616. [38] Guilarte TR, Burton NC, Verina T, Prabhu VV, Becker KG,
[22] Brina D, Miluzio A, Ricciardi S, Biffo S. eIF6 anti-association Syversen T, et al. Increased APLP1 expression and neuro-
activity is required for ribosome biogenesis, translational degeneration in the frontal cortex of manganese-exposed
control and tumor progression. Biochim Biophys Acta. 2015 non-human primates. J Neurochem. 2008
Jul;1849(7):830–5. Jun;105(5):1948–59.
[23] Meier S, Bell M, Lyons DN, Rodriguez-Rivera J, Ingram A, [39] Rahman MR, Islam T, Zaman T, Shahjaman M, Karim MR, Huq F,
Fontaine SN, et al. Pathological tau promotes neuronal et al. Identification of molecular signatures and pathways to
damage by impairing ribosomal function and decreasing identify novel therapeutic targets in Alzheimer’s disease:
protein synthesis. J Neurosci. 2016 Jan;36(3):1001–7. insights from a systems biomedicine perspective. Genomics.
[24] Yu W, Lu B. Synapses and dendritic spines as pathogenic 2020 Mar;112(2):1290–9.
targets in Alzheimer’s disease. Neural Plast. [40] Liu CL, Zhong W, He YY, Li X, Li S, He KL. Genome-wide analysis
2012;2012:247150. of tunicamycin-induced endoplasmic reticulum stress
[25] Regensburger M, Prots I, Reimer D, Brachs S, Loskarn S, response and the protective effect of endoplasmic reticulum
Lie DC, et al. Impact of Swiprosin-1/Efhd2 on adult inhibitors in neonatal rat cardiomyocytes. Mol Cell Biochem.
hippocampal neurogenesis. Stem Cell Rep. 2018 2016 Feb;413(1–2):57–67.
Feb;10(2):347–55. [41] Gao F, Zhang J, Ni T, Lin N, Lin H, Luo H, et al. HERPUD1 defi-
[26] Borger E, Herrmann A, Mann DA, Spires-Jones T, Gunn- ciency could reduce amyloid-β40 expression and thereby
Moore F. The calcium-binding protein EFhd2 modulates suppress homocysteine-induced atherosclerosis by blocking
synapse formation in vitro and is linked to human dementia. the JNK/AP1 pathway. J Physiol Biochem. 2020
J Neuropathol Exp Neurol. 2014 Dec;73(12):1166–82. Aug;76(3):383–91.Biomarkers of aging and Alzheimer’s disease 95
[42] Kirk LM, Ti SW, Bishop HI, Orozco-Llamas M, Pham M, [47] Chang WS, Wang YH, Zhu XT, Wu CJ. Genome-wide profiling of
Trimmer JS, et al. Distribution of the SynDIG4/proline-rich miRNA and mRNA expression in Alzheimer’s disease. Med Sci
transmembrane protein 1 in rat brain. J Comp Neurol. 2016 Monit. 2017 Jun;23:2721–31.
Aug;524(11):2266–80. [48] Wan YW, Al-Ouran R, Mangleburg CG, Perumal TM, Lee TV,
[43] Matt L, Kirk LM, Chenaux G, Speca DJ, Puhger KR, Pride MC, Allison K, et al. Accelerating medicines partnership-
et al. SynDIG4/Prrt1 is required for excitatory synapse develop- Alzheimer’s disease consortium. Meta-analysis of the
ment and plasticity underlying cognitive function. Cell Rep. 2018 Alzheimer’s disease human brain transcriptome and func-
Feb;22(9):2246–53. tional dissection in mouse models. Cell Rep. 2020
[44] Dillon C, Goda Y. The actin cytoskeleton: integrating form and Jul;32(2):107908.
function at the synapse. Annu Rev Neurosci. [49] Bai B, Wang X, Li Y, Chen PC, Yu K, Dey KK, et al. Deep multi-
2005;28(1):25–55. layer brain proteomics identifies molecular networks in
[45] Trevisan K, Cristina-Pereira R, Silva-Amaral D, Aversi- Alzheimer’s disease progression. Neuron. 2020
Ferreira TA. Theories of aging and the prevalence of Mar;105(6):975e7.
Alzheimer’s disease. BioMed Res Int. 2019 Jun;2019:9171424. [50] Higginbotham L, Ping L, Dammer EB, Duong DM, Zhou M,
[46] Ma G, Liu M, Du K, Zhong X, Gong S, Jiao L, et al. Differential Gearing M, et al. Integrated proteomics reveals brain-based
expression of mRNAs in the brain tissues of patients with cerebrospinal fluid biomarkers in asymptomatic and sympto-
Alzheimer’s disease based on GEO expression profile and its matic Alzheimer’s disease. Sci Adv. 2020 Oct;643:eaaz9360.
clinical significance. BioMed Res Int. 2019 Feb;2019:8179145. https://advances.sciencemag.org/content/6/43/eaaz9360You can also read