Dysregulated hematopoiesis in bone marrow marks severe COVID-19 - Nature
←
→
Page content transcription
If your browser does not render page correctly, please read the page content below
Wang et al. Cell Discovery (2021)7:60
                                    https://doi.org/10.1038/s41421-021-00296-9
                                                                                                                                                                                                        Cell Discovery
                                                                                                                                                                                                     www.nature.com/celldisc

                                     ARTICLE                                                                                                                                                    Open Access

                                    Dysregulated hematopoiesis in bone marrow
                                    marks severe COVID-19
                                    Xin Wang1,2, Yanling Wen1,2, Xiaowei Xie3,4, Yang Liu1, Xiaohua Tan5, Qingxian Cai6, Yawen Zhang3,4, Lin Cheng1,
                                    Gang Xu1, Shengyuan Zhang1,2, Haiyan Wang1, Lanlan Wei1, Xian Tang1, Furong Qi1,2, Juanjuan Zhao1,7, Jing Yuan8,
                                    Lei Liu1, Ping Zhu3,4, Florent Ginhoux9 ✉, Shuye Zhang 10 ✉, Tao Cheng 3,4 ✉ and Zheng Zhang 1,7,11 ✉

                                      Abstract
                                      Severe coronavirus disease 2019 (COVID-19) is often indicated by lymphopenia and increased myelopoiesis; however,
                                      the underlying mechanism is still unclear, especially the alteration of hematopoiesis. It is important to explore to what
                                      extent and how hematopoietic stem cells contribute to the impairment of peripheral lymphoid and myeloid
                                      compartments in COVID-19 patients. In this study, we used single-cell RNA sequencing to assess bone marrow
                                      mononuclear cells from COVID-19 patients with peripheral blood mononuclear cells as control. The results showed
                                      that the hematopoietic stem cells in these patients were mainly in the G1 phase and prone to apoptosis, with immune
                                      activation and anti-viral responses. Importantly, a significant accumulation of immature myeloid progenitors and a
                                      dramatic reduction of lymphoid progenitors in severe cases were identified, along with the up-regulation of
                                      transcription factors (such as SPI1, LMO4, ETS2, FLI1, and GATA2) that are important for the hematopoietic stem cell or
                                      multipotent progenitor to differentiate into downstream progenitors. Our results indicate a dysregulated
                                      hematopoiesis in patients with severe COVID-19.
                  1234567890():,;
1234567890():,;
                  1234567890():,;
1234567890():,;

                                    Introduction                                                                                        reported that COVID-19 may significantly affect the
                                      Coronavirus disease 2019 (COVID-19), which is caused by                                           hematologic and immunologic systems, leading to lympho-
                                    severe acute respiratory syndrome-coronavirus-2 (SARS-                                              penia5,6, thrombocytopenia7,8, coagulation disorders9–12,
                                    CoV-2), has become a global pandemic1. As of June 2021,                                             increase of HLA-DRLow classical monocytes8,13, accumula-
                                    over 179 million COVID-19 cases and 3.9 million deaths                                              tion of immature/dysfunctional CD10LowCD101–CXCR4+/–
                                    were confirmed world-wide (https://coronavirus.jhu.edu/                                              neutrophils,     and    disappearance  of    non-classical
                                    map.html)2. The impact of the virus infection varies                                                CD14LowCD16High monocytes14,15 in the blood and lungs,
                                    between different age groups. Old people, especially those                                          especially in severe cases with COVID-198.
                                    with co-morbidities, are more likely to develop severe                                                 In addition, abnormal interferon (IFN) production,
                                    symptoms3,4. More importantly, previous studies have                                                hyper-inflammatory responses, cytokine storms, inefficient
                                                                                                                                        or delayed induction of neutralizing antibodies, and spe-
                                                                                                                                        cific T cell responses may also be involved in the immu-
                                    Correspondence: Florent Ginhoux (Florent_Ginhoux@immunol.a-star.edu.sg)
                                                                                                                                        nopathogenesis of SARS-CoV-2 infection16–20. However,
                                    or Shuye Zhang (zhangshuye@shphc.org.cn) or Tao Cheng (chengtao@ihcams.
                                    ac.cn) or Zheng Zhang (zhangzheng1975@aliyun.com)                                                   the mechanisms underlying these changes are still
                                    1
                                     Institute for Hepatology, National Clinical Research Center for Infectious                         underexplored with current phenomena being understood
                                    Disease, Shenzhen Third People’s Hospital; The Second Affiliated Hospital,
                                                                                                                                        mainly by examining human peripheral blood or lung
                                    School of Medicine, Southern University of Science and Technology, Shenzhen,
                                    Guangdong, China                                                                                    tissue6,21–24. Peripheral immune cells are derived from
                                    2
                                     CAS Key Laboratory of Pathogenic Microbiology and Immunology, Institute of                         hematopoietic stem and progenitor cells (HSPCs) in bone
                                    Microbiology, Chinese Academy of Sciences (CAS), Beijing, China
                                                                                                                                        marrow (BM)25. In a recent report, recombinant receptor-
                                    Full list of author information is available at the end of the article
                                    These authors contributed equally: Xin Wang, Yanling Wen, Xiaowei Xie,                              binding subdomain 1 of spike protein of SARS-CoV-2
                                    Yang liu

                                    © The Author(s) 2021
                                                        Open Access This article is licensed under a Creative Commons Attribution 4.0 International License, which permits use, sharing, adaptation, distribution and reproduction
                                                        in any medium or format, as long as you give appropriate credit to the original author(s) and the source, provide a link to the Creative Commons license, and indicate if
                                    changes were made. The images or other third party material in this article are included in the article’s Creative Commons license, unless indicated otherwise in a credit line to the material. If
                                    material is not included in the article’s Creative Commons license and your intended use is not permitted by statutory regulation or exceeds the permitted use, you will need to obtain
                                    permission directly from the copyright holder. To view a copy of this license, visit http://creativecommons.org/licenses/by/4.0/.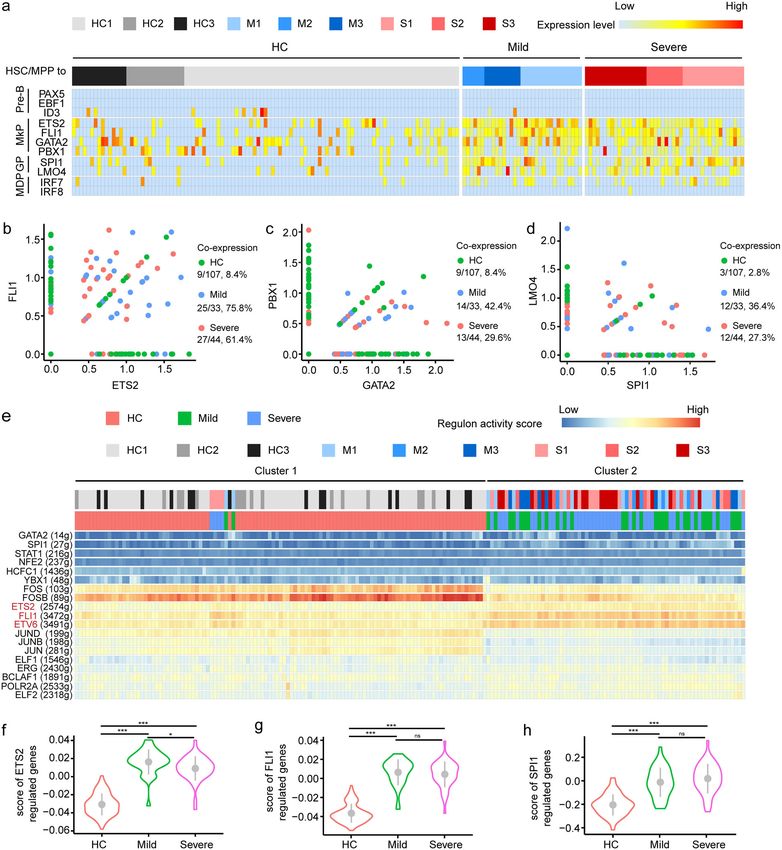
Wang et al. Cell Discovery (2021)7:60                                                                          Page 2 of 18

(RBD-SD1) was used as probe to study the potential              Routine blood cell tests (1–4 days before BM puncture)
tropism of SARS-CoV-2 in 33 types of normal human             showed that the number of red blood cells (RBCs)
tissues, and the results showed that over 80% of RBD-SD1      observed in three patients (M1, M3, S1) dropped out of
probe strongly interacted with BM cells26, suggesting the     the normal range, and four patients (M1, M2, M3, S1)
importance of understanding how COVID-19 affects the          exhibited lower hemoglobin (HGB) levels (Table 1). The
BM niche, especially the hematopoietic stem cell (HSC)27.     number of platelets in all patients stayed within the
   To further explore the mechanism, we used single-cell      reference range (125–350 × 109), except for S2 (412 ×
RNA sequencing (scRNA-seq) to analyze paired BM               109). Notable increase in the number of immature gran-
mononuclear cells (BMMCs) and peripheral blood                ulocytes could be found in all three severe cases (S1–S3)
mononuclear cells (PBMCs) from six COVID-19                   and one mild case (M3). In addition, M1, M2, M3, and S1
patients, and comprehensively dissected HSPC subsets          had low level of lymphocytes according to the reference
using specific lineage markers and a previously estab-         range (1.1–3.2 × 10⁹) (Table 1). Although the number of
lished reference dataset28. Interestingly, in severe          neutrophils from the six patients was within the reference
COVID-19 patients, lymphoid-primed progenitor cells           range, the neutrophil/lymphocyte ratio was higher in
were dramatically depleted, which did not happen in           patients with severe COVID-19 patients than in mild
mild cases, and the accumulation of immature                  cases (Table 1). Further BM examination of the six
granulocyte-monocyte progenitor cell (GMPs) were              COVID-19 patients (Table 2) revealed that the propor-
found in their BMMCs. Taken together, we concluded            tions of banded neutrophil in all COVID-19 patients were
that dysregulated hematopoiesis in BM could mark              lower than the reference range. In contrast, the percen-
severe COVID-19.                                              tages of segmented neutrophil increased in M1 (14.5%),
                                                              M2 (33.0%), S1 (43.5%), S2 (20.5%), and S3 (70.0%). Of
Results                                                       note, the severe cases contained much more segmented
Patient cohort                                                neutrophils in BMMCs, and the proportion of total
  We enrolled six patients aged 40–70 years old,              granulocytes in S1 and S3 was higher than the reference
including three with mild COVID-19 (M1, M2, and M3)           range. More importantly, the total erythrocytes jumped in
and three with severe COVID-19 (S1, S2, and S3) (Table        M1 and M3, but dramatically decreased in S1 and S3
1), and downloaded BMMC scRNA-seq data of three               (Table 2).
HCs in the same age range from public database29 as
control. The sample “B” (age 47) was renamed as healthy       Bone marrow cellular landscape in the studied population
control 1 (short as “HC1”) in this study, the sample “F”        We used Ficoll-based purification to isolate BMMCs
(age 41) as “HC2”, and sample “H” (age 50) as “HC3”29.        from BM punctures for scRNA-seq on droplet-based
Mild COVID-19 was defined as those with mild clinical          single-cell platform (Fig. 1a). Public BMMCs scRNA-seq
symptoms and not requiring mechanical ventilation,            data of three age-matched healthy subjects were used as
while severe COVID-19 as requiring hospitalization with       controls (Fig. 1a)29. Single-cell transcriptomes data
a low- to high-flow oxygen (Table 1). BM samples from          obtained from 32,042 BMMCs that derived from COVID-
six COVID-19 patients were collected ~20 days after           19 patients were analyzed together with 16,330 BMMCs
their hospitalization, and paired PBMC samples were           from HC, with averaged Mean Reads per Cell and a
collected 1 day before BM puncture, except that of            Median Genes per Cell being 123,494 and 1207 respec-
patient M2, whose sample was collected 10 days before         tively (Supplementary Table S1). The clustering analysis
BM puncture.                                                  was conducted by Uniform Manifold Approximation and
  Among the six COVID-19 patients, M1, M3, S1, and S2         Projection (UMAP), and five major cell types were iden-
had travel history from Wuhan, while S3 took a train that     tified, namely, natural killer (NK) & T cells (KLRF1,
started from Wuhan in January 2020. All six patients          CD3D), myeloid cells (FCN1), HSPC (CD34), B cells
were tested positive for SARS-CoV-2 mRNA and showed           (CD79A), and erythrocytes (CA1, HBD) (Fig. 1b, c).
symptoms of viral pneumonia at the admission of hos-          UMAP plot corresponding to each group/sample (Fig. 1d
pital. The S1 patient was identified as a severe case on the   and Supplementary Fig. S1a) showed similar cellular
2nd day after hospitalization, and relieved from severe       compositions, suggesting high data integration quality and
disease on the 20th day. However, the anal/nasal swab of      low batch effect. Then, we compared COVID-19 patients
S1 was still tested positive for SARS-CoV-2 mRNA even         and controls in terms of the percentages of the four major
on the 35th day. The S2 was recognized as a patient with      cell types (Fig. 1e), and found higher proportion of mye-
severe COVID-19 at the day of admission, and relieved         loid cells (26.8% in mild patients, 32.6% in severe cases, vs
on the 11th day. While S3 became severely ill on the 6th      17.5% in controls), while lower proportion of NK & T
day after hospitalization, and got out of severe illness at   lymphocytes (58.8% in mild patients, 54.9% in severe
17th day.                                                     cases, vs 67.9% in controls) in COVID-19 patients.
Wang et al. Cell Discovery (2021)7:60                                                                                   Page 3 of 18

Table 1 Clinical data of the enrolled patients.

                                                    M1          M2                M3            S1             S2       S3

Severity                                            Mild    Mild                  Mild         Severe        Severe     Severe
Gender                                              Male   Female                Female        Male           Male      Male
Age (years)                                         60 s        40 s              50 s          60 s          50 s      40 s
Bone marrow puncture (days after hospitalization)   21          14                 28           24             11       18
Oxygen requirement at the date of sampling          Non         Non               Non           Yes           Yes       Yes
                                                                                            Medium flow      Low flow     Medium flow
     a        9
WBC (×10 cells/L)                                   2.91        3.68              3.00          5.12          7.03      8.20
(RR: 3.5–9.5 × 10⁹)
RBCa (×1012 cells/L)                                3.8         4.14              3.44          2.97          4.71      4.58
(RR: 3.8–5.1 × 10¹²)
Plateleta (×109/L)                                  177         324               176           237           412       343
(RR: 125–350 × 109)
HGBa (g/L)                                          84          102                90           87            142       141
(RR: 115–150)
Immature granulocytea, %                            0.00        0.30              0.90          7.00          1.10      1.00
(RR: 0–0.6)
Lymphocytea (×109 cells/L)                          0.59        1.02              1.04          0.60          1.60      1.60
(RR: 1.1–3.2 × 10⁹)
Neutrophila (×109 cells/L)                          2.16        2.05              1.00          3.19          4.65      5.98
(RR: 1.8–6.3 × 10⁹)
Neutrophil to lymphocyte ratio                      3.66        2.01              0.96          5.32          2.90      3.74
           a      9
Monocyte (×10 cells/L)                              0.24        0.48              0.21          0.82          0.72      0.51
(RR: 0.1–0.6 × 10⁹)

The proportions of HSPC and B cells in the two groups                  In addition, the decline in T cells (Fig. 1h) was primarily
were comparable (Fig. 1e).                                             due to the reduced CD4+ naïve T cells (P = 0.03 in severe
  Referring to canonical cell-specific markers, the five                 vs HC, P = 0.06 in mild vs HC, Fig. 1i) and CD4+ memory
major types could be further separated into 20 distinct                T cells (P = 0.01 in severe vs HC, P = 0.22 in mild vs HC,
cell clusters (Fig. 1f, g), including CD4 naïve T (CD4,                Fig. 1I); whereas the percentages of other T cell subsets
LTB), CD8 naïve T (CD8A, SELL), MAIT (SLC4A10,                         were comparable (Supplementary Fig. S1e–h). In addi-
TRAV1–2), cytotoxic NK (XCL1, KLRF1), NK (KLRF1,                       tion, no significant change (P = 0.98 in severe vs HC, P =
NKG7), CD8 cytotoxic T (“CD8 Tc”, CD8A, GNLY),                         0.46 in mild vs HC) was observed from the proportion of
GZMK CD8 (CD8A, GZMK), γδ T (TRGV9, TRDC),                             NK cells (Supplementary Fig. S1i, j). Regarding myeloid
CD14 monocyte (CD14, FCN1), CD16 monocyte                              cells, the percentage of CD14+ monocytes in patients
(FCGR3A, FCN1), MPO granulocyte (MPO, AZU1), LTF                       with severe COVID-19 was significantly higher than that
granulocyte (CAMP, LTF), pDC (LILRA4), megakaryocyte                   in HC (P = 0.01, Fig. 1j). No HLA-DRLow monocyte was
(PPBP, PF4), immature B cell (TCL1A, PAX5), plasma                     found in BMMCs from COVID-19 patients, but an
cells (CD38, MZB1), proliferating cells (MKI67), HSPC                  immature-like LTF+ granulocyte witnessed significant
(CD34, AVP, CRHBP), and erythrocyte (CA1, HBD)                         increase in patients with severe COVID-19 (Fig. 1k, P =
(Fig. 1g). Possibly as a result of potential contamination of          0.001 in severe vs HC, P = 0.37 in mild vs HC). Notably,
blood cells during the BM aspiration process, decreased                the proportion of total B cells were comparable among all
number of BM T cells and increased number of mono-                     groups (Fig. 1l), but increased number of plasma cells
cytes/granulocytes were observed in patients with                      (P = 0.06 in severe vs HC, P = 0.09 in mild vs HC) and
COVID-19 in this study compared to HC, especially in                   decreased number of immature B cells (P = 0.10 in severe
those with severe disease (Fig. 1h), which was consistent              vs HC, P = 0.18 in mild vs HC) were observed in COVID-
with previously reported peripheral changes14,15,21,23.                19 patients, although not statistically significant (Fig. 1l).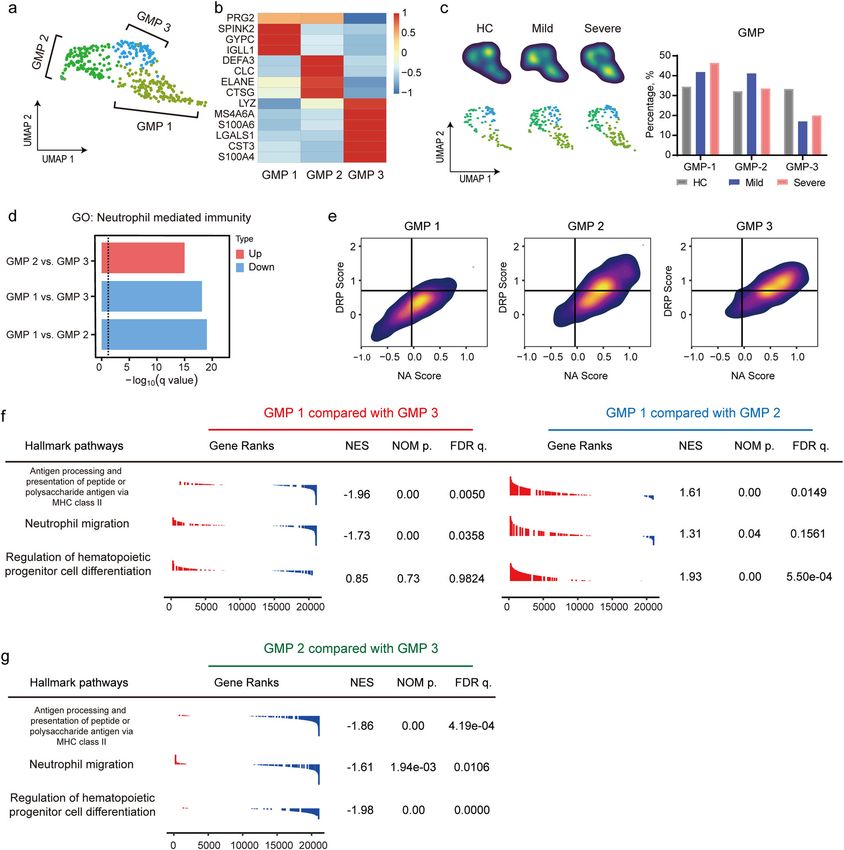
Wang et al. Cell Discovery (2021)7:60                                                                  Page 4 of 18

Table 2 Bone marrow examination in six COVID-19 patients.

Cell types (%)                     M1          M2                M3         S1              S2              S3

Promyelocyte                       1.50          –                 –        –               1.50             –
(RR: 0.97–2.17)
Neutrophil-myelocyte               7.50        6.00              7.80      1.50            3.50             –
(RR: 4.45–8.53)
Neutrophil-metamyelocyte           11.50       7.00             12.50      4.50            10.50            –
(RR: 5.93–9.87)
Banded neutrophil                  18.00       8.50             17.00      18.50           18.50            6.00
(RR: 20.22–27.20)
Segmented neutrophil               14.50       33.00            10.30      43.50           20.50            70.00
(RR: 6.52–12.36)
Eosinophil-myelocyte               0.50         –                 –         –               –               –
(RR: 0.15–0.61)
Eosinophil-metamyelocyte           1.00         –                0.50       –               –               –
(RR: 0.17–0.81)
Banded eosinophil                  0.50         –                 –         –              0.50             –
(RR: 0.64–1.86)
Segmented eosinophil                –          1.00              2.00      7.00            0.50             1.00
(RR: 0.25–1.47)
Prorubricyte                       2.00        1.00              1.30       –              2.50             –
(RR: 0.51–1.33)
Rubricyte                          12.50       5.50              4.50      0.50            9.50             –
(RR: 5.50–9.32)
Metarubricyte                      19.00       16.50            33.50      1.50            13.00            –
(RR: 8.39–13.11)
Mature lymphocyte                  9.00        17.50             9.50      15.00           14.50            18.00
(RR: 15.74–29.82)
Mature monocyte                    1.50        3.50              0.80      8.00            3.00             5.00
(RR: 0.00–3.00)
Mature plasma cell                 1.00        0.50              0.30       –              2.00             –
(RR: 0.00–0.71)
Total granulocyte                  55.00       55.50            50.20      75.00           55.50            77.00
(RR: 40.00–60.00)
Total erythrocyte                  33.50       23.00            39.20      2.00            25.00            0.00
(RR: 20.00–25.00)
Erythrocyte/nucleated cell ratio   0.50        0.30              0.64      0.02            0.33             0.00

RR reference range.

In addition, no significant difference was found regarding   No infection of SARS-CoV-2 in the BMMCs of COVID-19
the proportion of proliferating cells (Supplementary Fig.   patients
S1b), megakaryocytes (Supplementary Fig. S1c), or pDC         There was no difference in the expression of ACE2,
(Supplementary Fig. S1d) between COVID-19 patients          NRP1, and TMPRSS2 (SARS-CoV-2 receptors30)
and HC.                                                     between BMMCs of HC (Supplementary Fig. S1k) and
  Collectively, these data showed increased number of       those of COVID-19 patients (Supplementary Fig.
myeloid cells, decreased number of T cells, and a com-      S1l–m). BSG slightly elevated in most BMMCs from
parable level of HSPCs in the BM of COVID-19 patients       COVID-19 patients when compared with the HC.
when compared to HC.                                        Additionally, no SARS-CoV-2 genome was identified in
Wang et al. Cell Discovery (2021)7:60                                                                    Page 5 of 18

 Fig. 1 (See legend on next page.)

BMMCs by reads mapping (Fig. 1m) or Viral-Track              Both higher levels of ANPEP in monocytes and granu-
algorithm31 (Fig. 1n), while bronchoalveolar lavage fluid   locytes and higher levels of DPP4 in T cells and dendritic
(BALF) from COVID-19 patients6, used as control, was       cells were observed in COVID-19 patients compared
tested positive.                                           with HC (Supplementary Fig. S1k–m). In addition, the
Wang et al. Cell Discovery (2021)7:60 Page 6 of 18
(see figure on previous page)
Fig. 1 Characterization of BMMC compartments in COVID-19 patients. a Schematic diagram of the experimental design. ScRNA-seq of BMMCs
derived from six COVID-19 patients and three age-matched HCs from public library were analyzed. b Feature plot of transcription activities for the
marker genes of major cell types. c UMAP display of a total of 39,090 BMMCs. Five major cell types are indicated. d UMAP display of the distributions
of BMMCs from HCs, mild, and severe patients. e Proportions of four major cell types (excluding erythrocytes) in BMMCs for HCs, mild, and severe
patients. f UMAP display of 20 clusters. g Heatmap showing the relative expression of marker genes for each cell type. Colors indicate expression,
while the size of the circles represents the proportion of expressed cells. h Proportions of total T cells, total monocytes, and total granulocytes in HCs,
mild, and severe patients. i Fraction of CD4+ naïve T cells and CD4+ memory T cells among total cells. j Percentage of CD14+ monocyte among total
cells. k Proportion of LTF+ granulocytes among total cells. l Ratio of total B cells, plasma cells, and immature B cells among total cells. m The aligned
reads of the BMMC scRNA-seq dataset to the SARS-CoV-2 genome. The blue circle represents the genome of SARS-CoV-2, while red and gray circles
represent positive control (previously reported BALF scRNA-seq dataset from COVID-19 patients) and BMMC samples, respectively. n Viral-Track
analysis of the BMMCs scRNA-seq dataset. Only the positive control dataset (scRNA-seq data from BALF of COVID-19 patients6) showed QC passed
(diamond dot) signals of SARS-CoV-2. P values for pairwise comparisons were calculated, unpaired two-sided Student’s t-test, *P < 0.05, **P < 0.01,
***P < 0.001, n.s., not significant.
transcriptomic level of ST6GAL1 and ST3GAL4 also had relatively lower matching rates with the reference
increased in the BMMCs from COVID-19 patients dataset, the majority of the unmatched LMPP and MEP
(Supplementary Fig. S1–m). By Viral-Track analysis, was annotated as HSC/MPP (27.9% and 37.3%, respec-
although no evidence of viral infection was found in tively) (Supplementary Fig. S2a, c), suggesting an earlier
BMMCs of COVID-19 patients (Fig. 1n), patient M1, M3, change in transcriptome expression compared with sur-
and S3 were tested positive for respiratory syncytial virus face marker when HSC was differentiated into LMPP
RNA, herpes simplex virus, and EBV DNA, respectively, or MEP.
suggesting that co-infection of other pathogens should Then we examined the proportion of each HSPC cluster
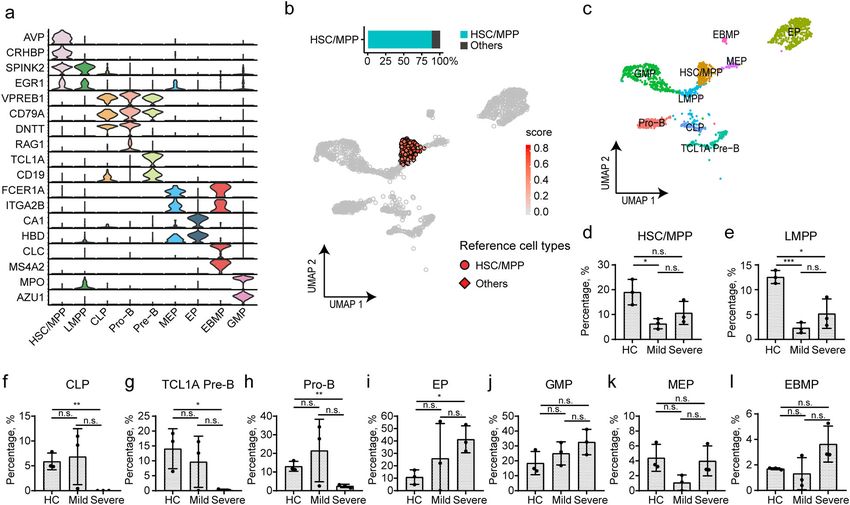
not be ignored in COVID-19. and found significant decrease of HSC/MPP in patients
with mild COVID-19 when compared with HC (Fig. 2d,
Characterization of HSPCs by cell-type-specific markers P = 0.02), and slight decrease in patients with severe
and a curated reference database COVID-19 (Fig. 2d, P = 0.10). Moreover, a marked
The depletion of T cells and the increase of myeloid cells decrease could be found in the proportions of LMPP
in patients with COVID-19 have been reported5,15,21,23. (Fig. 2e), CLP (Fig. 2f), TCL1A pre-B cells (Fig. 2g), and
Considering that no direct SARS-CoV-2 infection was Pro-B cells (Fig. 2h) from COVID-19 patients with severe
observed in BMMCs, we hypothesized that an altered dif- cases when compared to the HC group (Fig. 2e–h), while
ferentiation of HSPCs might have occurred during this only the proportion of LMPP was significantly decreased
process. Therefore, we stratified CD34+ cells from BMMCs in mild cases (Fig. 2e). In contrast, the proportion of EP
and conducted a re-cluster analysis to precisely map HSPC (Fig. 2i) increased in patients with severe COVID-19,
heterogeneity. Nine progenitor cell clusters (Fig. 2a–c) while no difference was found in that of MEP and EBMP
were identified, including hematopoietic stem cell/multi- (Fig. 2k, l). In summary, the lymphoid progenitors
potent progenitor cell (HSC/MPP, markers: AVP, CRHBP), decreased significantly, while EP increased significantly in
lymphoid-primed multipotent progenitor (LMPP, markers: patients with severe COVID-19. In addition, the propor-
SPINK2, EGR1), megakaryocyte-erythrocyte progenitor cell tions of GMP slightly rose in those mild or severe cases
(MEP, markers: FCER1A, ITGA2B, HBD), common lym- when compared with HC (Fig. 2j).
phoid progenitor cell (CLP, markers: DNTT, SPINK2),
eosinophil/basophil/mast progenitor cell (EBMP, markers: HSC/MPP is immune activated, non-proliferating, and
CLC, MS4A2), GMP (markers: MPO, AZU1), erythrocyte prone to cell death in COVID-19 patients
progenitor (EP, markers: CA1, HBD), Pre-B (markers: As described above, the lymphoid progenitors were
TCL1A, CD19), and Pro-B (markers: VPREB1, RAG1). depleted in patients with severe COVID-19, suggesting
To further validate the naming, we conducted cross- that the perturbations of the lymphoid and myeloid
reference for the nine clusters with a previously estab- compartments may be attributed to abnormal differ-
lished scRNA-seq dataset of immunophenotype-guided entiation of upstream HSC/MPPs. Therefore, we first
HSPCs28, and the transferred cell-type annotation to our investigated whether HSC/MPPs were active or quiescent.
BMMCs dataset. We found that 88.6% of HSC/MPP cells Interestingly, gene expression analysis revealed that most
(Fig. 2b), 50.6% of LMPP (Supplementary Fig. S2a), 76.9% HSC/MPPs from both controls and COVID-19 patients
of CLP (Supplementary Fig. S2b), and 55.9% of MEP stayed in the G1 phase (Fig. 3a), a quiescent/non-pro-
(Supplementary Fig. S2c) could be consistently annotated liferating state. Next, differentially expressed genes
by the reference dataset. Even though LMPP and MEP (DEGs) in the HSC/MPPs from COVID-19 patients andWang et al. Cell Discovery (2021)7:60 Page 7 of 18 Fig. 2 Annotation of HSPCs by cell-specific markers and immunophenotype-based reference dataset. a Violin plots show the expression of cell-specific markers for nine HSPC clusters. b Label transfer of HSC/MPP population according to an immunophenotype-based reference dataset. c UMAP displays the distribution of nine cell clusters of HSPCs. d–l The proportion of nine clusters in HSPCs from HC and COVID-19 patients. P values for pairwise comparisons were calculated, unpaired two-sided Student’s t-test, *P < 0.05, **P < 0.01, ***P < 0.001, n.s., not significant. HC were analyzed (Supplementary Table S2), and gene suggested that the differentiation tendency of HSC/MPP ontology (GO) analysis of the DEGs of HSC/MPPs cells might have been altered in COVID-19 patients. demonstrated enrichment of “neutrophil-mediated immunity” (Fig. 3b) and type I IFN-related pathway The differentiation of HSC/MPP cells from COVID-19 (Fig. 3b, c) in COVID-19 patients, indicating an immune patients is changed at transcriptional level activated status of HSC/MPP cells. Notably, autophagy HSC/MPPs gradually lose their stemness alongside their (Fig. 3b), necroptosis (Supplementary Fig. S2d–f), and differentiation trajectory32,33. Here, we calculated stem- apoptosis pathway (Fig. 3b, d) were also significantly up- ness score32 (see Materials and methods section) for each regulated in COVID-19 patients compared with HC. The single HSPC, and found that HSPCs with a high stemness proportion of apoptotic Annexin V+ HSCs in total Lin– score from HC outnumbered those from COVID-19 D34+CD38– D45RA–CD90+CD49f+ HSCs from COVID- patients (Fig. 3f). Moreover, the HSC/MPPs from 19 patients was higher than in HC, but lower than in COVID-19 patients have lower stemness score when samples collected from patients diagnosed with avascular compared with those from HC (Supplementary Fig. S2l). necrosis of the femoral head and co-infected with human Then, to determine the earliest turning point at which immunodeficiency virus or hepatitis virus, which worked HSC/MPP exited from their naïve status, we ranked HSC/ as positive control (Fig. 3e and Supplementary Fig. MPP according to their stemness scores, and stratified S2g–k). More importantly, the biological processes related them every five percentiles and followed the expression to myeloid cell development and hematopoietic pro- pattern of lineage-specific markers (Supplementary Table genitor cell differentiation were significantly up-regulated S3 and Fig. S3a–f). Results showed that, in HC group, in COVID-19 patients (Fig. 3b), including “regulation of egress of HSC/MPP from stem cell status started at DNA-binding TF activity”, “regulation of hemopoiesis”, ~90–95% and expressed lymphoid associated gene mod- “myeloid cell development”, “hematopoietic progenitor ule (e.g., IL32 and NKG7) and erythrocyte progenitor cell differentiation”, and “RNA splicing”. These results associated gene module (e.g., HBD), suggesting lymphoid
Wang et al. Cell Discovery (2021)7:60   Page 8 of 18

 Fig. 3 (See legend on next page.)
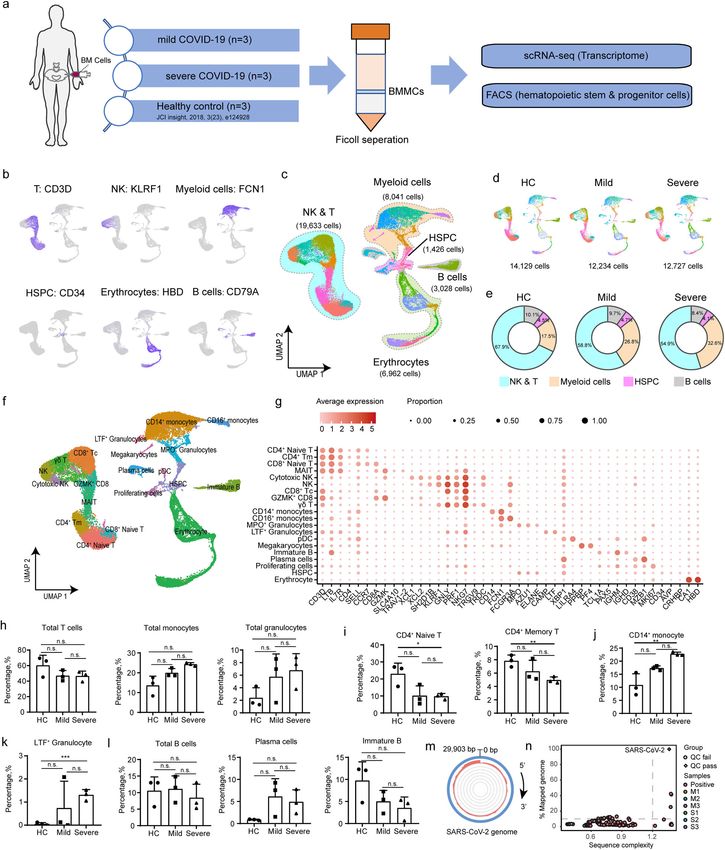
Wang et al. Cell Discovery (2021)7:60                                                                                                   Page 9 of 18

 (see figure on previous page)
 Fig. 3 Perturbed differentiation tendency of HSC/MPP in COVID-19 patients. a Percentages of G1, S, and G2M phase for HSC/MPP population
 from HC and COVID-19 patients. b Enriched GO terms of up-regulated genes in the HSC/MPP population from COVID-19 patients. Three pathways
 were clustered into immune response-associated pathways, three were identified associated with virus response, two were related to apoptosis and
 autophagy, and five pathways participated in the processes of differentiation. c Heatmap showing the significant different expression patterns of IFN-
 stimulated genes in the HC, mild, and severe groups. d GSEA analysis of transcriptome comparisons in HSC/MPP shows that the KEGG pathway
 “Apoptosis” (Entry ID: hsa04210) was enriched in COVID-19 patients vs controls. e Proportion of Annexin V+ HSC in total HSC with flow cytometry.
 Results were compared among the HC, mild group, and severe group and two positive controls (PC). f Stemness signature scores of HSPCs from HC,
 mild, and severe patients projected onto 2c graph. Red color represents a higher stem score. g, h Gene pairwise Spearman correlation within the
 90%–95% (HC) and 95%–100% (Mild group, Severe group) of the stem score. g The projection of corresponding cells onto the core model with
 corresponding percentile. h The heatmap of gene pairwise Spearman correlation. i RNA velocity analysis of HSPC cells among the HC, mild, and
 severe group. Upper panel projects the velocity field onto the UMAP plot of HSPC in the three groups. Lower panel shows the numbers and ratios of
 predicted differentiation endpoint of HSC/MPPs in the three groups.

and erythroid differentiation potential of HSC/MPP in                        Up-regulation of megakaryocyte progenitor and
HC (Fig. 3g, h). In contrast, first five percentiles of HSC/                   granulocyte progenitor-priming transcription factors in
MPPs from COVID-19 patients started to express gene                          the HSC/MPP of COVID-19 patients
modules associated with GMP and EP, rather than lym-                            Transcriptional factors (TFs) work as the driver of the
phoid compartments (Fig. 3g, h).                                             differentiation process of HSC/MPPs. To explore whether
  To further verify these results, RNA velocity algorithm                    lineage-primed TFs were affected in HSC/MPP cells from
was applied to model the differentiation trajectory of                       COVID-19 patients, we examined canonical lineage-
HSPCs33. The calculated velocity was projected onto the                      priming TF modules, including Pre-B-priming TFs
UMAP plots of HSPCs from all three studied groups                            (namely PAX5, EBF1, ID3), megakaryocyte progenitor
(Fig. 3i, upper panel and Supplementary Fig. S3g), and                       cells (MkP)-priming TFs (namely ETS2, FLI1, GATA2,
each sample (Supplementary Fig. S3h–j). As expected, the                     PBX1), granulocyte progenitor (GP) priming-TFs (namely
velocity-arrow of HSC/MPPs primarily pointed to MEPs                         SPI1, LMO4), and MDP-priming TFs (namely IRF7,
in HC, consistent with the cognition that HSC cells have a                   IRF8)34–36.
megakaryocyte-priming potential. In contrast, the HSC/                          In all, 8 out of 107 HSC/MPP cells in HC and 2 out of
MPPs cells from COVID-19 patients exhibited an atte-                         77 HSC/MPP cells in COVID-19 patients with mild dis-
nuated “velocity” (differentiation potential) to MEPs,                       ease expressed ID3, but not in severe cases, although
suggesting an altered differentiation tendency in these                      PAX5 and EBF1 were not identified (Fig. 4a). Regarding
cells. Moreover, the proportions of differentiation end-                     the MkP-priming TFs, significant co-expression of ETS2-
points of HSC/MPPs in the three groups were investi-                         FLI1-GATA2-PBX1 and SPI1-LMO4 was observed in the
gated. Results showed that 84.1% of HSC/MPPs from HC                         HSC/MPPs from COVID-19 patients (Fig. 4a), with 75.8%
were predicted to preferentially differentiate into MEP                      and 61.4% of HSC/MPPs co-expressing ETS2 and FLI1 in
cells (Fig. 3i, bottom left), while most of the HSC/MPPs                     the mild and severe cases, respectively, compared with
from patients with mild (57.6%) and severe (59.1%)                           8.4% in HC (Fig. 4b). 42.4% and 29.6% of HSC/MPPs co-
COVID-19 were predicted to preferentially differentiate                      expressing GATA2 and PBX1 were observed in the mild
into GMPs (Fig. 3i, bottom middle and bottom right).                         and severe groups, respectively, compared with 8.4% in
Although HSC/MPPs did not directly differentiate into                        HC (Fig. 4c). The co-expression of SPI1 and LMO4 in
EPs, MEPs from COVID-19 patients showed much                                 HSC/MPPs was 36.4% and 27.3% in mild and severe
stronger tendency to differentiate into EPs than in HC.                      groups, respectively, compared with 2.8% in controls (Fig.
The HSC/MPPs from mild COVID-19 cases kept the                               4d). Regarding MDP-priming TFs, only five of 107 HSC/
potential of differentiating into pro-B cells, while the cells               MPPs (4.7%) from HC expressed IRF7, while 36.4% (12/
from severe cases were prone to differentiate into                           33) of mild cases and 29.6% (13/44) of severe cases
myeloid-associated lineages, including GMPs, EBMPs,                          expressed IRF7 (Fig. 4a).
and LMPPs. These results revealed that the HSC/MPPs                             To further investigate the transcriptional regulation, we
from COVID-19 patients preferentially differentiated into                    analyzed gene regulatory networks of HSC/MPPs using an
GMP, rather than the lymphoid progenitors (Fig. 3h, i).                      unsupervised algorithm named SCENIC37. Interestingly,
This agitation may partially contribute to the aforemen-                     the HSC/MPP cells were separated into two major sub-
tioned decrease of LMPPs, CLPs, Pro-B, Pre-B and the                         sets, namely cluster 1 and cluster 2. Cluster 1 contained
increase of GMPs and EPs in patients with COVID-19,                          all the 107 HSC/MPPs from the HC but only two HSC/
particularly in those severe cases.                                          MPPs from mild cases and four HSC/MPPs from severe
Wang et al. Cell Discovery (2021)7:60                                                                                                       Page 10 of 18

 Fig. 4 Transcriptional regulation underlies HSC/MPP from COVID-19 patients. a Heatmap displays the expression levels of lineage-priming TFs for
 HSC/MPP cells from HCs, mild, and severe patients. Five gene modules involved in hematopoiesis differentiation are presented, including pre-B (PAX5,
 EBF1, and ID3), MkP (ETS2, FLI1, GATA2, and PBX1), GP (SPI1, LMO4), and MDP (IRF7, IRF8). b–d Co-expression of selected TFs was assessed across different
 groups. e Heatmap showing the regulon activity scores (RASs) of lineage-related TFs for HSC/MPP cells from HCs, mild, and severe patients. 184 HSC/MPP
 cells were arranged by unsupervised clustering according to their regulon activities. f–h Score of specific TF-regulated genes in three groups.

COVID-19 cases, and the other 31 cells in mild cases and                       patients and those from HC (Fig. 4e and Supplementary
40 cells in severe cases were clustered into cluster 2                         Fig. S4a). Consistently, the regulons including GATA2,
unsupervisedly, indicating marked difference between reg-                      SPI1, ETS2, FLI1, and ETV6 were activated in COVID-19
ulatory TF landscapes of the HSC/MPPs from COVID-19                            patients (Fig. 4e). In addition, we conducted score analysis
Wang et al. Cell Discovery (2021)7:60 Page 11 of 18
to examine the transcriptional level of TF-downstream among the six studied COVID-19 patients. The SARS-
target genes, and identified substantial increase in scores of CoV-2-specific antibodies detected in mild and severe
ETS2, FLI1, and SPI1 in COVID-19 patients compared with cases were at similar levels, including SARS-CoV-2-
controls (Fig. 4f–h and Supplementary Fig. S4d–f). In specific total immunoglobulins (Fig. 5e, left panel), IgGs
comparison, the scores of GATA2 significantly increased (Fig. 5e, right panel), IgA (Supplementary Fig. S5b, left
only in HSC/MPPs from patients with severe COVID-19, panel), and IgM (Supplementary Fig. S5b, right panel).
rather than in those from mild cases when compared with With further analysis of the NK & T cell compartments
HC (Supplementary Fig. S4b, g). In addition, no significant from PBMCs and BMMCs, we identified 14 clusters,
difference was found between mild and severe groups, namely CD4+COTL1high T, CD4+GZMHhigh T,
except the ETS2 (Fig. 4f). In contrast, the score of PBX1, a CD4+GZMKhigh T, CD4+LTBhigh T, CD4+ naïve T,
MkP priming TF, and more importantly, a regulator of HSC CD8+GZMAhigh T, CD8+GZMHhigh T, CD8+GZMKhigh
self-renewal38, was lower in the severe COVID-19 group T, CD8+ naïve T, γδ T, NK, proliferating cells, MAIT, and
than in controls (Supplementary Fig. S4c, h). Collectively, Treg (Supplementary Fig. S5c–f). There was lower pro-
MkP- and GP-priming TFs, including ETS2, FLI1, SPI1, and portion of CD4+GZMKhigh T cells (Supplementary Fig.
GATA2 were activated in the HSC/MPP cells from S6a), but a higher proportion of CD4+GZMHhigh T cells
COVID-19 patients, probably contributing to the increased in severe cases than in mild cases (Supplementary Fig.
output of myeloid progenitor cells and decreased output of S6a). T-cell receptor (TCR) clonotype analysis revealed
lymphoid progenitors. that clonally expanded T cells in the PBMCs were mainly
comprised of CD4+GZMHhigh T cells, CD8+GZMHhigh
Depletion of lymphoid progenitors did not have significant T cells, and CD8+GZMKhigh T cells (Supplementary Fig.
impact on the production of SARS-CoV-2-specific S6b), with T cell expansion level being significantly lower
antibodies or T-cell response in COVID-19 patients in BMMCs than in PBMCs (Supplementary Fig. S6c).
To dissect the impact of the perturbed BM immune Shannon diversity index analysis demonstrated lower
landscape on peripheral immune response during TCR diversity of CD4+ T cells in severe cases, indicating a
COVID-19, we analyzed the single-cell transcriptomic higher clonal expansion (Supplementary Fig. S6d) and
profile of paired PBMCs. This dataset included five paired higher TCR diversity of the CD8+ T cells in BMMCs from
PBMCs (M1, M3, S1, S2, and S3) collected 1 day before severe cases (Supplementary Fig. S6d). Migration analysis
BM puncture, one from M2 collected 10 days before BM showed that the CD4+GZMHhigh T, CD4+GZMKhigh T,
puncture, and 3 PBMCs from HCs21 as controls. CD8+GZMAhigh T, CD8+GZMHhigh T, and CD8+
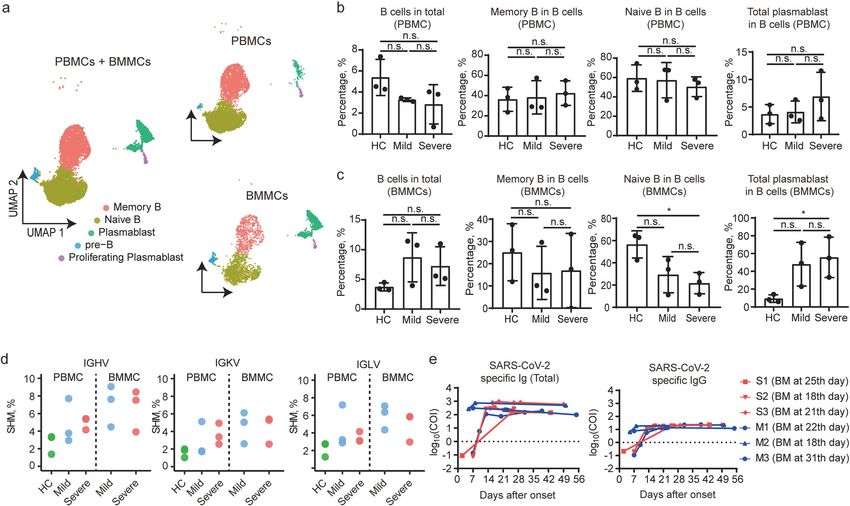
Combined analysis of BMMCs and PBMCs revealed that GZMKhigh T cells had higher levels of TCR sharing
the B cells were comprised of five clusters, namely pre-B between PBMCs and BMMCs (Supplementary Fig. S6e, f),
(characterized by VPREB1, IGLL1), naïve B cell (IGHD, indicating significant migration of those subsets between
TCL1A), memory B cell (CD79B, CD82), plasmablast the blood and BM niche. Further analysis showed that the
(IGHA1, IGHG1), and proliferating plasmablast (TUBA1B, clonally expanded T cells (>100 cells) were not hyper-
GAPDH) (Fig. 5a and Supplementary Fig. S5a). The pro- activated or more exhausted (Supplementary Fig. S6g–j),
portion of B cells in PBMC cells decreased in COVID-19 suggesting preserved function of T cells from COVID-19
patients when compared with controls, but it was not patients despite reduced lymphoid progenitors. Therefore,
statistically significant. Additionally, no significant differ- the depletion of BM lymphoid progenitors in COVID-19
ence could be found in the proportions of memory B cells, patients did not have significant impact on the functional
naïve B cells, and total plasmablasts in different groups immune responses of their peripheral lymphoid com-
(Fig. 5b). Neither could it be found in the proportion of B partments against the virus.
cells in BMMC cells from COVID-19 patients (Fig. 5c).
However, the increased accumulation of antibody- Immature GMPs accumulated in severe COVID-19 patients
secreting cells in BM could be indicated by significant As reported recently, accumulation of immature and
decrease in naïve B cells along with considerable increase immunosuppressive neutrophil was found in both the
in plasma cells identified in patients with severe COVID- blood and lungs of COVID-19 patients14,15, suggesting
19 when compared with mild cases (Fig. 5c). The amount emergency myelopoiesis. As revealed above, we identified
of somatic hypermutations (SHM) of the B-cell receptors increase in GMPs from patients with severe COVID-19
(BCRs) in PBMCs from COVID-19 patients was also (Fig. 2j), and therefore decided to extract the GMPs
found to be higher than controls (Fig. 5d). cluster for further analysis. Three GMP clusters were then
We then tested the serial serum samples collected identified (Fig. 6a) as GMP-1 (SPINK2, GYPC), GMP-2
between 0 and 56 days after hospitalization to figure out (ELANE, DEFA3), and GMP-3 (LYZ, LGALS1, S100A6,
whether the decrease of lymphoid progenitor cells affec- S100A4) (Fig. 6b). GMP-3, GMP-2, and GMP-1 were
ted the production of SARS-CoV-2-specific antibodies enriched in HC, mild, and severe cases, respectivelyWang et al. Cell Discovery (2021)7:60 Page 12 of 18 Fig. 5 Analysis of B cells from BMMCs and paired PBMCs and production of SARS-CoV-2-specific antibody in COVID-19 patients. a UMAP plot of B cells from BMMCs and PBMCs. b, c Proportion of B cells among total cells and three types of B cells among total B cells, with results from PBMC samples (b) and BMMC samples (c). d Somatic hypermutation rate of IGHV, IGKV, and IGLV from three groups and two origins. e Total SARS- CoV-2-specific antibody titers and SARS-CoV-2-specific IgG titers of six patients at different time points after symptom onset. The BM puncture was done between the 18th and 31st day after symptom onset. (Fig. 6c). Pre-maturation markers, such as MPO, were and “neutrophil activation (NA)” (see Materials and enriched in GMPs (Supplementary Fig. S7a), which are methods section) among three sub-clusters of GMPs. reminiscent of immature monocytes/neutrophils39 that Although the GMPs from patients had relatively higher produced under pathological conditions, including severe DRP and NA scores than those from the HC (Supple- infection and sepsis15. Compared with GMP-1 in the HC mentary Fig. S7f–h), GMP-1 had a significantly lower group, GMP-1 from the patient group contained more DRP and NA score than GMP-2 and GMP-3 (Fig. 6e). S100A8high (Supplementary Fig. S7b) and HLA-DRAlow Gene Set Enrichment Analysis (GSEA) analysis revealed (Supplementary Fig. S7d) cells and also highly expressed that the hallmark genesets associated with “antigen pro- IFN-stimulated genes, such as ISG15 (Supplementary Fig. cessing and presentation” and “migration” were down- S7b). In addition, previously reported genes (CD24, LCN2. regulated in GMP-1 compared with GMP-3 (Fig. 6f, g). In Supplementary Fig. S7c), which were associated with poor addition, analysis of pathways associated with “hemato- clinical outcomes in sepsis, together with functional poietic progenitor cell differentiation” indicated an exhaustion makers (CD274, ARG1, Supplementary Fig. upstream position of GMP-1 and GMP-3 (Fig. 6f, g). S7e) were not well expressed15,40. GMP-2 had a similar Immature GMP-1 was significantly accumulated in the transcriptional profile with GMP-1 (Supplementary Fig. BM of patients with severe COVID-19 and slightly S7a–e), while GMP-3 had lower levels of ISG15 (Sup- increased in mild cases compared with controls, sup- plementary Fig. S7b) and normal levels of HLA-DR related porting the hypothesis that “emergency myelopoiesis” in genes (Supplementary Fig. S7d). severe COVID-19 leads to an accumulation of immature Further analysis revealed that GMP-1 is likely to myeloid cells in the periphery and contributes to the become dysfunctional in patients with severe COVID-19 pathophysiology of the disease. (Fig. 6d, e). GO analysis showed the “neutrophil-mediated immunity” pathway was down-regulated in GMP-1, but Discussion up-regulated in GMP-2 (Fig. 6d). We also compared the Host immune responses play crucial roles in resisting signature scores of “defense response to pathogen (DRP)” viral infections, and a damaged immune response can
Wang et al. Cell Discovery (2021)7:60                                                                                             Page 13 of 18

 Fig. 6 Immature and dysfunctional-like GMP was accumulated in severe COVID-19 patients. a UMAP plot of three clusters of GMP, namely
 GMP 1, GMP 2, and GMP 3. b Differential expression genes of three GMP clusters. c Density plot of three GMP clusters in three groups. d Up-
 regulation or down-regulation of GO pathway “Neutrophil-mediated immunity” in three clusters of GMP. e DRP score and NA score of the three GMP
 types. f, g GSEA analysis of GMP 1, GMP 2, and GMP 3 on the three hallmark pathways.

induce a range of detrimental pathologic consequences41.                  cytokine storm in an indirect manner5. This study has
Accumulating evidence has shown that patients with                        provided novel evidence connecting lymphopenia with
severe COVID-19 would exhibit cytokine storm syn-                         suppressed generation of lymphoid progenitors from
drome2,18, which was often associated with an imbalanced                  HSC/MPP cells in COVID-19 patients. This suppression
immune system, and were characterized by the accumu-                      was associated with specific up-regulation of granulocyte-
lation of myeloid cells and depletion of lymphoid                         monocyte and megakaryocyte progenitor-priming TFs
cells8,21,23. Moreover, it is unclear whether lymphopenia is              (including SPI1, LMO4, ETS2, FLI1, and GATA2) in HSC/
caused directly by SARS-CoV-2 infection, or via a                         MPP, thus leading to an increased production of GMP,
Wang et al. Cell Discovery (2021)7:60                                                                          Page 14 of 18

MkP, and EP from HSC/MPP, accompanied by the                    in this study were consistent with the previous reports, but
reduction of lymphoid progenitors. Along with the poor          did not include neutrophils as these cells were excluded
ability to regulate hematopoietic progenitors, increased        through Ficoll density centrifugation. Moreover, the
proportions of myeloid cells, monocytes, and granulo-           BMMC samples from other acute respiratory virus-related
cytes, as well as a depletion of T cells in BMMCs from          diseases, such as influenza, should be enrolled as controls,
COVID-19 patients were observed in this study, and              to further identify specific features of COVID-19.
increase in the proportion of immature granulocytes in            In conclusion, by identifying the drastic decrease in the
the blood of these COVID-19 patients was also identified,        number of lymphoid progenitors along with significant
particularly in those severe cases (Table 1).                   accumulation of immature and dysfunctional-like GMPs
   Up-regulation of ETS2, FLI1, GATA2, and ETV6 in the          in BM of patients with severe COVID-19 as the possible
HSC/MPPs of COVID-19 patients raised the speculation            cause of the biased differentiation of HSC/MPP cells into
that the HSC/MPPs preferentially differentiated into MkP        granulocyte–monocytes rather than lymphoid lineage,
cells. However, the percentage of MEP cells and upstream        this study highlights the potential of therapeutics that
of MkP from COVID-19 patients were reduced in com-              correct the imbalanced differentiation of HSC/MPPs to be
parison to controls. These counterintuitive results may be      adopted as clinical treatment of COVID-19.
attributed to several factors. First, HSC/MPPs in COVID-
19 patients could be more prone to necroptosis and              Materials and methods
apoptosis than those in controls, which might lead to the       Preparation of BMMCs and PBMCs
loss of progenitor cells. Second, the growing evidence            We collected BM aspirates and blood samples from
shows that HSCs are megakaryocyte-primed by                     three patients with mild COVID-19 (M1, M2, M3) and
default27,42, and thus they may bypass the traditional MEP      three with severe COVID-19 (S1, S2, S3), and used Public
differentiation checkpoint. Consistently, as the marker of      BMMCs scRNA-seq data of three age-matched healthy
megakaryocyte-biased HSCs, the expression of ITGA2B             subjects29 and three PBMCs from HCs21 as controls. The
(CD41) was up-regulated in the HSC/MPPs of COVID-19             study protocols have been approved by the Institutional
patients, despite the rarely found VWF+ HSC/MPP (a              Ethics Committee of Shenzhen Third People’s Hospital
megakaryocyte-primed HSC)42. Third, the MEP cells               (Approval code 2020-208), and written informed consent
might preferentially differentiate into other downstream        was obtained from each enrolled subject. Patients’ blood
subsets, e.g. the EP, thus resulting in a significant increase   test results are provided in Table 1. Red-blood-cell lysis
of EP and a decrease of MEP. These can be questions that        buffer was used to treat BMMCs and PBMCs freshly
require further investigation in the future.                    isolated from the BM aspirates and blood samples by
   With the potential to lead to high level of cytokines and    Ficoll density gradient separation.
stimulate the HSC/MPP cells to cell death, the increased
expression of the receptors of coronavirus and influenza         ScRNA-seq library construction and sequencing
observed in this study suggested that correlation may             Barcoded scRNA-seq libraries were prepared using the
exist between the enhanced differentiation of HSC/MPPs          Chromium Single Cell V(D)J Reagent kit (10x Genomics,
into MkP and GMP in COVID-19 patients and acute                 PN-1000006) according to the manufacturer’s instructions.
infection by SARS-CoV-2, or other co-infected patho-            A suspension of ~2 × 10⁴ purified BMMCs or PBMCs was
gens. Indeed, evidence shows that HSPCs can be acti-            used to form Gel Beads-in-emulsion for each sample.
vated by viral infection, IFNs, and cytokines. Previously,      Subsequent sequencing was performed on the Illumina
stem-like Mk-committed progenitors (SL-MkPs) were               NovaSeq6000 platform. The raw sequencing reads of
identified within the HSC compartment43. In response to          scRNA-seq and scTCR/scBCR-seq of BMMCs and PBMCs
stress, acute inflammatory signaling triggered cell cycle        generated for this study have been stored in the National
activation of quiescent SL-MkPs, thereby driving a rapid        Genomics Data Center (https://bigd.big.ac.cn/), accession
maturation program of SL-MkPs and other MkPs, pro-              number: HRA000233 (BMMCs), HRA000555 (BMMCs
moting platelet recovery after inflammation-induced              BCR & TCR), HRA000517 (PBMCs), and HRA000550
thrombocytopenia.                                               (PBMCs BCR & TCR). In addition, three BMMCs scRNA-
   It should be noted that there are some limitations of this   seq datasets (GSM3396162, GSM3396167, and
study. Firstly, only three mild and three severe BMMC           GSM3396169) from age-matched healthy people29 were
samples were enrolled in this study, which limited the          utilized as controls.
number of hematopoietic stem cells and progenitor cells in
silico, ex vivo, and in vitro analyses. Secondly, the whole     Single-cell TCR and BCR analysis
blood should be used when investigating the differentia-          The amino acid and nucleotide sequence of TCR chains
tion from immature/dysfunctional-like GMPs to imma-             were assembled and annotated by CellRanger vdj program
ture/dysfunctional neutrophils. The PBMC samples used           (version 3.1.0). Only cells with paired TRA and TRB were
Wang et al. Cell Discovery (2021)7:60                                                                       Page 15 of 18

used for clonality analysis. An exact match of nucleotide    RNA velocity
sequences of the CDR3 of both TRA and TRB were used            The alignment of reads with annotation of exons and
to define the same TCR clonotype. Statistical analysis of     introns, which was generated by the Cell Ranger pipeline,
Shannon index used to measure the cross-compartment          was processed using velocyto (version 0.17) “run10x”
clonal diversity were performed using t-tests, and TCR       command and velocyto loom files were obtained. The
migration between PBMC and BMMC was delineated               Seurat Wrappers package Velocity (version 0.6) was then
using R package STARTRAC (version 0.1.0).                    used to estimate RNA velocity following gene filtering
  The nucleotide sequence of BCR chains was assembled by     process (2000 genes with the highest variance and a
CellRanger vdj program (version 3.1.0), and annotated by     minimum feature counts of three detected in three cells).
SCIGA (https://github.com/sciensic/SCIGA). Matched V, J      Spliced and unspliced counts were normalized separately
gene and CDR3 nucleotide sequences were used to define        based on total counts per cell, PCA, clustering, and
the same BCR clonotype. Statistical comparisons of Shan-     UMAP plotting using the default setting. Gamma fitting,
non index used to measure the cross-compartment clonal       RNA velocity calculations, and Markov process simula-
diversity were performed using t-test.                       tion were also conducted.

Dimension reduction and clustering analysis                  Calculating gene expression signature scores
  The read count for each gene in each cell was quantified      The cell gene expression signature score was calculated
by the Cell Ranger pipeline (version 3.1, GRCh38 genome      using the “AddModuleScore” function in Seurat. The
assembly) with default settings, then filtered gene-barcode   stemness score of the HSPC cell was calculated with a
matrices were analyzed with R Seurat package (version        geneset that was comprised of overlapped differential
3.1.5)44. Genes detected in 10% of the total, and       HSC/MPP: ADAM28, AIF1, ANGPT1, ANKRD28, AREG,
with fewer than 200 or >4500 detected genes were             AVP, BEX2, BEX4, BST2, CD164, CD44, CRHBP, CRYGD,
removed. The raw unique molecule identifiers (UMIs) of        CSF3R, CYTL1, ELMO1, FOS, FXYD5, H1F0, HEMGN,
genes were normalized using the “NormalizeData” func-        HOPX, IDS, LAPTM4A, LIMS1, LST1, MDK, MLLT3,
tion with default parameters. Next, the “IntegrateData”      MSRB3, MYCT1, NPR3, RBPMS, SELL, SERPINB1,
function was applied to correct batch effect in COVID-19     SMIM24, SPINK2, TAOK3, TFPI, and ZFP36. The activity
patients and HC. The “RunPCA” function was performed         signature scores of the T cells from BMMC and PBMC
based on the top 2000 features generated by the “Find-       were calculated using the following genes: CD69, CCL19,
VariableFeatures” function and then UMAP of single cells     CCL2, CCL21, CCL5, CCR2, CCR7, CD24, CD27, CD276,
was performed by the “RunUMAP” function. Finally, we         CD28, CD40LG, CD46, CD47, CD5, CD55, CD6, CD70,
adopted “FindNeighbors” and “FindClusters” to identify       CD74, CD80, CD81, CD83, CD86, CDC42, GATA3,
cell clusters at resolution of 0.8 and visualized them by    HMGB1, ICOS, IFNG, IL12A, IL15, IL18, IL1A, IL1B,
UMAP with default settings. HSPCs and myeloid cells          IL1RL2, IL2, IL21, IL23A, IL23R, IL27RA, IL2RA, IL36B,
were re-clustered following the similar steps described      IL4, IL4R, IL7, IL7R, LGALS9, TNFRSF14, TNFSF11, and
above, including the removal of contaminated cells,          TNFSF13B. The exhaustion scores of the T cells from
dimension reduction, and clustering analysis.                BMMC and PBMC were calculated using the following
                                                             genes: PDCD1, LAG3, TIGIT, HAVCR2, TOX, CD160,
Identification of marker genes and annotation of cell         CTLA4, and EOMES. LYZ, CST3, RETN, FCER1G, TYR-
clusters                                                     OBP, S100A8, ANXA2, FTL, GRN, S100A9, RAB31,
  Marker genes for each cluster were identified with the      PRTN3, STXBP2, MNDA, CTSZ, CTSG, MPO, AZU1,
MAST algorithm in the FindAllMarkers function45 of           PLAC8, CFD, TUBB4B, S100A11, PRDX4, and ASAH1
Seurat. The filtering criteria for marker genes was |lnFC|    were used to calculate the “defend response to pathogen
> 0.25, p.adjust < 0.05, and pct.1>0.25. The cell clusters   score (DRP)” of GMP cells, and LYZ, FCER1G, S100A8,
were annotated by referring to previously reported cell-     RNASE6, GRN, S100A9, IRF8, CTSG, MPO, AZU1,
type-specific marker genes46, and by retrieving cell type     PLAC8, ISG15, and HMGB2 were used to calculate the
information from a curated immunophenotype-based             “neutrophil activation (NA)” score.
reference dataset using the “TransferData” function in
Seurat.                                                      Reads mapping and tracking the SARS-CoV-2 genome
                                                               We adopted two methods to identify the infection of
Cell cycle score and status                                  BMMCs by SARS-CoV-2. One was to align BMMCs
  Cell cycle scores and the status of HSC/MPP cells were     scRNA-seq dataset to the SARS-CoV-2 genome
calculated by the “cyclone” function in the scran (version   (NC_045512.2) using the Cell Ranger pipeline, with a
1.12.1) package47.                                           previously reported bronchoalveolar lavage fluid (BALF)
Wang et al. Cell Discovery (2021)7:60 Page 16 of 18
cell scRNA-seq dataset (GSE145926)6 that was tested as regulons. In total, 149 regulons were identified with a
positive for SARS-CoV-2 being included as the positive threshold of at least 10 co-expressed genes per regulon.
control. The other was to use Viral-Track31 to detect viral The Student’s t test (R 3.6.2, two-sided, unadjusted for
reads from the scRNA-seq dataset using the default multiple comparisons) was used to analyze differences of
parameter setting. AUCell score in a pairwise fashion among the three groups
(HC, mild, and severe). Differentially activated regulons
Flow cytometry staining of the HSPCs with a P value < 0.05 in any of the pairwise comparisons
Purified BMMCs of the six COVID-19 patients were were selected for further clustering. Finally, all regulons
used to stain the HSPCs and flow cytometry was performed were clustered based on the AUCell score of the enriched
on FACSymphonyTM S6 (BD Biosciences). The following TFs in each single cell using Pheatmap R package.
antibodies for the HSPCs were used: lineage cocktail (CD3,
CD14, CD16, CD19, CD20, CD56/Pacific Blue) (Biolegend, Detection of SARS-CoV-2-specific immunoglobulin using
clone UCHT1; HCD14, 3G8, HIB19, 2H7, HCD56, Cat. no. Chemiluminescence Microparticle Immuno Assay
348805, RRID: AB_2889063), CD34/APC (BD Biosciences, The SARS-CoV-2-specific immunoglobulin in plasma
clone 581, Cat. no. 555824, RRID: AB_398614), CD38/PE- was tested with Chemiluminescence Microparticle
Cy7 (Biolegend, clone HIT2, Cat. no. 303516, RRID: Immuno Assay kit (Beijing Wantai Biological Pharmacy
AB_2072782), CD90/PerCP-Cy5.5 (BD Biosciences, clone Enterprise Co., Ltd., China). The antibody concentration
5E10, Cat. no. 561557, RRID: AB_10712762), CD45RA/ was represented by fluorescence intensity, which was
APC-Cy7 (Biolegend, clone HI100, Cat. no. 304128, RRID: presented as the relative fluorescence of the sample to
AB_10708880), CD49f/BV605 (BD Biosciences, clone control (COI), with COI > 1 indicating positive testing
GoH3, Cat. no. 740416, RRID: AB_2740146), CD10/BV786 results for SARS-CoV-2-specific antibody.
(BD Biosciences, clone HI10a, Cat. no. 564960, RRID:
AB_2739025), LIVE/DEAD dye/BV510 (Invitrogen, Cat. Statistics
no. L34957), and Annexin V/FITC (BD Biosciences, Cat. The two-tailed unpaired Student’s t test (Prism version
no. 556547, RRID: AB_2869082). Gatings included HSC 8.0.1, GraphPad Software, San Diego, CA) was used to
(Lin−CD34+CD38−CD45RA−CD90+CD49f+CD10−), explore differences lying in the abundance of cell types for
MPP (Lin−CD34+CD38−CD45RA−CD90−CD10−). all cell clusters in different groups. P value < 0.05 was
considered statistically significant.
Functional annotation analysis
The “FindMarkers” was applied to detect the DEGs Study approval
between any two given groups. GO and Kyoto Encyclopedia All procedures were performed in accordance with the
of Genes and Genomes (KEGG) pathway analysis of DEGs ethical standards of the responsible committee on human
were performed with clusterProfiler R package48, and only experimentation (institutional and national) and with the
terms in the “GO Biological Processes” were considered in Helsinki Declaration of 1975, as revised in 2000. Informed
the GO enrichment analysis. In addition, GSEA was also consent was obtained from all patients prior to inclusion
included and performed with C2 (curated), C3 (regulatory in the study.
target), and C5 (Gene Ontology) in MSigDB.
Acknowledgements
The authors thank Ph.D student Xiaoju Liu from Southern Medical University
Stem-score based stratification analysis for her help with the flow cytometry analysis, Dr. Ziyi Li from Shanghai Institute
HSC/MPP cells were stratified by descending stemness of Immunology for his contributions and improvement of this manuscript, and
signature scores32 (V, 95%–100% percentiles, IV, 90%–95% the Biobank of Shenzhen Third People’s Hospital for samples and services
provided. This work was supported by grants from the National Science Fund
percentiles, III, 85%–90% percentiles, II, 80%–85% per- for Distinguished Young Scholars (82025022), the Shenzhen Science and
centiles, and I, 75%–80% percentiles). Correlated expres- Technology Innovation Committee (2020A1111350032, JSGG2020022515141
sion (by Spearman correlation) of different lineage-specific 0198, JCYJ20200109144201725), the Central Charity Fund of Chinese Academy
of Medical Science (2020-PT310-009), the Shenzhen Bay Funding
gene modules was assessed in each stratified HSC/MPP (2020B1111340075) and Bill & Melinda Gates Foundation, Guangdong
population. Provincial Department of Science and Technology (2020B1111340033,
2020B1111340039, 2020B1111340040), Ministry of Science and Technology of
China (2016YFA0100600), the National Natural Science Foundation of China
Regulatory network inference (81421002, 8210081333), China Postdoctoral Science Foundation
The single-cell regulatory network inference and clus- (2021M693357), and the CAMS Initiative for Innovative Medicine (2016-I2M-1-
tering (SCENIC)37 was used to explore the regulatory 017).
landscape based on normalized expression levels of
scRNA-seq data. Only genes expressed in at least 1% of Author details
1
Institute for Hepatology, National Clinical Research Center for Infectious
HSC cells were retained to construct the regulatory net- Disease, Shenzhen Third People’s Hospital; The Second Affiliated Hospital,
work. The TF and directly regulated genes were identified School of Medicine, Southern University of Science and Technology, Shenzhen,You can also read