E-COMMERCE IN ASEAN A guide for Australian business - Austrade
←
→
Page content transcription
If your browser does not render page correctly, please read the page content below

E-COMMERCE IN ASEAN A guide for Australian business

CONTENTS

Introduction                                                            3    E-commerce regulations                                                 10

Online marketplaces                                                     5    Free trade zones                                                       10

Business-to-consumer                                                    5    Market profiles                                                        11

Direct sales                                                            5    Indonesia                                                              11

Consumer-to-consumer                                                    6    Malaysia                                                               14

Selling from a branded website                                          6    Myanmar                                                                17

Key platforms across ASEAN                                              6    Philippines                                                            20

Social media marketing                                                  7    Singapore                                                              23

Payment options                                                         9    Thailand                                                               26

Currency exchange services                                              9    Vietnam                                                                29

Logistics and regulatory environment                                    10   How Austrade can help                                                  32

Logistics                                                               10   Austrade across ASEAN                                                  32

Disclaimer                                                                   Copyright © Commonwealth of Australia 2019

This report has been prepared by the Commonwealth of Australia
represented by the Australian Trade and Investment Commission
(Austrade). The report is a general overview and is not intended to
                                                                             The material in this document is licensed under a Creative Commons
provide exhaustive coverage of the topic. The information is made
                                                                             Attribution – 4.0 International licence, with the exception of:
available on the understanding that the Commonwealth of Australia is
                                                                             • the Australian Trade and Investment Commission’s logo
not providing professional advice.
                                                                             • any third party material
While care has been taken to ensure the information in this report           • any material protected by a trade mark
is accurate, the Commonwealth does not accept any liability for any          • any images and photographs.
loss arising from reliance on the information, or from any error or
                                                                             More information on this CC BY licence is set out at the creative
omission, in the report.
                                                                             commons website: https://creativecommons.org/licenses/by/4.0/
Any person relying on this information does so at their own risk.            legalcode. Enquiries about this licence and any use of this document
The Commonwealth recommends the person exercise their own skill              can be sent to marketing-comms-helpline@austrade.gov.au.
and care, including obtaining professional advice, in relation to their
use of the information for their purposes.                                   Attribution

The Commonwealth does not endorse any company or activity                    Before reusing any part of this document, including reproduction,
referred to in the report, and does not accept responsibility for any        public display, public performance, distribution, dissemination,
losses suffered in connection with any company or its activities.            communication, or importation, you must comply with the Attribution
                                                                             requirements under the CC BY licence.

                                                                             Using the Commonwealth Coat of Arms

                                                                             The terms of use for the Coat of Arms are available from the It’s an
                                                                             Honour website (itsanhonour.gov.au).

                                                                             18-19-202. Published August 2019.

                                                                                                                            E-commerce in ASEAN          01
02
INTRODUCTION

Over the past three years, the ASEAN region has experienced rapid growth in
e-commerce activity. In 2015, e-commerce was worth only US$5.5 billion. By 2017,
e-commerce was generating close to US$11 billion in gross merchandise value (GMV)
and in 2018, more than doubled the previous year’s GMV to exceed US$23 billion.1
The quadrupling of e-commerce in ASEAN represents a 62 per cent compound annual
growth rate over the three years.2

The growth of e-commerce means it will play a valuable              Exporters should be aware of some challenges
role in the region’s digital economy. In a joint study by           facing the e-commerce market in ASEAN, including
Google and Temasek, Southeast Asia’s internet economy               complex online payment options, immature logistics
is slated to be worth more than US$240 billion by 2025,             infrastructure and unclear regulatory requirements.
US$40 billion more than what was first projected in
                                                                    This report provides an overview of the e-commerce
2018.3 By 2025, e-commerce is predicted to be worth
                                                                    market in seven ASEAN countries. The report aims
US$102 billion – making up more than 40 per cent of the
                                                                    to help Australian exporters compare each market
total value of the region’s internet economy.4
                                                                    and identify which to target. Refer to Austrade’s
E-commerce is an effective channel for Australian                   e-commerce guides to Indonesia, Thailand and
exporters to enter the ASEAN market or grow their                   Vietnam for in-depth information on each market.
existing footprint. Some key drivers of e-commerce
growth across the region include a growing middle
class, the presence of major online marketplaces, and
social media-savvy populations.

Figure 1: Online retail sales and percentage growth

  Market                                            Online retail sales, 2018                2013–2018 growth

  Australia                                            US$21,682.5 million                          68.4%

  Indonesia                                             US$4,304.9 million                         196.7%

  Malaysia                                              US$2,036.9 million                         308.4%

  Myanmar                                                 US$11.6 million                          147.6%

  Philippines                                           US$1,040.8 million                         162.7%

  Singapore                                             US$2,008.8 million                         138.9%

  Thailand                                              US$2,323.3 million                          97.6%

  Vietnam                                               US$2,186.2 million                         379.0%

Source: Euromonitor Passport database, accessed 24 June 2019

                                                                                                        E-commerce in ASEAN   03
Figure 2: Growth rate prediction for retail e-commerce sales (%)

       Market                       2019        2020               2021   2022   2023

       Australia                    3.8          3.3                2.1   3.0    2.5

       Indonesia                    20.6         18.5              15.9   14.8   13.7

       Malaysia                     22.4         20.0              19.6   18.3   16.7

       Philippines                  31.0         29.8              26.7   25.9   24.1

       Singapore                    9.5          8.8                8.0   7.0    6.0

       Thailand                     18.1         17.6              16.3   15.7   14.3

       Vietnam                      16.8         13.2              11.7   9.6    8.8

     Source: eMarketer, June 2019

04   E-commerce in ASEAN
ONLINE
MARKETPLACES

In recent years, several large international e-commerce platforms have made significant
investments in local online marketplaces. These investments have accelerated the
growth of e-commerce across ASEAN, as well as funded aggressive marketing
campaigns to entice new consumers to their platforms.

Examples of major investments include Amazon’s launch         Australian businesses looking at B2C models can open
in Singapore, Alibaba’s stake in Lazada, and JD.com’s         their own branded flagship store or seek a listing on a
launch of JD.id in Indonesia and joint venture with           multi-brand store, both of which may require partnering
Central Group in Thailand.                                    with a local distributor depending on the market
                                                              and product.
Most of ASEAN’s online marketplaces follow three
business models: business-to-consumer; direct sales;
and consumer-to-consumer. Online marketplaces will
often use one or more business models.                        Direct sales

                                                              Direct sales sites acquire or hold inventory from or on
                                                              behalf of businesses. This may be on a consignment
Business-to-consumer
                                                              basis where the seller is only paid once goods are sold
                                                              to consumers.
Business-to-consumer (B2C) marketplaces are the
online equivalent of a traditional bricks-and-mortar retail   Direct sales sites operate all aspects of the e-commerce
store or shopping centre. Individual brands or multi-         sales process: product listing, merchandising, customer
brand sellers set up stores within the marketplace to sell    service and delivery. Direct sales sites or their appointed
directly to consumers.                                        trading company will often act as the importer for the
                                                              business. Some online marketplaces have a direct
The exact business model for each marketplaces varies.
                                                              purchase department.
Typically, marketplaces require sellers to arrange their
own warehousing and delivery. As competition has              Since the direct sales site assumes a significant level
increased, however, some platforms have introduced            of risk in holding stock, this model is less common than
in-house warehousing and fulfilment services for high-        online marketplaces and product selection criteria is
performing businesses.                                        often much stricter.

Online marketplaces usually charge fees for activities
such as initial store setup and ongoing product listing,
and receive commissions based on sale volumes. A
service provider will often be required to manage product
listings and customer service, and will charge their own
fees in addition to the monthly fees paid to the platform.

                                                                                                     E-commerce in ASEAN    05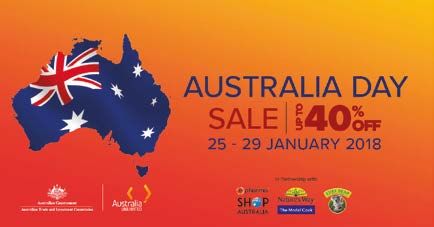
Consumer-to-consumer                                             Selling from your own website

     Consumer-to-consumer (C2C) marketplaces such as                  Consumers' preference for shopping online through large
     eBay do not hold or purchase inventory. They usually             marketplaces, as opposed to brands' own websites, is
     require the seller to distribute goods when they receive a       growing throughout ASEAN as with many other markets
     customer order.                                                  around the world. The range of products, ability to order
                                                                      multiple brands in one transaction, and familiar shipping
     Most C2C marketplaces host thousands of businesses,
                                                                      and returns policies are driving this behaviour.
     from sole traders to small businesses and officially
     branded stores. They usually don’t require any                   Australian businesses with strong experience selling
     documentation that proves a business has the right               through their own website to consumers may also
     to represent the brand or use the intellectual property,         consider using this channel to sell into ASEAN markets.
     lowering the cost of setting up an online store.
                                                                      However, this will require significant research and
     However, the downside is that you may find third parties         commitment to manage local regulatory requirements,
     (individuals and businesses) selling your product(s)             and facilitate payments, delivery and local language
     without giving you any notice.                                   customer service. Using this channel may also
                                                                      require partnering with a local distributor to manage
                                                                      importation processes.

       Key platforms across ASEAN

       Lazada Group                              Shopee                                   Zalora

       Launched in 2012, Lazada                  Headquartered in Singapore               Based in Singapore, Zalora offers
       carries general merchandise,              under the Sea Group, Shopee              fashion products from local and
       including electronics, fashion and        offers a diverse range of                international brands. It has a
       homewares. Lazada is majority-            products, from electronics to            470,000-square-foot regional
       owned by China’s Alibaba Group            fashion and health and wellness.         e-fulfilment hub in Kuala Lumpur,
       Holding Limited.                                                                   Malaysia.

                    Business model:                             Business model:                        Business model:
                    B2C, direct sales,                          B2C, C2C                               B2C, direct sales,
                    C2C                                                                                C2C

                    Product categories:                         Product categories:                    Product categories:
                    Food & beverage,                            Food & beverage,                       Fashion
                    fashion, skincare                           fashion, skincare

                    Markets:                                    Markets:                               Markets:
                    Indonesia, Malaysia,                        Indonesia, Malaysia,                   Indonesia, Malaysia,
                    the Philippines,                            the Philippines,                       the Philippines,
                    Singapore, Thailand                         Singapore, Thailand                    Singapore and
                    and Vietnam                                 and Vietnam                            Thailand

06   E-commerce in ASEAN
SOCIAL MEDIA
MARKETING
With more than 370 million internet users and double-
digit growth in most countries and segments of the TIP: Facebook Blueprint offers free online
population, ASEAN’s digital sector is booming.
training in digital marketing tools for
Social media is an effective way to draw traffic and Facebook, Instagram and WhatsApp. Facebook
increase brand exposure as most ASEAN consumers Cross Border Insights Finder allows exporters
use social media platforms to read news, search for to compare country insights from Facebook's
information and stay connected with family and friends.
campaign data to explore new growth
Social media marketing leverages data collected opportunities around the world. Google My
from social channels to interact with users that match Business teaches you how to update your
a brand’s consumer profile. Many brands choose to business profile, build a website and engage
advertise on social media apps to take advantage of the
with your customers.
high usage of these channels on mobile devices.
Facebook, Instagram and Google are the leading digital
ad sellers in ASEAN.
Figure 3: Facebook user growth by country, 2018 (% change)
16
14.2
14
12
10
8.7
% change
7.9
8
6.6
6
4.2 4.2
4
2
0
Indonesia Philippines Vietnam Thailand Singapore Malaysia
Country
Source: eMarketer, July 2018
E-commerce in ASEAN 07Figure 4: Instagram user penetration by country, 2018
70
62.8
60
53.2
50
45.2
Percentage of users
40
36.2
30
20
15.6
12.6
10
0
Indonesia Singapore Malaysia Thailand Philippines Vietnam
Country
Source: eMarketer, July 2018
Figure 5: Ad spending in ASEAN and Australia, 2019 (forecast)
Total media ad spend
Market Total Digital, inc. mobile Mobile
(US$ billion) (US$ billion, % of total) (US$ billion, % of total)
Australia 12.32 7.01 (56.9%) 4.88 (39.6%)
Indonesia 3.33 0.68 (20.4%) 0.39 (11.8%)
Malaysia 1.21 0.3 (25.1%) 0.21 (17.5%)
Philippines 1.78 0.41 (22.9%) 0.23 (13.1%)
Singapore 1.6 0.47 (29.7%) 0.36 (22.7%)
Thailand 2.4 0.59 (24.8%) 0.40 (16.8%)
Vietnam 1.26 0.28 (22.5%) 0.19 (15.1%)
Source: eMarketer, July 2019
08 E-commerce in ASEANPAYMENT
OPTIONS
There are many ways for ASEAN consumers to pay for
Currency exchange services
goods ordered online. In some markets, consumers are
comfortable using credit cards or PayPal. In others, credit There are fintech companies that can help reduce
cards and even bank accounts are not common, with the time and cost involved in converting currencies.
consumers preferring to pay cash to the delivery person Services and costs vary between companies.
when they receive the goods (cash on delivery). This
requires businesses to have a trusted freight company to Fintech companies that offer currency conversion
collect money on their behalf. Businesses may also need services include:
an offshore bank account to receive payments.
›› Airwallex – offers services that provide real-time
access to competitive foreign exchange rates, and
allow you to accept international payments as if
Figure 6: Card payment penetration rate
they were local payments.
Market Card payment
›› OFX – offers a multi-currency account for
online sellers.
penetration rate
Indonesia 8.0% ›› Payoneer – offers a cross-border payments
platform that allows online sellers to pay and get
Malaysia 28.4% paid globally as easily as they do locally.
Myanmar 2.0%
Philippines 20%
Singapore 63.3%
Thailand 26.3%
Vietnam 17.7%
Source: Euromonitor Passport database, accessed 24 June 2019
E-commerce in ASEAN 09LOGISTICS AND REGULATORY
ENVIRONMENT
Two key challenges for companies undertaking cross-border e-commerce are
understanding the shipping options available to ensure adherence to regulatory
requirements, and controlling shipping costs.
Australian businesses can also send goods in bulk
Logistics for warehousing in a market until they are sold. This is
known as local fulfilment or third-party logistics (3PL).
The regulatory requirements for a particular product in Once the goods are sold, the parcel is picked and
each market may impact the logistics options available packed and sent to consumers. This model significantly
to provide reliable delivery to consumers. reduces shipping fees and time. However, businesses
will need to engage an importer or distributor that can
One logistics option is direct-to-consumer shipments
hold stock in the market. The importer or distributor will
through postal or courier services, commonly known in
often organise local registration, label requirements and
e-commerce as 'cross-border shipping'. As items are
import duty.
shipped for each customer order, there is no stock held
overseas, which lowers the risk for exporters. However,
the unit price per item will be relatively high. Note that E-commerce regulations
the maturity of postal and courier systems across ASEAN
markets varies, as does policy and the enforcement of
Each ASEAN country has their own e-commerce
regulatory requirements for these shipments.
regulations. Unlike China, there are currently limited
Depending on the product category, local regulatory policies in ASEAN markets for goods sold through cross-
requirements may still apply. Exporters may also face border e-commerce channels, such as dispensation
penalties if they do not meet import requirements. Use from regulatory or product approval processes.
the checklist below as a guide.
Austrade advises online exporters to check regulatory
requirements based on the product's HS code before
Checklist shipping goods into ASEAN markets. In some cases,
›› Can your product be shipped internationally? the exporter or brand owner may face penalties for not
(Refer to the product’s HS code.) adhering to regulations, which may impact their ability to
sell into the market in the future.
›› Do you need local registration for the products?
›› Do you need to translate the product label into
the local language? Free trade zones
›› Do you need an importer to import the goods?
›› Do you need to include local value-added tax Most of the free trade zones in ASEAN markets are still
and import duty in your price? under development and it is unclear how they can help
Australian exporters.
10 E-commerce in ASEANMARKET PROFILE
INDONESIA
Market features E-commerce activity
Internet users: 87.9 million Retail e-commerce sales: US$4.3 billion*
Internet user penetration: 36.2% 2013–2018 total growth: 196.7%
Smartphone ownership: 56.5% % of total retail sales: 2.82%
Use of a mobile phone to access the internet: 14.1% E-commerce spend per capita: US$41
*Retail e-commerce sales exclude online services such as travel, software and deliveries.
Source: Euromonitor Passport database; Hootsuite/We Are Social
Market overview ›› The investment climate for foreign digital platforms
is challenging, with significant upfront setup costs
Indonesia is the biggest e-commerce market in ASEAN required; however, some international players have
with total sales of US$8 billion in 2016.5 The country’s assessed that the Indonesian market is worth the
e-commerce growth is supported by several factors: cost to grow their business.
›› continuously rising smartphone and Indonesia has launched an initiative called Palapa Ring
internet penetration. to build its internet infrastructure. The massive fibre-
optic infrastructure project will cover the seven main
›› a large population with growing purchasing power islands in Indonesia.
due to robust macroeconomic growth.
›› a young, tech-savvy population that is quick to
embrace new technologies. Top platforms
›› Indonesia’s non-cash payment infrastructure,
although behind other developed markets, has Lazada is the leading e-commerce platform in Indonesia
shown significant growth in the past 18 months with with 117 million visits per month (2018). Owned by
the development of a number of payment options, Alibaba Group.
including Ovo, GoPay, Jenius and DANA.
Tokopedia is ranked second, with close to 117 million
There are, however, several challenges for further growth visits per month (2018). Tokopedia is a local e-commerce
of the e-commerce industry: company and one of Indonesia’s unicorns.
›› Infrastructure bottlenecks are affecting product Bukalapak is ranked third with 93 million
delivery and logistics costs are high. visits per month (2018). Bukalapak is a local
e-commerce company.
›› There is a strong need to improve the nation’s talent
pool for all e-commerce services.
E-commerce in ASEAN 11Social media
Figure 7: Usage of social media platforms
100
90 88
83 81 80
80
70
Percentage of users
60 59
52
50
40
30
20
10
0
YouTube WhatsApp Facebook Instagram Line Twitter
Social media platforms
Source: Hootsuite/We Are Social, Digital 2019
Figure 8: Social media user profile Product categories
Age Male Female Figure 9: Top five product categories
13–17 7% 8% ■ Consumer electronics
31%
18–24 18% 15%
■ Media products
25–34 19% 14% 29%
■ Other
35–44 7% 5% 23.3%
45–54 2.5% 1.9% ■ Apparel & Footwear
11.8%
55–64 0.7% 0.5%
■ Food & drink
65+ 1.3% 0.7% 3.2%
Source: Euromonitor, July 2019
Source: Euromonitor, based on the combined advertising audience
of Facebook, Instagram and Facebook Messenger
Figure 10: Domestic vs. foreign e-commerce sales
■ Domestic
e-commerce sales
95%
■ Foreign e-commerce
sales
5%
Note: Foreign
online sales refer
to e-commerce
purchases made on
foreign websites or
websites created
specifically for cross-
border transactions
e.g. Amazon global
Source: Euromonitor, July 2019 sites, eBay.
12 E-commerce in ASEANOnline payment methods
Card payment (excl. commercial) 8.0%
Electronic direct/ACH transactions 25.9%
Cash 66.1%
Other paper-based payments 0.0%
ACH: Automated clearing house
Source: Euromonitor, July 2019
Business model
Category Local Registration Importer Cross-border Local label
registration time required* required shipping required
required (less than
US$75)
Fashion No No Yes Yes Yes
Skincare Yes 6–12 months Yes Yes Yes
Food and Yes 6–12 months Yes Yes Yes
beverage
See www.beacukai.go.id for more details.
*This is an indication of time frame for certain product categories to be registered in Indonesia based on Austrade's experience working
with local distributors.
Read Austrade’s E-commerce in Indonesia guide for more detailed information.
INSIGHT: INDONESIA
The Indonesian e-commerce sector is growing year on year. An online presence is vital to ensure you do not miss
out on this opportunity to engage with our nearest international neighbour (with a market of 260 million people).
There are platforms that are already selling Australian products to Indonesian consumers. These products are
offered via the brands themselves, Australian aggregators or the Indonesian importers that represent these
products in-market.
The cross-border business-to-consumer sales pipeline is growing in Indonesia and has been employed by
some Australian businesses to test the market. This allows them to see whether there is demand for their
product before undertaking the stringent registration process.
Once satisfied that Indonesia is a market you wish to pursue, businesses need to engage Austrade to
understand the opportunity and learn who you should work with, where you should list your product and the
regulatory implications of the e-commerce sector.
Austrade in Indonesia has strong links with all major e-commerce providers and can connect your business
directly to these platforms to learn how you can list in Indonesia and sell your products cross-border.
E-commerce in ASEAN 13MARKET PROFILE
MALAYSIA
Market features E-commerce activity
Internet users: 24.5 million Retail e-commerce sales: US$2.0 billion*
Internet user penetration: 82.3% 2013–2018 total growth: 308.4%
Smartphone ownership: 74.4% % of total retail sales: 3.74%
Use of a mobile phone to access the internet: 85.3% E-commerce spend per capita: US$110
*Retail e-commerce sales exclude online services such as travel, software and deliveries.
Source: Euromonitor Passport database, Hootsuite/We Are Social
Market overview Top platforms
Malaysia’s US$2 billion e-commerce market is the Lazada offers over 300 million items ranging from
third largest in the ASEAN region after Indonesia and consumer electronics to household goods, toys, fashion,
Thailand. Malaysia has robust internet and mobile sports equipment and groceries.
connectivity and mature infrastructure to support
Shopee offers a diverse range of products, from
online payments and logistics. Rising incomes, growing
electronics to fashion and health and wellness.
smartphone and internet penetration, are key factors
that will help grow Malaysia’s online market from 3.74 PrestoMall, previously known as 11street Malaysia, is
per cent of total retail spending in 2018 to 5 per cent by Malaysia’s largest home-grown online marketplace.
2020. Key challenges for Malaysia include lack of trust in It offers more than 1.3 million products from 10,000
platforms; limited product choice; and uncertainty about sellers across fashion, beauty electronics, toys and
product authenticity. frozen food.
14 E-commerce in ASEANSocial media
Figure 11: Usage of social media platforms
100
93 91 91 91
90
80
70
70
64
Percentage of users
60
50
40
30
20
10
0
YouTube WhatsApp Facebook Instagram Facebook Messenger WeChat
Social media platforms
Source: Hootsuite/We Are Social, Digital 2019
Figure 12: Social media user profile Product categories
Age Male Female Figure 13: Top five product categories
13–17 2.6% 2.3% ■ Apparel & Footwear
25.9%
18–24 14% 11%
■ Media products
7.6%
25–34 20% 15%
■ Homewares &
35–44 10% 8% home furnishing
6.3%
45–54 4.8% 4.4%
■ Consumer electronics
55–64 2.6% 2.3% 5.8%
■ Other
65+ 1.3% 0.8% 54.4%
Source: Euromonitor, based on the combined advertising audience Source: Euromonitor, July 2019
of Facebook, Instagram and Facebook Messenger
Figure 14: Domestic vs. foreign e-commerce sales
■ Domestic
e-commerce sales
Online payment methods 46%
■ Foreign e-commerce
sales
54%
Card payment (excl. commercial) 28.4%
Electronic direct/ACH transactions 12.9%
Cash 57.3%
Other paper-based payments 1.4%
ACH: Automated clearing house Note: Foreign online sales refer to e-commerce purchases made on
Source: Euromonitor, July 2019 foreign websites or websites created specifically for cross-border
transactions e.g. Amazon global sites, eBay.
Source: Euromonitor, July 2019
E-commerce in ASEAN 15Business model
Category Local Registration Importer Cross-border Local label
registration time required* required shipping required
required (less than
RM500)
Fashion No No No Yes No
Skincare Yes 3–6 months Yes No Yes
Nutraceutical Yes 6–12 months Yes No Yes
Food and Yes 1–5 days Yes No Yes
beverage with
no certificate
requirement
Food and Yes 1–2 months Yes No Yes
beverage with
certificate
requirement
Alcohol Yes 3–6 months Yes No Yes
See www.customs.gov.my/en for more details.
*This is an indication of time frame for certain product categories to be registered in Malaysia based on Austrade's experience working with local
distributors.
CASE STUDY: AUSTRALIA DAY PROMOTION
In January 2018, Austrade Malaysia partnered with Lazada Malaysia
on an ‘Australia Day’ promotion. Austrade engaged with Malaysian
importers and Australian exporters to provide products for a special
landing page created by Lazada featuring all Australian goods.
To make sure the initiative reached as many people as possible, the landing page was prominently displayed
on Lazada’s homepage banner. The initiative was also promoted on Facebook and Instagram, Lazada’s mobile
application and through email marketing.
Austrade undertook post-event analysis to evaluate the different marketing strategies. We found email
marketing had the highest page entrance rate, followed by organic Google searches and social media.
We also identified that sellers who offered discount vouchers performed better than those who offered a
discounted price. These vouchers typically offered a RM30 discount for the next transaction if the consumer
spent more than RM50 in their first transaction. This tactic also resulted in a higher checkout price at around
RM60 compared with RM41 for transactions without a voucher.
There are some improvements that could be considered. First, sellers need to arrange logistics and fulfilment two
weeks before the campaign date to ensure products are available. Second, marketing content needs to be more
engaging and detailed to attract customers and increase conversion rates for all marketing outreach activities.
For more information about upcoming e-commerce events in Malaysia, contact Austrade Malaysia.
16 E-commerce in ASEANMARKET PROFILE
MYANMAR
Market features E-commerce activity
Internet users: 17.08 million Retail e-commerce sales: US$11.6 million*
Internet user penetration: 34.6% 2013–2018 total growth: 147.6%
Smartphone ownership: 27.8% % of retail sales: 0.08%
Use of a mobile phone to access the internet: 13.3% E-commerce spend per capita: N/A
*Retail e-commerce sales exclude online services such as travel, software and deliveries.
Source: Euromonitor Passport database, Hootsuite/We Are Social
Market overview personal hygiene items and baby care. Like other
e-commerce websites, Metro accepts cash-on-delivery or
card payment.
Myanmar’s e-commerce market was valued at US$6.0
million in 2018 and is expanding, thanks to rising mobile Myanmar Post also has plans to expand its services for
connectivity and improved infrastructure. According to online shopping and e-commerce in the near future,
the Myanmar Digital Economy Roadmap, released in focusing on goods delivery and payment services for
February 2019, Myanmar’s digital industry has received small and medium businesses.
US$6 billion in foreign direct investment to date. Digital
trade is one of Myanmar’s nine priority sectors and the Myanmar’s e-commerce sector faces a number of
Ministry of Commerce is drafting a Digital Trade and growth challenges, including improving consumers’
E-commerce policy. trust in platforms and payment systems. The country
also needs to establish strong laws and procedures
With 54.1 million people, Myanmar is a huge potential around consumer protection, information privacy and
market for e-commerce. However, the country’s intellectual property protection, as well as better logistics
e-commerce ecosystem is still in the early stages of infrastructure across the country.
development. Many SMEs have no online presence,
let alone an e-commerce website. The majority of
e-commerce transactions take place on social media Top platforms
such as Facebook.
Myanmar’s biggest retail supermarket, CityMart, recently Shop.com.mm is 100 per cent foreign-owned, started
entered the e-commerce arena, enabling customers to by Germany’s Rocket Internet. Acquired by Alibaba
shop online and receive deliveries at their doorsteps. in 2018.
In March 2019, German wholesale company Metro AG
Rgo47 was launched in 2013 during the SEA Games
launched in Myanmar. Metro aims to serve mainly B2B
Myanmar. Daiwa PI made a major investment in
customers, such as the hospitality and tourism sectors,
March 2019.
with the objective of ‘delivering food directly from farm to
fork’. Metro offers a similar range of products as CityMart, BaganMart.com facilitates B2B transactions to help
including food, household cleaning products, toiletries, boost small and medium enterprises in Myanmar.
E-commerce in ASEAN 17Social media
Figure 15: Usage of social media platforms
40
36.9
35
30
Percentage of users
25
20
15
12.8
10
5
1.2
0
Facebook Instagram Facebook Messenger
Social media platforms
Source: Hootsuite/We Are Social, Digital 2019
Figure 16: Social media user profile Product categories
Age Male Female Food and beverage is currently the leading product
category in Myanmar, accounting for 50 per cent of all
13–17 3.4% 2.4%
e-commerce purchases. Fashion and cosmetics are
18–24 27% 17% also popular categories, especially among the younger
generation.
25–34 24% 13%
Retail, healthcare and tourism are expected to grow in
35–44 4.7% 3.1%
the future.
45–54 1.9% 1.4%
55–64 1.0% 0.7%
65+ 0.7% 0.4%
Source: Euromonitor, based on the combined advertising audience
of Facebook, Instagram and Facebook Messenger
Online payment methods
Card payment (excl. commercial) 2.0%
Electronic direct/ACH transactions 0.1%
Cash 97.9%
Other paper-based payments 0.0%
ACH: Automated clearing house
Source: Euromonitor, July 2019
18 E-commerce in ASEANBusiness model
Category Local Registration Importer Cross-border Local label
registration time required required shipping required
required (all parcels
taxable)
Fashion No No No Yes No
Skincare Yes Check website Yes Yes Yes
for different
categories
Food and Yes Check website Yes No Yes
beverage for different
categories
See www.myanmarcustoms.gov.mm for more details.
CASE STUDY: MYMYANCAR.COM
AsiaCargroup, an Australian startup, launched an online platform for automobiles in Myanmar in early 2019.
The platform aims to facilitate the convenient trading of automobiles and improve trust and transparency in
online trading in Myanmar. Mymyanmar.com will allow people to sell their vehicles easily and quickly. The
platform competes with local platforms such as CardsDB.com, mmcars.com and Facebook car buy/sell groups.6
E-commerce in ASEAN 19MARKET PROFILE
PHILIPPINES
Market features E-commerce activity
Internet users: 76 million Retail e-commerce sales: US$1.0 billion*
Internet user penetration: 63.5% 2013–2018 total growth: 162.7%
Smartphone ownership: 52.7% % of total retail sales: 1.44%
Use of a mobile phone to access the internet: 36% E-commerce spend per capita: US$25
*Retail e-commerce sales exclude online services such as travel, software and deliveries.
Source: Euromonitor Passport database, Hootsuite/We Are Social
Market overview Top platforms
With 76 million internet users, 124 million mobile Lazada has a 68 per cent market share, at least triple
connections and 72 million mobile social media users, the size of its closest competitor, Shopee.
the Philippines is well placed to take up e-commerce.7
Shopee is a leading mobile-first marketplace platform
The Philippine e-commerce market is benefiting from the in Southeast Asia, offering a diverse range of products,
nation’s rising middle class and a tech-savvy population from electronics to fashion and health and wellness.
with a median age of 24 years. The Philippines’ 76 million
Zalora is a fashion e-tailer offering men’s, women’s and
active social media users spend an average of four hours
children’s fashion and accessories.
every day using social media.8
Around 47 million Filipinos use e-commerce to purchase
consumer goods. Around 57 per cent of people have
bought something through their phone, including
games, music, apps, services and physical items.9 The
Philippines Government has developed an E-commerce
Roadmap 2016–2020 to build an integrated, globally
competitive industry that will contribute 25 per cent to
the Philippines’ GDP by 2020.10
20 E-commerce in ASEANSocial media
Figure 17: Usage of social media platforms
100 97 96
90 89
80
70
64
Percentage of users
60
54
50
44
40
30
20
10
0
Facebook YouTube Facebook Messenger Instagram Twitter Skype
Social media platforms
Source: Hootsuite/We Are Social, Digital 2019
Figure 18: Social media user profile Product categories
Age Male Female Figure 19: Top five product categories
■ Apparel & Footwear
13–17 5% 6% 11.6%
18–24 16% 17% ■ Consumer electronics
13.9%
25–34 15% 15%
■ Homewares &
home furnishings
35–44 6% 7% 2.1%
45–54 2.8% 3.9% ■ Media Products
14.7%
55–64 1.3% 2.0%
■ Other
17.5%
65+ 1.0% 1.3%
Source: Euromonitor, July 2019
Source: Euromonitor, based on the combined advertising audience
of Facebook, Instagram and Facebook Messenger Figure 20: Domestic vs. foreign e-commerce sales
■ Domestic
e-commerce sales
85%
Online payment methods
■ Foreign e-commerce
sales
15%
Card payments (excl. commercial) 20%
Electronic direct/ACH transactions 9%
Cash 67%
Other paper-based payments 4%
ACH: Automated clearing house Note: Foreign online sales refer to e-commerce purchases made on
foreign websites or websites created specifically for cross-border
Source: Euromonitor, July 2019 transactions e.g. Amazon global sites, eBay.
Source: Euromonitor, July 2019
E-commerce in ASEAN 21Business model
Category Local Registration Importer Cross-border Local label
registration time required* required shipping required
required (less than
PHP10,000)
Fashion Yes 3–6 months Yes Yes No
Skincare Yes 3–6 months Yes No Yes
Food and Yes At least Yes No Yes
beverage 6 months
See http://customs.gov.ph/prohibited-restricted-importations/ for more details.
*This is an indication of time frame for certain product categories to be registered in Philippines based on Austrade's experience working with
local distributors.
INSIGHT: PHILIPPINES
Austrade Philippines’ research found that due to the absence of cross-border infrastructure, Australian brands
are not yet directly sold by Australian suppliers. Australian brands available online are mostly sold by local
distributors and importers.
For example, a few Australian wine brands are sold through local distributors and importers’ e-commerce
platforms, i.e. winery.ph and Wine Depot. Australian products need to be registered to be sold online.
Fourteen Austrade clients with food and beverage products participated in a pilot e-commerce campaign in
early 2019. The clients reported increases in sales of up to 30 per cent, proving the value of e-commerce as an
alternate channel even for established products.
For further information regarding the food and beverage campaign and any future e-commerce initiatives,
contact Austrade Philippines.
22 E-commerce in ASEANMARKET PROFILE
SINGAPORE
Market features E-commerce activity
Internet users: 4.69 million Retail e-commerce sales: US$2.0 billion*
Internet user penetration: 86.2% 2013–2018 total growth: 138.9%
Smartphone ownership: 69.5% % of total retail sales: 8.32%
Use of a mobile phone to access the internet: 76.0% E-commerce spend per capita: US$889*
*Retail e-commerce sales exclude online services such as travel, software and deliveries.
Source: Euromonitor Passport database, Hootsuite/We Are Social
Market overview Top platforms
Singapore’s e-commerce sector is projected to grow Qoo10 recorded the highest e-commerce traffic in
at a compound annual growth rate (CAGR) of 14.7 per Singapore in 2018. The Singapore-based platform offers
cent between 2018 and 2022.11 The largest e-commerce fashion, beauty, electronics, home and living, children’s
categories are travel, fashion and beauty, entertainment products, and entertainment.
and lifestyle, IT and electronics, and general insurance.
Lazada offers over 300 million items ranging from
Key drivers of growth in the market are high internet consumer electronics to household goods, toys, fashion,
penetration and smartphone adoption, a strong financial sports equipment and groceries. Sellers can use the
infrastructure, and good logistics facilities. Singapore ‘Fulfilment by Lazada’ service to stock their inventory at
has a high online penetration rate (84 per cent in 2018) Lazada’s warehouse. Lazada also owns RedMart, an
and a population which spends a large amount of time online supermarket that carries over 100,000 products
online (5.3 hours a day on desktop, and 2.4 hours a day from more than 1,000 vendors. RedMart received
on mobile devices).12 around 1.4 million monthly visitors during 1Q18.
Singapore’s export and import infrastructure is strong, Shopee offers a diverse range of products, from
and it has low market entry barriers compared to electronics to fashion and health and wellness.
other countries.
E-commerce in ASEAN 23Social media
Figure 21: Usage of social media platforms
100
90 87 86
82
80
70
Percentage of users
60 59
52
50
40
34
30
20
10
0
YouTube WhatsApp Facebook Instagram Facebook Messenger Twitter
Social media platforms
Source: Hootsuite/We Are Social, Digital 2019
Figure 22: Social media user profile Product categories
Figure 23: Top five product categories
Age Male Female
■ Apparel & Footwear
13–17 1% 1% 13.0%
18–24 8% 8% ■ Media products
12.4%
25–34 18% 17%
■ Personal care
& eyecare
35–44 11% 11% 7.9%
45–54 7% 6% ■ Consumer electronics
7.3%
55–64 4% 4%
■ Other
65+ 2% 2% 58.4%
Source: Euromonitor, July 2019
Source: Euromonitor, based on the combined advertising audience
of Facebook, Instagram and Facebook Messenger Figure 24: Domestic vs. foreign e-commerce sales
■ Domestic
e-commerce sales
77%
Online payment methods
■ Foreign e-commerce
sales
Card payment (excl. commercial) 63.3% 23%
Electronic direct/ACH transactions 16.5%
Cash 11.3%
Other paper-based payments 8.9%
ACH: Automated clearing house
Note: Foreign online sales refer to e-commerce purchases made on
Source: Euromonitor, July 2019
foreign websites or websites created specifically for cross-border
transactions e.g. Amazon global sites, eBay.
Source: Euromonitor, July 2019
24 E-commerce in ASEANBusiness model
Category Local Registration Importer Cross-border Local label
registration time required required shipping required
required (less than
SG$400)
Fashion No No No Yes No
Skincare Yes Check Yes Yes No
(depending Customs (excluding
on product website for pharmaceutical
category) different skincare)
categories
Food and Yes Check Yes No Yes
beverage (depending Customs
on product website for
category) different
categories
See www.customs.gov.sg for more details.
Read more about the regulatory regime when starting an online business in Singapore.
INSIGHT: SINGAPORE
With a high internet and mobile penetration rate and a population which spends a large amount of time online,
Singapore’s e-commerce sector is expected to post a CAGR of 14.7 per cent between 2018 and 2022.
Across the region, Singaporeans make the highest number of online purchases from overseas. According to
a PwC report, 60 per cent of Singaporeans buy one or more products online at least once every month.
The absence of a Goods and Services Tax on imported goods worth up to S$400 (US$293) is highly attractive
to Singaporeans.
To be successful in Singapore's e-commerce market, Australian businesses should ensure their payment
processes and logistics and supply chain are secure and reliable. They should also develop a strong
understanding of customs and border administration processes, and the e-commerce regulatory environment.
If you are keen to learn more about establishing an e-commerce channel to start or scale your business,
contact Austrade Singapore to discuss specific opportunities and challenges.
E-commerce in ASEAN 25MARKET PROFILE
THAILAND
Market features E-commerce activity
Internet users: 37.1 million Retail e-commerce sales: US$2.3 billion*
Internet user penetration: 56.6% 2013–2018 total growth: 97.6%
Smartphone ownership: 60.0% % of total retail sales: 2.04%
Use of a mobile phone to access the internet: 33.3% E-commerce spend per capita: US$358
*Retail e-commerce sales exclude online services such as travel, software and deliveries.
Source: Euromonitor Passport database, Hootsuite/We Are Social
Market overview Top platforms
Thailand’s US$2.3 billion e-commerce market is the Lazada offers over 5 million items in Thailand from
second largest in the ASEAN region after Indonesia. leading brands and merchants across all categories.
Thailand leads Southeast Asia in social media
JIB is a specialist computer and IT products
e-commerce spending with nearly US$11 billion in 2018,
department store in Thailand. JIB has developed its
reflecting Thai shoppers’ love of browsing and sharing
own e-commerce website and become a leading online
content via social media. The country’s young, internet-
retailer for technology products and gadgets.
savvy and mobile-focused generation, significant local
and foreign investment in e-commerce businesses, Shopee is an important player in the region, especially
and government initiatives to support the growth of the in ‘mobile-first’ countries, offering a diversified mobile
sector are all driving the expansion of online shopping and web-based shopping experience.
in Thailand.
Key challenges include a lack of local warehousing
facilities for pick-and-pack and returns, as well as the
ongoing need to build trust and integrity between buyers
and sellers on social media e-commerce channels.
A number of investments are planned by local and
international players such as Central Group and Alibaba
will further support the development of Thailand’s
e-commerce infrastructure and capacity.
26 E-commerce in ASEANSocial media
Figure 25: Usage of social media platforms
100
93
91
90
84
80
72
70
65
Percentage of users
60
52
50
40
30
20
10
0
Facebook YouTube Line Facebook Messenger Instagram Twitter
Social media platforms
Source: Hootsuite/We Are Social, Digital 2019
Figure 26: Social media user profile Product categories
Age Male Female Figure 27: Top five product categories
■ Apparel & Footwear
13–17 2.1% 2.7%
20.9%
18–24 14% 14% ■ Consumer electronics
16.9%
25–34 18% 16%
■ Food & drink
35–44 8% 8% 10.8%
■ Media products
45–54 4.6% 4.8%
23.0%
55–64 2.2% 2.3% ■ Other
28.5%
65+ 1.6% 1.4%
Source: Euromonitor, July 2019
Source: Euromonitor, based on the combined advertising audience
of Facebook, Instagram and Facebook Messenger
Figure 28: Domestic vs. foreign e-commerce sales
■ Domestic
e-commerce sales
Online payment methods 62%
■ Foreign e-commerce
sales
Card payment (excl. commercial) 26.3% 38%
Electronic direct/ACH transactions 10.5%
Cash 60.8%
OtherEuromonitor,
Source: paper-based payments
July 2019 2.4%
ACH: Automated clearing house
Note: Foreign online sales refer to e-commerce purchases made on
Source: Euromonitor, July 2019 foreign websites or websites created specifically for cross-border
transactions e.g. Amazon global sites, eBay.
Source: Euromonitor, July 2019
E-commerce in ASEAN 27Business model
Category Local Registration Importer Cross-border Local label
registration time required* required shipping required
required (less than
THB1,000)
Fashion No No No Yes No
Skincare Yes 3–6 months Yes Yes Yes
Food and Yes Check customs Yes No Yes
beverage website for
different
categories
See www.customs.go.th for more details.
*This is an indication of time frame for certain product categories to be registered in Thailand based on Austrade's experience working with local
distributors.
Read Austrade’s E-commerce in Thailand guide for more detailed information.
CASE STUDY: BLACKMORES
The biggest challenge Blackmores faced before entering e-commerce was ‘grey-market’ sellers. Blackmores
Thailand could not control a fair price for its products in the market. The products sold by unofficial sellers from
abroad were also not guaranteed to have passed Thailand’s strict FDA laws.
To control the brand’s image, Blackmores signed with local e-commerce enabler aCommerce to build and
enhance its online business in Thailand. One of the first steps taken by aCommerce was to rank the brand at
the top of search engines for certain keywords such as ‘vitamins’ and ‘Blackmores’ by building a SEO-friendly,
shoppable website.
Given the nature of its products, Blackmores needed to educate visitors of the benefits of its supplements and
crafted product descriptions in the local language. Blackmores clearly states online all the ingredients, dosages
and FDA approval codes so customers have all the vital details.
The Australian brand launched its own brand.com with aCommerce in four countries: Singapore, Thailand, the
Philippines and Indonesia. Blackmores also sells on e-retailer Central.co.th.
Blackmores uses the website to publish articles, FAQs and health tips about its products to help customers
make informed decisions. This puts Blackmores in the position of a trusted health expert.
28 E-commerce in ASEANMARKET PROFILE
VIETNAM
Market features E-commerce activity
Internet users: 47 million Retail e-commerce sales: US$2.2 billion*
Internet user penetration: 53.4% 2013–2018 total growth: 379%
Smartphone ownership: 58.4% % of total retail sales: 2.02%
Use of a mobile phone to access the internet: 55% E-commerce spend per capita: US$65
*Retail e-commerce sales exclude online services such as travel, software and deliveries.
Source: Euromonitor Passport database, Hootsuite/We Are Social
Market overview Top platforms
E-commerce has taken off in Vietnam thanks to soaring Lazada is the leading e-commerce platform in Vietnam
internet connectivity and smartphone adoption, a young, and has the highest number of average visits per month.
tech-savvy population and rising disposable incomes.
Thegioididong.com is the leading mobile phone and
The appetite for online shopping is growing and the
electronics retailer in Vietnam, and is part of Mobile
number of licensed e-commerce platforms is expanding
World Investment Corporation. The platform has
rapidly. Vietnam’s e-commerce sector was worth
1,700-plus storefronts.
US$2.2 billion in 2018 and is forecast to reach
US$15 billion by 2025, accounting for 50 per cent of total Tiki.vn is Vietnam’s version of Amazon, entering the
online revenue generated in Vietnam.13 market in 2010 selling books online. In 2013, Tiki expanded
its product range to include electronic devices, lifestyle
products and miscellaneous items such as airline tickets.
Social media
Figure 29: Usage of social media platforms
100 96 95
90
80 79
74
70
Percentage of users
60
51
50
40 37
30
20
10
0
YouTube Facebook Facebook Messenger Zalo Instagram Twitter
Social media platforms
Source: Hootsuite/We Are Social, Digital 2019
E-commerce in ASEAN 29Figure 30: Social media user profile Product categories
Age Male Female Figure 31: Top five product categories
■ Apparel & Footwear
13–17 4.7% 5%
28.9%
18–24 15% 15% ■ Consumer electronics
20.5%
25–34 19% 16%
■ Beauty & Personal care
35–44 8% 7% 5.5%
■ Consumer appliances
45–54 3.5% 3.3%
13.3%
55–64 1.7% 1.4% ■ Other
31.6%
65+ 0.8% 0.4%
Source: Euromonitor, July 2019
Source: Euromonitor, based on the combined advertising audience
of Facebook, Instagram and Facebook Messenger
Figure 32: Domestic vs. foreign e-commerce sales
■ Domestic
e-commerce sales
Online payment methods 81%
■ Foreign e-commerce
sales
Card payments (excl. commercial) 17.7%
19%
Electronic Direct/ACH transactions 10.3%
Cash 72.0%
Other paper-based payments 0.0%
ACH: Automated clearing house
Source: Euromonitor, July 2019 Note: Foreign online sales refer to e-commerce purchases made on
foreign websites or websites created specifically for cross-border
transactions e.g. Amazon global sites, eBay.
Source: Euromonitor, July 2019
Business model
Category Local Registration Importer Cross-border Local label
registration time required* required shipping required
required (less than
VND1,000,000)
Fashion No No No Yes No
Skincare Yes 1–2 months14 Yes No Yes
Packaged food Yes 1–1.5 months15 Yes No Yes
and beverage
Special food Yes 2–3 months Yes No Yes
and beverage16
See www.customs.gov.vn/default.aspx for more details.
*This is an indication of time frame for certain product categories to be registered in Vietnam based on Austrade's experience working with local
distributors.
Read Austrade’s E-commerce in Vietnam guide for more detailed information.
30 E-commerce in ASEANINSIGHT: VIETNAM
Austrade Vietnam’s research found that due to the absence of cross-border infrastructure, Australian brands are
not yet directly sold by Australian suppliers.
It is possible for Australian companies to store fashion and accessories in a warehouse in China, Hong Kong and
Taiwan. When a product is sold on a Vietnamese online platform, the product can then be shipped to Vietnam
using the logistics infrastructure in China, Hong Kong and Taiwan.
Australian skincare, food and beverages need to be registered and sold online through a local distributor
or importer.
E-commerce in ASEAN 31HOW AUSTRADE
CAN HELP
The Australian Trade and Investment Commission Export Market Development Grants
(Austrade) is the Australian Government’s international
trade promotion and investment attraction agency.
The Export Market Development Grants (EMDG) scheme
We deliver quality trade and investment services to is a key Australian Government financial assistance
businesses to grow Australia’s prosperity. We do this program for aspiring and current exporters. Administered
by generating and providing market information and by Austrade, the scheme supports a wide range
insights, promoting Australian capability, and facilitating of industries.
connections through our extensive global network.
The EMDG scheme:
We also provide financial assistance for exporters
›› encourages small- and medium-sized Australian
through programs such as the Export Market
businesses to develop export markets
Development Grants scheme.
›› reimburses up to 50 per cent of eligible export
To discover how we can help you and your business,
promotion expenses above $5,000 provided that
visit austrade.gov.au or contact us at:
the total expenses are at least $15,000
info@austrade.gov.au or on 13 28 78 (within Australia).
›› provides up to eight grants to each
eligible applicant.
Austrade across ASEAN
Seeking the right advice and assistance is critical to Export Finance Australia
the success of doing business in ASEAN. Austrade has
offices in Indonesia, Malaysia, the Philippines, Singapore, Export Finance Australia (previously known as efic) is the
Thailand and Vietnam to provide exporters with market government’s export credit agency. The agency provides
guidance and access to information, promotions financial expertise and solutions to drive sustainable
and referrals. growth that benefits Australia and its partners.
Through loans, guarantees, bonds and insurance options,
EFA:
›› supports SMEs, corporates and governments to
realise export opportunities or contribute to the
export supply chain
›› helps finance sustainable infrastructure in the
Pacific region and beyond
›› provides defence export finance through the
Defence Export Facility.
32 E-commerce in ASEANREFERENCES
1. Trade for all, ASEAN: E-commerce set to dominate the region in 2019, accessed June 2019
2. ibid.
3. Google/Temasek, e-Conomy SEA 2018, Southeast Asia’s internet economy hits an inflection point, November 2018, https://www.thinkwithgoogle.
com/intl/en-apac/tools-resources/research-studies/e-conomy-sea-2018-southeast-asias-internet-economy-hits-inflection-point/
4 ibid.
5. Austrade, E-commerce in Indonesia: A guide for Australian business, January 2018
6. Myanmar Times, Aussie startup launches online marketplace for cars, www.mmtimes.com/news/aussie-startup-launches-online-marketplace-cars.
html, 19 March 2019
7. Hootsuite/We Are Social, Digital 2019, January 2019
8. Hootsuite/We Are Social, Digital 2019, January 2019
9. Rappler, A profile of internet users in the Philippines, March 2016
10. Department of Trade and Industry, DTI launches PH E-commerce Roadmap 2016–2020, February 2019, https://www.dti.gov.ph/e-commerce/84-
main-content/eco-news/9464-dti-launches-ph-e-commerce-roadmap-2016-2020
11. Adapted from Handbook of Ecommerce and competition in ASEAN by Competition Commission Singapore, Statista 2018
12. Hootsuite/We Are Social, Digital 2019, January 2019
13. Google/Temasek, e-Conomy SEA 2018, Southeast Asia’s internet economy hits an inflection point, November 2018, https://www.thinkwithgoogle.
com/intl/en-apac/tools-resources/research-studies/e-conomy-sea-2018-southeast-asias-internet-economy-hits-inflection-point/
14. Online registration. Feedback will be given by the Department of Medical after 10-15 days. In qualified cases, the approval will come 15-30 days
after first submission. If product does not qualify, businesses will be allowed to submit more documents to support their application (up to two more
times), which lengthen the total approval time.
15. For products that can do online product self-declaration according to new Decree 15/2018/ND-CP on Food Safety. These products are not listed on
the list of special products that need to register the declarations to government agencies.
16. Products that must register the declarations to relevant government agencies: Dietary supplements; medical foods; food for special dietary uses;
dietary products for children up to 36 months; mixed food additives with new uses; food additives that are not on the list of permitted food additives
compiled by the Ministry of Health.austrade.gov.au
You can also read