Ea sac Ecosystem services, agriculture and neonicotinoids - ISBN: 978-3-8047-3437-1 - WUR E ...
←
→
Page content transcription
If your browser does not render page correctly, please read the page content below
ea sac
Ecosystem services, agriculture and neonicotinoids

EASAC policy report 26

April 2015

ISBN: 978-3-8047-3437-1

This report can be found at
www.easac.eu                      building science into EU policy
EASAC

EASAC – the European Academies' Science Advisory Council – is formed by the national science academies of the
EU Member States to enable them to collaborate with each other in giving advice to European policy-makers. It thus
provides a means for the collective voice of European science to be heard. EASAC was founded in 2001 at the Royal
Swedish Academy of Sciences.

Its mission reflects the view of academies that science is central to many aspects of modern life and that an appreciation
of the scientific dimension is a pre-requisite to wise policy-making. This view already underpins the work of many
academies at national level. With the growing importance of the European Union as an arena for policy, academies
recognise that the scope of their advisory functions needs to extend beyond the national to cover also the European
level. Here it is often the case that a trans-European grouping can be more effective than a body from a single country.
The academies of Europe have therefore formed EASAC so that they can speak with a common voice with the goal of
building science into policy at EU level.

Through EASAC, the academies work together to provide independent, expert, evidence-based advice about the
scientific aspects of public policy to those who make or influence policy within the European institutions. Drawing on the
memberships and networks of the academies, EASAC accesses the best of European science in carrying out its work. Its
views are vigorously independent of commercial or political bias, and it is open and transparent in its processes. EASAC
aims to deliver advice that is comprehensible, relevant and timely.

EASAC covers all scientific and technical disciplines, and its experts are drawn from all the countries of the European
Union. It is funded by the member academies and by contracts with interested bodies. The expert members of EASAC’s
working groups give their time free of charge. EASAC has no commercial or business sponsors.

EASAC’s activities include substantive studies of the scientific aspects of policy issues, reviews and advice about specific
policy documents, workshops aimed at identifying current scientific thinking about major policy issues or at briefing
policy-makers, and short, timely statements on topical subjects.

The EASAC Council has 29 individual members – highly experienced scientists nominated one each by the national
science academies of EU Member States, by the Academia Europaea and by ALLEA. The national science academies
of Norway and Switzerland are also represented. The Council is supported by a professional Secretariat based at
the Leopoldina, the German National Academy of Sciences, in Halle (Saale) and by a Brussels Office at the Royal
Academies for Science and the Arts of Belgium. The Council agrees the initiation of projects, appoints members of
working groups, reviews drafts and approves reports for publication.

To find out more about EASAC, visit the website – www.easac.eu – or contact the EASAC Secretariat at
secretariat@easac.eu
ea sac
Ecosystem services, agriculture and
neonicotinoids
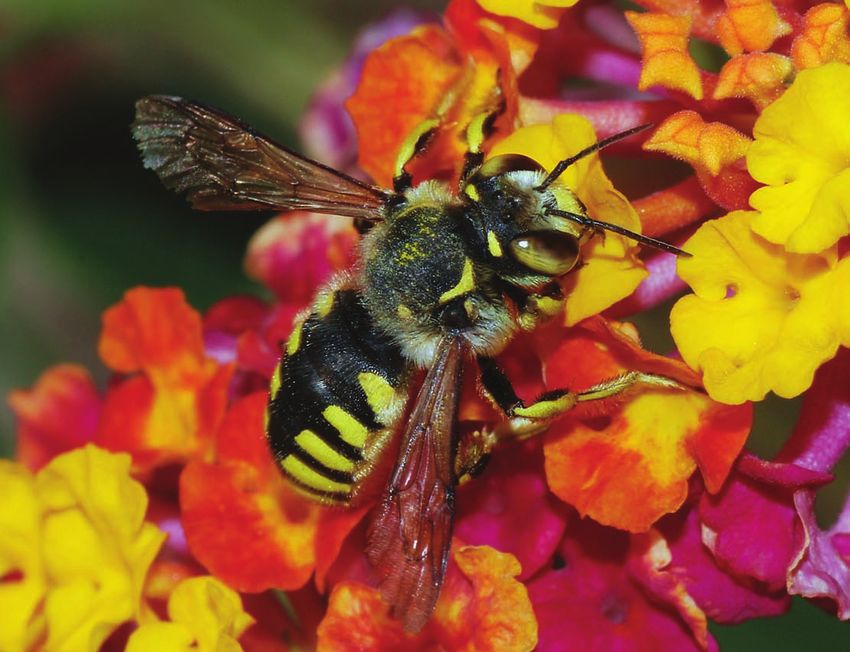
ISBN 978-3-8047-3437-1

© German National Academy of Sciences Leopoldina 2015

Apart from any fair dealing for the purposes of research or private study, or criticism or review, no part of this publica-
tion may be reproduced, stored or transmitted in any form or by any means, without the prior permission in writing of
the publisher, or in accordance with the terms of licenses issued by the appropriate reproduction rights organisation.
Enquiries concerning reproduction outside the terms stated here should be sent to:

EASAC Secretariat
Deutsche Akademie der Naturforscher Leopoldina
German National Academy of Sciences
Jägerberg 1
06108 Halle (Saale)
Germany
tel: +49 (0)345 4723 9833
fax: +49 (0)345 4723 9839
email: secretariat@easac.eu
web: www.easac.eu

Cover image: Solitary bee (Anthidium florentinum), feeding on a Lantana camara flower.
Credit: Joaquim Alves Gaspar, Lisboa, Portugal
[https://en.wikipedia.org/wiki/File:Anthidium_February_2008-1.jpg].

Copy-edited and typeset in Frutiger by The Clyvedon Press Ltd, Cardiff, United Kingdom

Printed by DVZ-Daten-Service GmbH, Halle/Saale, Germany

ii  | April 2015 | Ecosystem Services, Agriculture and Neonicotinoids                                                 EASAC
Contents
                                                                                                                                    page
Forewordv

Executive summary                                                                                                                         1

1       Introduction                                                                                                                      3

2       Ecosystem services and agriculture                                                                                                5
2.1     What are ‘ecosystem services’ and how can they be valued?                                                                         5
2.2     How are ecosystem services important to agriculture?                                                                              6
2.3     Putting an economic value on ecosystem services for agriculture                                                                   7

3       Trends in ecosystem services important to agriculture                                                                           11
3.1     Types of ecosystem services considered                                                                                          11
3.2     Pollinators and trends                                                                                                          11
3.3     Natural pest control and trends                                                                                                 14
3.4     Soil ecosystem services and trends                                                                                              14
3.5     Biodiversity and trends                                                                                                         15
3.6     Potential factors affecting agricultural ecosystem services                                                                     15

4       Neonicotinoids and organisms providing ecosystem services for agriculture                                                       19
4.1     Context                                                                                                                         19
4.2     Methods and reviewing the evidence                                                                                              19
4.3     Sources and assessing the data                                                                                                  20
4.4     Key information                                                                                                                 20
4.5     Impact on non-target organisms                                                                                                  21

5       Implications for EU policies                                                                                                    25

6       Conclusions29

Annex 1 Expert group members                                                                                                            31

Annex 2 Ecosystem services                                                                                                              33

Annex 3 Consequences of pollinator declines                                                                                             35

Annex 4 Overview of evidence on neonicotinoids and organisms providing
         ecosystem services for agriculture                                                                                             37

References53

EASAC                                                                  Ecosystem Services, Agriculture and Neonicotinoids | April 2015 |  iii
Foreword
EASAC was established to help policy-makers in European to agriculture and our society. EASAC thus decided
institutions deal more objectively and efficiently with to conduct a study on neonicotinoids from the wider
the many issues that either arise from or involve science perspective of the interactions between agriculture
and technology. Since its formation in 2001, we have and ecosystem services. EASAC member academies
contributed analyses based on the pooled expertise of our nominated 13 leading independent scientists in related
29 member academies in over 20 issues in the fields of fields who formed an Expert Group.
energy, environment, or health and biosciences.
This study has not only reviewed the science available
Science and technology issues always involve matters of to the EFSA but also over 100 new peer-reviewed
interpretation and uncertainty, and when these impinge studies that have emerged since the EFSA review. Our
on powerful stakeholders or special interest groups, report overviews the relations between agriculture and
the potential for selective use of scientific evidence in ecosystem services, their economic value and the trends
support of advocacy is considerable. Seldom has this in Europe on the key ecosystem services of pollination,
been more apparent than in the dispute over the past natural pest control and soil ecosystems, as well as the
few years over the use of the neonicotinoid class of biodiversity that contributes to such services. An analysis
insecticides. Interpreting the significance of current of the neonicotinoids and the evidence for acute,
scientific evidence, reacting to new research results chronic and sublethal effects and field effects is then
and dealing with remaining uncertainty have led to provided before considering the implications in the wider
unprecedented campaigns by stakeholders both in ecosystem context. I thank the members of the Expert
support and in opposition to continued use of these Group for contributing their knowledge and judgement,
insecticides; and even involved legal action against as well as the Environment Steering Panel and EASAC
the European Commission based on disputes over the Council for their guidance.
science. Balancing the unavoidable risks associated with
pesticide use against the critical role of pest control in As is often the case, science is indifferent to policy and
agriculture has been the task of the Commission, and the legal boundaries. In this case, too, our report points
polarisation in the dispute over science has even extended to the need to take a more systematic and holistic
to Member States when 15 supported, 8 opposed and 4 approach to policy analysis, including the precautionary
abstained during the Appeal Committee vote on 29 April principle, agricultural and biodiversity policies as well as
2013 whether to restrict certain uses of these insecticides considering impacts with other EU Directives. As part
to protect bees. of its 2013 decision, the Commission committed to
initiating a new scientific review within 2 years. EASAC
The Commission’s regulatory action in 2013 was based hopes that its analysis will help policy-makers address the
on an analysis of the available science by the European broader issues and not remain restricted to the narrow
Food Safety Authority (EFSA) published in January 2013. issue of effects on managed honey bees. We will be
At about that time, EASAC was also asked by the then gratified if this report can support EU institutions and the
Chief Scientific Adviser to the President of the European European Parliament in developing future science-based
Commission if it could contribute to the debate. We policy in these areas.
considered reviewing the then current political issue of
pollinators and neonicotinoids, but noted that pollination Professor Jos W.M. van der Meer
was just one of several ecosystem services of importance EASAC President
EASAC Ecosystem Services, Agriculture and Neonicotinoids | April 2015 | vExecutive summary
There has been considerable controversy in recent Natural pest control is where predatory insects (parasitic
years over the effects of neonicotinoids on honey bees, wasps, ladybirds, some beetles, etc.) and birds consume
culminating in a European Commission regulation in pests sufficiently to avoid the need for chemical measures.
2013 restricting certain uses of these pesticides on It is estimated to be worth US$100 billion annually
flowering crops. This year (2015), the Commission will globally and is a fundamentally important service to
review the latest science and review the regulations agriculture. Its loss weakens agriculture’s resilience and
accordingly. renders it less sustainable and more vulnerable to pests
and diseases. Another key ecosystem service is that from
Since restrictions were introduced, scientific research soil organisms and their role in enhancing agricultural
results have continued to be published at a steady productivity; the value of their role just in soil formation is
pace but disputes between stakeholders continue over estimated to be US$25 billion per year globally.
their interpretation; some claim that even the limited
2013 restrictions were unjustified by the science, while Underpinning these is biodiversity, which is positively
others see serious ecosystem-wide losses of insects and interlinked with the provision of ecosystem services, as
the species that depend on them. With such a critical well as being an objective in its own right under both
European policy issue depending on the science, EASAC global and European international agreements. Restoring
decided to conduct a detailed review of the issue. and maintaining biodiversity in farmland is a particular
However, while the public debate has focused on honey challenge for European Union (EU) policy.
bees and their pollination services, EASAC concluded
that the wider issue should be addressed of the potential Looking at the evidence from countries of the EASAC
effects on organisms providing a range of ecosystem member academies on recent trends in these aspects,
services which are critical to sustainable agriculture. we find that, while there is evidence for elevated losses
EASAC Member Academies nominated 13 leading of managed honey bee colonies over winter, no final
experts in related fields to form an Expert Group which conclusions can be drawn on recent underlying trends
worked on this study from April 2014. in Europe because of the confounding socio-economic
factors that influence colony numbers. However, trend
This report thus overviews the relation between data on wild bee species, other pollinators, on insect
agriculture and ecosystem services, and what we know species with natural pest control functions and on
of their economic value. Here, even though agriculture is biodiversity indicators such as farmland birds all show
highly managed and simplified, it still depends on services major declines in recent decades.
provided by nature. The natural ecosystem provides the
original genetic biodiversity used in breeding. Soils are Against this background, we have considered the role of
ecologically highly diverse and provide or maintain the soil neonicotinoids and their ‘systemic’ mode of action in the
biota, which contributes to soil formation and structure, plant, which renders it toxic for insects ingesting parts of
fertility, nutrient cycling, carbon capture and storage, as it. This makes the neonicotinoids effective for the control
well as water supply. Certain crops depend on pollinators, of a range of pests, including sap-sucking pests such as
and pests can be controlled or reduced by natural aphids. However, the insecticide’s residues in the plant
antagonists that move in to the crop from surrounding include pollen, nectar and guttation fluids, so non-target
natural vegetation. Maintaining strong functional species harvesting these will also be exposed. Moreover,
ecosystem services is a critical part of a sustainable transmission across trophic levels is also possible (e.g.
agricultural system. bees foraging on honey dew, predators exposed through
ingesting prey).
Pollination is one of the most studied of these ecosystem
services. Worldwide, 75% of the crops traded on the The EASAC Expert Group has conducted a detailed review
global market depend to some degree on pollinators. of the literature with particular focus on the many papers
Economic estimates place the monetary value of that have emerged since 2012. We find that there is a
pollination in Europe at €14.6 billion. With trends to grow serious difference between the public perspective of
more crops that require or benefit from pollination, there the issue and the increasing scientific evidence. Public
is also an emerging pollination deficit. While bees are (and political) focus has been very much on honey bees,
often the most important crop pollinators and honey bees especially whether honey bee colonies are being affected
are the most widely used managed pollinators, relying on by agricultural use of neonicotinoids. Yet honey bees are
a single species for pollination is not wise. Studies show just one source of pollination and may not even be the
that a diversity of pollinators can improve crop yield or most effective for some crops. Many other pollinators have
fruit quality. Restoring and maintaining pollinator diversity a valuable role—bumble bees, solitary bees, hoverflies,
is thus very important for agriculture as well as for natural butterflies and moths, etc. The declines in these have
vegetation. proceeded even while honey bee colony numbers have
EASAC Ecosystem Services, Agriculture and Neonicotinoids | April 2015 | 1varied according to weather, fashion and economic signals. between risks and benefits for neonicotinoids requires
When a wider range of ecosystem services is considered, reassessment.
studying honey bee colony trends does not determine what
is happening to the wider ecosystem and the other key Critical to assessing the effects of neonicotinoids
services provided. EASAC thus concludes that the policy on ecosystem services is their impact on non-target
debate should be much broader and include natural pests, organisms: both invertebrates and vertebrates, and
biodiversity and soil issues. whether located in the field or margins, or in soils or the
aquatic environment. Here, the Expert Group finds the
The honey bee has also become the main indicator of following.
the effects of neonicotinoids, with some field studies
having failed to show detectable effects on colony 1. There is an increasing body of evidence that the
survival at field level exposures. Yet the honey bee colony widespread prophylactic use of neonicotinoids has
structure provides a resilient buffer against losses of severe negative effects on non-target organisms that
its foragers and workers. In contrast, bumble bees are provide ecosystem services including pollination and
likely to be more sensitive to losses, while solitary bees natural pest control.
have no such buffering capacity. We conclude therefore
that protecting honey bees is not sufficient to protect 2. There is clear scientific evidence for sublethal effects
pollination services or the other ecosystem services that of very low levels of neonicotinoids over extended
we have examined. periods on non-target beneficial organisms. These
should be addressed in EU approval procedures.
The report also notes that as some intensive agriculture
has become reliant on neonicotinoids, industry studies 3. Current practice of prophylactic usage of
argue that their withdrawal would have serious economic neonicotinoids is inconsistent with the basic principles
and food security implications. On the other hand, some of integrated pest management as expressed in the
recent research has questioned the benefits of routine EU’s Sustainable Pesticides Directive.
use as seed dressing against the occasional or secondary
pests targeted. When combined with our strengthened 4. Widespread use of neonicotinoids (as well as other
and broadened understanding of risks to non-target pesticides) constrains the potential for restoring
organisms, and concerns over iatrogenic effects as a result biodiversity in farmland under the EU’s Agri-
of reduction in natural pest control services, the balance environment Regulation.
2 | April 2015 | Ecosystem Services, Agriculture and Neonicotinoids EASAC1 Introduction
Agriculture started when our ancestors selected plants fluid2; thus non-target species harvesting these parts
and animals from surrounding natural ecosystems and of the plant will also be exposed, often for a long time
started to exploit what we now refer to as ecosystem interval due to the chemicals’ persistence. Moreover,
services. Many of the plants now grown as crops depend transmission across trophic levels is also possible (e.g.
on other members of the ecosystem to ensure yields. bees foraging on honey dew, predators exposed
For example, some flowering crops need bees and other through ingesting prey, or soil organisms decomposing
pollinators to transfer pollen from one part of a flower contaminated organic matter).
to another, transferring the genetic material necessary
for reproduction. As we have continuously refined and In recent years, questions have emerged over the
developed agriculture to produce more food for an potential effects of neonicotinoids on honey bees
ever-increasing population, the link between agriculture and other pollinators such as bumble bees, and
and natural ecosystems can sometimes be forgotten. different kinds of semi-social and solitary bees, flies,
Nevertheless, that link remains, as is demonstrated when beetles or butterflies. This culminated in the European
an insect, plant, virus or fungus, whose populations Commission’s action in May 2013 restricting the use
would have probably been regulated in a natural of some of these compounds. However, the science
ecosystem, takes advantage of the simplified agricultural on the effects of neonicotinoids remains controversial,
ecosystem and becomes a pest. with two manufacturers taking legal action against the
Commission’s actions.
Since the end of the Second World War and the ‘green
revolution’ of the 1940–60s, synthetic chemical agents In May 2013, EASAC considered reviewing the issue of
have become a critical part of the farmer’s strategy for pollinators and neonicotinoids but, following on from
pest control. The resulting widespread use of chemicals an earlier study (EASAC, 2009), noted that pollination
designed to be toxic to pests (and diseases) has also led was just one of several ecosystem services of importance
to debate over how far these should replace the natural to agriculture and society. These include pollination and
regulation processes inherent in ecosystems, and how natural pest control, but also important soil functions such
to avoid toxic side-effects on non-target organisms, as the supply of mineral nutrients; moreover biodiversity
including those that deliver ecosystem services such as contributes to ecosystem services provision, as well
pollination and natural pest control1. The increasing as being a policy objective in its own right under both
intensity of modern agriculture driven by the demand European and global international actions. EASAC Council
for food to support an expanding world population is thus decided in December 2013 to conduct a study on the
not always easy to reconcile with natural systems, and science of neonicotinoids and their effects from the wider
the history of synthetic pesticides has been associated perspective of the interactions between agriculture and
with unforeseen negative impacts (see, for example, ecosystem services. EASAC member academies nominated
EEA, 2013). The agrochemical industry has invested in 13 leading independent scientists in related fields who
continued efforts to develop new active molecules in formed an Expert Group (Annex 1), which met three times
an attempt to improve effectiveness, reduce risks and during the preparation of this report.
overcome resistance developed in pests, diseases and
weeds as a response to previous chemical approaches. This report first overviews the relations between
agriculture and ecosystem services, and considers what
Since 1990, a new class of synthetic chemicals, the we know of their economic value. It then assembles
neonicotinoids, has entered the pesticide market and evidence from countries of the EASAC member
its use has grown rapidly. The neonicotinoids have a academies on selected ecosystem services and recent
‘systemic’ mode of action in the plant (i.e. they are trends. An analysis of the neonicotinoids and the evidence
absorbed and spread through the plant’s vascular system for acute, chronic and sublethal effects in the laboratory
to all tissues), which becomes toxic for insects sucking and the field is then provided before considering this
the circulating fluids or ingesting parts of it. They block in the wider ecosystem context. Finally, generic issues
the neural pathways in insects and are effective in the are considered related to other aspects of European
control of a range of insect pests, including sap-sucking Union (EU) policy, including sustainable agriculture
pests such as aphids or mealybugs. However, the systemic and biodiversity. The report is intended to support EU
nature of these insecticides means that they get into other institutions and the European Parliament in developing
parts of the plant including pollen, nectar and guttation future science-based policy in these areas.
1
We use the term ‘natural pest control’ to refer to the role of species (insects, birds, etc.) that are present in nature and that
predate or parasitise pest species as part of their natural behaviour.
2
Guttation fluid is the xylem sap which exudes from the leaves of some vascular plants; root exudates also occur.
EASAC Ecosystem Services, Agriculture and Neonicotinoids | April 2015 | 32 Ecosystem services and agriculture
2.1 What are ‘ecosystem services’ and how can genetic materials, etc., which we obtain directly. Then
they be valued? there are ‘regulating’ services, which are derived
from ecosystem processes (nutrient supply/cycling,
The benefits to humankind that can be delivered by pollination, natural pest control, etc.) or which
natural systems are known broadly as ecosystem services. regulate essential parts of the ecosystem (temperature
The concept has developed over many years: through the and humidity regulation, air or water quality, etc.).
Millennium Ecosystem Assessment (MEA, 2005) and now The concept of ecosystem services also recognises
with a Common International Classification of Ecosystem that there are other values that cannot be expressed
Services (CICES) developed under the EU Framework in such mechanistic or utilitarian terms yet may be
Program (Haines-Young and Potschin, 2013). More detail very important for cultural reasons, for amenity
is provided in Annex 2 and EASAC (2009). or habitat maintenance. Ecosystem services are of
enormous value to human society. Constanza et al.
A useful analysis of ecosystem services and their value can (1997) estimated their annual value at US$33 trillion
be found in ‘The Economics of Ecosystems and Biodiversity globally which, although controversial, emphasises
(TEEB)’ project, which uses the categories in Table 2.1. the point that ecosystem services represent a massive
contribution to the economic well-being of all
As can be seen in Table 2.1, ecosystem services societies. Yet most of these services are not recognised
include ‘provisioning’ services such as food, fibre, in the market and are treated as free public goods3.
Table 2.1 Classification of ecosystem services (adapted from TEEB, 2010)
Provisioning services
1 Food (e.g. meat, milk, honey)
2 Water (e.g. for drinking, irrigation, cooling)
3 Raw materials (e.g. fodder, fertiliser, bioenergy)
4 Genetic resources (e.g. medicinal purposes, gene banks)
5 Medicinal resources (e.g. biochemical products, models and test-organisms)
6 Ornamental resources (e.g. decorative plants)
Regulating (and supporting) services
7 Air quality regulation (e.g. capturing dust, chemicals)
8 Climate regulation (carbon sequestration, storage, greenhouse-gas balance)
9 Moderation of extreme events (e.g. flood prevention)
10 Regulation of water flows (e.g. natural drainage, irrigation and drought prevention)
11 Waste treatment (especially water purification, nutrient retention)
12 Erosion prevention (e.g. soil loss avoidance, vegetated buffer strips)
13 Maintenance of soil fertility (incl. soil formation)
14 Pollination (e.g. effectiveness and diversity of wild pollinators)
15 Natural regulation of pests, weeds and diseases
Habitat services
16 Maintenance of life cycles of migratory species (e.g. bio-corridors and stepping stones)
17 Maintenance of genetic diversity (especially in gene pool protection)
Cultural and amenity services
18 Aesthetic information (e.g. harmonic agricultural landscape)
19 Opportunities for recreation and tourism (e.g. agro-tourism)
20 Inspiration for culture, art and design
21 Spiritual experience
22 Information for cognitive development
3
A Europe-wide review of ecosystem services and their vulnerability to trends such as population growth and climate change can
be found in Schröter et al. (2005).
EASAC Ecosystem Services, Agriculture and Neonicotinoids | April 2015 | 5Table 2.2 Ecosystem service and valuation projects in EU countries
Country Activity
Belgium Wetlands, forest, coast and grassland ecosystem services
Czech Republic Grassland ecosystem services
Finland National assessment of the Economics of Ecosystem Services in Finland (TEEB Finland)
France EFESE: French national assessment of ecosystems and ecosystem services (Ministry of Ecology,
Sustainable Development and Energy)
Germany Natural Capital, ecosystems and climate change mitigation, city quality of life and ecosystems
Ireland Irish Forum on National Capital
The Netherlands Value to government, business and civil society of ecosystem services
Nordic countries Socioeconomic role and significance of biodiversity and ecosystem services
Norway Natural benefits and values of ecosystem services
Poland Ecosystem services for sustainable development of cities
Portugal Ecosystem services for business
Slovakia Agricultural ecosystems, ecosystem services at national and regional level
United Kingdom National Ecosystem Assessment, Natural Capital Committee
The Economics of Ecosystems and Biodiversity (TEEB) as water supply (Swift and Anderson, 1994). A large
project (http://www.teebweb.org/) attempts to proportion of crop plants in agriculture and horticulture
connect these free services to their economic value depend on pollinators (Klein et al., 2007), and pests
so that their loss is no longer invisible. It tries to can be controlled or reduced by natural antagonists
help identify trade-offs between development, the that move into the crop from the surrounding natural
environment and ecosystems, so that benefits can vegetation (Blitzer et al., 2012). The extent to which
be maximised and damage minimised. As part of agriculture benefits from such central services (light
a trend towards attaching economic value to such arrows in Figure 2.1) on a sustainable basis or degrades
natural ‘capital’, various countries are exploring ways them is related to the ways in which the system is
of introducing ecosystem service values into national managed.
accounts to supplement current economic measures
that ignore (inter alia) damage to environment and Loss of natural habitats through conversion to
ecosystems. Activities in several EU countries are listed intensive farming (to increase the yield of the primary
in Table 2.2. provisioning service of food production) has major
negative impacts on biodiversity, nutrient leaching, soil
2.2 How are ecosystem services important for carbon loss, emissions of greenhouse gases, regional
agriculture? hydrology, loss of soil and sedimentation of waterways,
as well as pesticide contamination and the danger
The interrelationship between ecosystem services and of poisoning non-target species (Zhang et al., 2007).
agriculture is complex (Figure 2.1); agriculture depends Rural landscapes have high cultural and heritage values
on multiple and interrelated ecosystem services while, acknowledged by the European Landscape Convention
at the same time, is also responsible for altering many (Council of Europe, 2000), but intensification includes
ecosystems and habitats, and their associated services. a trend towards simplification and loss of cultural
values of the landscape (Agnoletti, 2014). EU agri-
Agro-ecosystems are highly managed and simplified, environment policies have been designed to ameliorate
but they still function essentially as natural systems some of these negative impacts, while maintaining
and depend on several services provided by nature the primary function of agriculture and its essential
(dark arrows in Figure 2.1). For example, the natural provisioning services4.
ecosystem provides the original genetic biodiversity used
in breeding crops and livestock. Even though the above- As shown in Table 2.2, work is progressing on the
ground species diversity is simplified in agricultural economic valuation of ecosystem services and, under
landscapes, the below-ground (decomposer) community Target 2 Action 5 of the EU Biodiversity Strategy, the state
remains ecologically highly diverse, and provides and of ecosystems and their services in EU Member States
maintains the natural ecosystem of soil biota, which should have been mapped and assessed by 2014. The
contribute to soil formation and structure, fertility, economic value of such services should also be assessed,
nutrient cycling, carbon capture and storage, as well and the integration of these values into accounting and
4
Such Agri-Environment Schemes aim to mitigate the negative environmental effects of agricultural intensification (see Ekroos et al., 2014).
6 | April 2015 | Ecosystem Services, Agriculture and Neonicotinoids EASACFigure 2.1 Interactions between agriculture, management of the wider landscape and ecosystem services (adapted from Power,
2010; Aisbett and Kragt, 2010).
ECOSYSTEM SERVICES Landscape management
Farm management • Hedgerows/field
• Tillage Supporting margins
• Fertilizers • Riparian vegetation
• Herbicides, pesticides Soil structure, soil fertility, • Natural habitat patches
• Crop diversity water provision, genetic • Windbreaks
• Field size diversity • Field/parcel size
• Crop rotation • Mosaic structures
• Cover cropping
Regulating
Soil retention, pollination,
Field/Agroecosystem Landscape context
water purification,
atmospheric regulation,
erosion control ,biocontrol
of pests, water absorption
Nature and culture
Cultural
Habitats for plants, birds,
butterflies and other
wildlife, recreation, cultural
values (history of land use)
Provisioning
Food, fibre, bioenergy
reporting systems both at EU and national levels promoted intensive commodity cropping or traditional and
by 2020. Brouwer et al. (2013) reviewed the state of these small-scale organic farming), it is not currently
national ecosystem assessments (NEA) and found that possible to recognise and capture the values of all
the UK NEA was the most comprehensive, while other ecosystem services. As a result, the impact of different
Member States were at earlier stages of development in actions on these services is not considered adequately
any national assessment activity. Most current lessons can in agricultural sector decision-making. TEEB is only just
thus be learnt from the UK’s first comprehensive NEA, starting a project to understand better the benefits
which was performed between 2007 and 2011 (UK NEA, to agricultural production that are provided by
2011; Bateman et al., 2013) and has since been updated biodiversity and ecosystem services.
(UK NEA, 2014). This categorised the services and their
relation to the goods received by human society, as well as The value of pollination services to agriculture is relatively
making an initial estimate of their value. straightforward to quantify compared with other
ecosystem services; a study by Gallai et al. (2009) assessed
2.3 Putting an economic value on ecosystem the contribution of insect pollination to agricultural
services for agriculture output worldwide, and concluded that the total annual
economic value of pollination services amounts to
Placing an economic figure on the value of specific approximately €153 billion. Recent studies on economic
ecosystem services is not straightforward. Economists gains attributed to insect (particularly honey bee)
have developed many different methods and deciding pollination suggest that, across Europe, crop pollination
which one is appropriate to apply to a given service by insects accounted for €14.6 billion (±€3.3 billion)
can be subjective. There is also debate over whether annually, which equalled 12% (±0.8%) of the total
it is even appropriate or possible to attach values to economic value of annual crop production (Leonhardt et
some services5. While it is recognised that the loss of al., 2013). As shown in Figure 2.2, there is considerable
natural ecosystem services will have negative impacts variation in the value of pollination in EU countries,
on agricultural systems (whether industrial and input- depending on the crops grown.
5
For instance, in Constanza et al. (1997), it was impossible to value the contribution of the biota and their effects on the
atmosphere where this involved basic survival of humans (aspects such as oxygen content, global temperature, etc.). Such
fundamental processes also apply in agriculture: for instance, without the decomposer communities, agricultural soils would
not grow crops beyond a few years, as nutrients would not be regenerated, and straw returned to the soil would accumulate.
Rockstrom et al. (2009) explored nine possible planetary boundaries that provide a safe operating space for humanity yet which are
either already being exceeded or in danger of being surpassed.
EASAC Ecosystem Services, Agriculture and Neonicotinoids | April 2015 | 7In the USA, Losey and Vaughan (2006) estimated rather than substituted for, pollination by managed honey
that native pollinators, almost exclusively bees, were bees.
responsible for US$3.07 billion of fruits and vegetables
produced. Estimates of the value of species other than Even with crops that are not wholly dependent on insect
the honey bee are few, but the solitary bee (Megachile pollination, the presence or absence of pollinators can
rotundata) – the major pollinator of alfalfa – contributed affect the quality and/or quantity of yields (for instance
US$5.26 billion to the value of alfalfa hay in 2009 some oilseed rape varieties can also be self- and wind-
(Calderone, 2012). In the UK, the value of insect pollinated but yield is increased by insect pollination
pollination was estimated at £603 million per year in (Bommarco et al., 2012)). In addition to food crops,
2010 (Hanley et al., 2013), while the UK NEA noted that some oilseed crops for biofuels require insect pollination.
many field crops (e.g. oilseed rape, linseed), top fruits Estimates of the monetary value of pollinator services
(e.g. apples, pears, plums), soft fruits (e.g. strawberries, may also exclude the contribution of pollinators to forage
raspberries, blackcurrants) and vegetables (e.g. tomatoes crops such as clover (which supports livestock), small-scale
and peas) are dependent, at least in part, on insect agriculture such as allotments and gardens, ornamental
pollination. A recent study of the value of pollination flower production, and seed production, as well as
to UK apple production showed that insects were to wild flowers producing fruit and seeds which feed
essential for the two varieties studied and contributed invertebrates, birds and mammals (Biesmeijer et al., 2006;
£36.7 million per annum (Garratt et al., 2014). In Ireland, Jacobs et al., 2009).
the economic value of insect pollination to oilseed rape
was estimated at an overall value of €3.9 million per Another ecosystem service is the role of natural enemies
annum (Stanley et al., 2013). in reducing the need for farmer-driven pest control.
Such natural pest control is provided by a wide range of
Globally, it has been demonstrated that wild pollinating invertebrate predators and parasitoids, such as carabids,
insects (solitary bees and bumble bees, syrphids syrphids, spiders, ladybirds and parasitic wasps (Collins
(hoverflies), etc.) are relevant for crop productivity and et al., 2002; Schmidt et al., 2003). Landis et al. (2008)
stability, even when honey bees are abundant. Garibaldi and Gardiner et al. (2009) excluded natural enemies from
et al. (2011a) demonstrated that stability of flower-visitor experimental plots and measured the consequent increase
richness, the visitation rate of wild pollinator insects in pest infestation. Based on this, Landis et al. (2008)
and fruit set, all decreased with distance from natural estimated that the value of biological control against
areas, while honey bee visitation did not change with soybean aphid was at least US$239 million per year in
isolation. Moreover, wild insects often pollinate crops four US States alone. Clearly the total value of biological
more effectively than honey bees, and an increase in their control services across all pests and all States would be
visitation rate enhances fruit set by twice as much as an much larger, and Losey and Vaughan (2006) estimated
equivalent increase in honey bee visitation (Garibaldi et that the annual value of pest control services provided by
al., 2013). These authors also found that visitation by wild native insects in the whole of the USA was approximately
insects and honey bees promoted fruit set independently, US$13.60 billion. A wider assessment of the efficiency of
so that a high abundance of wild insects supplemented, natural enemies (through exclusion devices) is given by Le
Roux et al. (2008), who reviewed international research
(1986–2007) on cereal as well as vegetable and fruit
Figure 2.2 Economic value for crop production of insect pol- cropping systems in tropical and temperate countries.
lination (EVIP) in EU Member States measured in euros per Of these studies, 97% revealed significant and often
square kilometre (Leonhardt et al., 2013).
very strong increases in pest populations (between 55%
and 600%) following the exclusion of natural enemies.
EVIP per km2 Overall, it has been estimated that such natural control
Data not available of pests was worth US$100 billion annually and globally
0 − 600
600 − 3 000 (Pimentel et al., 1997).
3000 − 4 000
4 000 − 24 000 Rather than economic valuations, another approach
is to evaluate the influence of natural pest control on
agricultural yield. In Northern Europe, Helenius (1990)
and Östman et al. (2003) consistently reported a yield
reduction of around 20% as a result of even partial
exclusion of generalist predators of aphids from spring
cereals (using physical barriers to ground-dwelling
species). The latter publication reveals that yield increases
attributable to predators can be compared with yield
increases from insecticide use for the evaluation of
different management strategies. The conclusion from
such research is that negative effects of pesticide use
8 | April 2015 | Ecosystem Services, Agriculture and Neonicotinoids EASACon natural pest control should be minimised to make Despite the fundamental importance of soil to agriculture
intensive agriculture more sustainable. (Nuti et al., 2011), estimates of economic impacts of soil
degradation are limited and mostly focused on erosion
There is good evidence that adequate habitat and contamination, not soil biodiversity. Pimentel et
management within crop fields (such as the upkeep of al. (1997) valued the role of soil biota activity in soil
grass field margins or the setting up of grassy banks or formation as US$5 billion per year for the USA and
flower strips) to protect and enhance ecosystem services US$25 billion globally.
has positive effects on the abundance of natural enemies
of many pest species (Gurr et al., 2000; Landis et al., One challenge in valuation is to estimate the combined
2000). At a wider scale, landscape heterogeneity and value of the multiple services that ecosystems may
complexity influence beneficial predatory arthropods, provide to agricultural production, since valuation of
and enhance their natural control activity against pests individual services may underestimate the value of
(Chaplin-Kramer et al., 2011; Veres et al., 2013). ecosystem services as a whole (Wam, 2010). In this
context, Sandhu et al. (2008) used a combination of
Enhancing ecosystem services in agricultural valuation techniques to estimate economic values
production may require expenditures that have to be for different ecosystem services on arable farming
counterbalanced by economic benefits if they are to be lands in New Zealand, including natural pest control,
justified. For instance, Gurr et al. (2003) demonstrated soil formation, mineralisation of plant nutrients,
that the cost of establishing a ‘beetle bank’ in a 20 pollination, services provided by shelterbelts and
hectare wheat field, combined with the value of yield hedges, hydrological flow, aesthetics, food provision,
lost through the land taken out of production, could provision of raw materials, carbon accumulation,
be US$130. On the other hand, the value of keeping nitrogen fixation, and soil fertility. While there may
aphid pest densities below the action threshold across be room for debate over the appropriateness of the
the 20 hectare plot was estimated to be US$450, and economic valuations applied to so many different
the value of avoiding a 5% aphid-induced yield loss was variables, the value of the services currently ignored by
US$1,000. Experiments in France (Le Roux et al., 2008) on the market was calculated as approximately 15% of the
redesigning fields to long and narrow shapes adjoining value of the food produced, both via organic farming
refuge zones (beetle banks and hedges) allowed savings and conventional farming. This may be a conservative
in pesticide use worth US$19,000 per annum on a 320 value, as the study assumed that conventional farming
hectare cereal farm. does not benefit from natural pest control.
EASAC Ecosystem Services, Agriculture and Neonicotinoids | April 2015 | 93 Trends in ecosystem services important to agriculture
3.1 Types of ecosystem services considered only a narrow range of flower species. They may thus
act as generalist or specialist pollinators, some effectively
Of the ecosystem services introduced in Section 2, we pollinating a range of species and others only a few. Since
now consider some that are of particular relevance to bees rely on nectar and pollen for all stages of their life
agriculture and their current trends in Europe. These cycle, provisioning their offspring with it, as well as feeding
are pollination, natural pest control, maintenance of on it as adults, they are totally dependent on flowers and
soil fertility and farmland biodiversity and its supporting are frequent flower visitors. This fact, along with a range
habitats. The last group includes flowering plants, of body sizes, proboscis lengths, hairiness and capacity
arthropods, birds and mammals (as well as other to forage in inclement weather, mean that bee species
invertebrates, fungi, protists and prokaryotes), and are the most efficient pollinators. European bee species
maintaining farmland biodiversity features prominently comprise the managed western honey bee (Apis mellifera),
in the EU’s agricultural policy. European agri-environment 68 bumble bee species and over 1,000 semi-social and
schemes (introduced following Council Regulation No solitary bee species. However, other pollinators may have
(EEC) 2078/92) received nearly €20 billion in funding from advantages over bees in some circumstances: for instance,
2007 to 2013, which is 22% of the total expenditure for syrphids can visit flowers at lower temperatures than bees.
rural development. Biodiversity and associated ecosystem
processes provide ecosystem services, with many species Worldwide, 264 crop species are wholly or partly
involved in delivering more than one ecosystem service dependent on pollination, and production of 75%
(Figure 3.1). However, overall trends in abundance and of the crops traded on the global market depends to
species richness for many farmland species (discussed in some degree on pollinators (Klein et al., 2007). While
the following sections) are downward or uncertain. bees are often the most important crop pollinators
and the honey bee is the most widely used managed
3.2 Pollinators and trends pollinator, relying on a single species for pollination is
not wise. Several studies have indicated that a diversity
Many insect species contribute to pollination, including of pollinators can improve crop yield or fruit quality
bees, syrphids, butterflies and moths, and some beetles. (Chagnon et al., 1993; Klein et al., 2003; Greenleaf
These insects usually visit flowers to collect food (nectar et al., 2006; Hoehn et al., 2008; Albrecht et al., 2012;
and/or pollen) and may be generalists having a wide diet Classen et al., 2014). This is because interactions
and visiting many plant species, or specialists that visit between bees of different species (for example by
Figure 3.1 Ecosystem services and biodiversity components.
Ecosystem Biodiversity Trends Main Citation
components on farmland (see text)
services
(Honey bee colonies)
1985-2005 2005-2010
Potts et al., 2010b
Breeze et al., 2014
Pollination Fox et al., 2011
Munguira et al., 2014
Maintenance of Carvelheiro et al., 2013
soil production
capacity Speight et al., 1998-2013
Natural pest
?
Brooks et al., 2012
control
Habitat provisioning ?
for birds, butterflies, Fox et al., 2013
flowering plants etc.
Species providing services RSPB, 2013; SOVON, 2012
Supporting habitat for species
Note: examples of essential ecosystem services are in the first column, biodiversity components in the second column and trends of
abundance and species richness of the involved taxa on farmland in the third column. The fourth column gives key references. The
included biodiversity components are honey bees, butterflies, bumble bees, hoverflies, earthworms, carabid beetles, spiders, moths
and farmland birds.
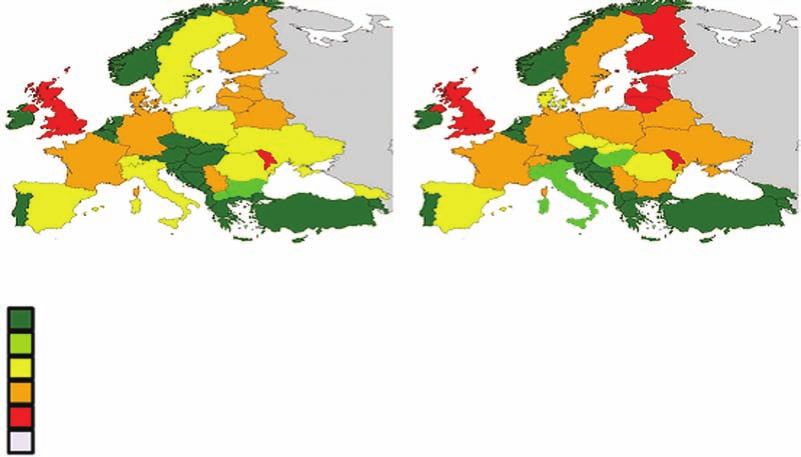
EASAC Ecosystem Services, Agriculture and Neonicotinoids | April 2015 | 11Figure 3.2 European trends (1965-85 and 1985-2005) in number of managed honey bee colonies (from Figure 1 in Potts
et al., 2010b).
(a) Colonies 1965–1985 (b) Colonies 1985–2005
20% 20%
Increase Decrease
SE SF SE SF
NO
NO
DK SC DK
WA EN WA EN NL
DE DE
BE BE
CZ CZ
LU SK LU SK
AT AT
IT IT
GR PT GR
competition or because they consume floral resources declines since 1985 point to a 25% loss of honey bee
in different ways) may influence foraging behaviour, colonies (Potts et al., 2010b). Declining numbers of
change their movement patterns between flowers, and honey bee colonies have also been recently reported in
thus promote pollen dispersal and outcrossing rates in several countries in Europe (e.g. Belgium, Italy, Portugal,
plants (Brittain et al., 2013a), or because species-specific Germany, the Netherlands and the UK) (Maxim and van
reactions to changing environmental conditions provide der Sluijs, 2013).
a diversity of pollinators that buffers against changes in
weather patterns (Brittain et al., 2013b). Additionally, Drawing any conclusions about trends from such data
different bee species visit different areas in the fruit tree requires a differentiation between ‘losses’ and ‘declines’.
canopy (Brittain et al., 2013b) or on climbing crops like Losses are the deaths of colonies which may occur in the
pumpkins (Hoehn et al., 2008). Also, since many wild temperate regions especially over winter (Neumann and
plant species, which provide food for higher trophic Carreck, 2010); beekeepers can compensate for such
organisms and other ecological functions, benefit from winter losses by splitting strong colonies the following
pollination by a range of insect taxa, pollinator diversity spring. However, declines may occur both in the number
is important not just for crop production (Ollerton et al., of beekeepers or in the numbers of colonies maintained
2011). by each beekeeper. The latter are particularly heavily
influenced by socio-economic factors, by the price of
3.2.1 Honey bees honey, the presence or absence of subsidies, or the
popularity of beekeeping as a hobby.
Surveys of managed honey bees throughout Europe have
revealed declines in both the number of colonies and Quantitative assessments and comparisons between
the number of beekeepers in the 1985–2005 period, in countries have been limited by lack of consistent
contrast to overall increases in the preceding 20 years standards for measurement and the fragmented nature
(Figure 3.2). Europe-wide data since 2005 for individual of many of the surveys. An initiative to resolve this
countries show that colony numbers have increased in is the international network COLOSS (prevention of
26 countries (up to a doubling) while they had declined honey bee COlony LOSSes), which currently consists
(up to 47%) in 15 countries (Breeze et al., 2014), with of 444 members from 70 countries (www.coloss.org).
an average increase in colony numbers of 7% between COLOSS standardises monitoring methods through its
2005 and 2010. In the UK NEA, honey bee colonies ‘BEEBOOK’ and collects data at a global scale on colony
are reported to have severely declined in England, deaths to provide appropriate information and advice
where they dropped by 54% between 1985 and 2005 to stakeholders, including government policy-makers.
(in Scotland they declined by 15%; and in Wales by The results of the COLOSS surveys in winter losses have
23% (Potts et al., 2010a)). In central Europe, estimated been published (van der Zee et al., 2012a, 2012b, 2014)
12 | April 2015 | Ecosystem Services, Agriculture and Neonicotinoids EASACand show very high variability in winter losses between So far, only a few cases of CCD have been reported in
countries (from zero to one-third) and mean loss rates Europe (Dainat et al., 2012). The clinical symptoms ‘few
of 12.3% (2008/9), 16.9% (2009/10), 16.1% (2012/13) or no dead bees in colonies’ as well as ‘colonies dead
and 9.1% (2013/4). with excess brood’ strongly depend on ambient weather
and are thus not suitable for diagnostics in the temperate
In 2012, an epidemiological surveillance programme on regions. It may well be that the frequency of CCD has been
honey bee colony mortality informed by the German underestimated in Europe (Dainat et al., 2012). In any case,
Bee Monitoring Project (Genersch et al., 2010) was CCD appears to be of minor importance for colony losses in
implemented in 17 European countries6 (Chauzat et Europe and is not listed anymore as a major factor in recent
al., 2014) involving a total of 3284 apiaries and 31,832 US surveys of colony losses (van Engelsdorp et al., 2013).
colonies, and monitored by bee inspectors, veterinarians, Indeed, honey bee colonies can die in many ways and CCD
or bee scientists7. For the winter of 2012–2013, the mean is just one of them with potentially multiple causes.
rate of winter colony losses was 21.2%, ranging from
3.5% (Lithuania) to 33.6% (Belgium). A south–north
geographical pattern was seen, with most southern 3.2.2 Other pollinators
countries experiencing losses below 10%, whereas losses
in northern countries were between 20% and 30% A recent study by the Status and Trends of European
(except for Belgium). The report noted that the rate of Pollinators (STEP)8 project showed that of the 68 bumble
winter colony loss in the USA, which has been around bee species that occur in Europe, 46% have a declining
30% for most of the previous 12 years (van Engelsdorp population, 29% are stable and 13% are increasing;
et al., 2008, 2009, 2012), is generally higher than in 24% were considered to be threatened with extinction.
Europe. European beekeepers consider ‘normal’ winter The numbers of bumble bee, solitary bee, butterfly,
losses in Europe as being 10% or below (Haubruge et al., moth and syrphid species in the UK, the Netherlands and
2006; Charrière and Neumann, 2010; Genersch et al., Belgium have generally declined since 1950 (Williams
2010; Chauzat et al., 2014); this was exceeded in and Osborne, 2009; Keil et al., 2010; Fox et al., 2011;
2012–2013 in 6 out of the 17 member states surveyed. Carvalheiro et al., 2013). Three bumble bee species are
thought extinct in the UK, and eight have undergone
Such data emphasise the high variability of losses of severe range contractions (UK NEA, 2011). Since 1980,
honey bee colonies in time and space. It appears prudent, wild bee diversity has declined in most landscapes, with
therefore, not to base any decisions or conclusions on habitat- and diet-specialist species suffering greater
single-year data and to conduct surveys over several years. losses than more generalist species (Biesmeijer et al.,
One example of this is the standardised COLOSS survey, the 2006). In Ireland, more than half of wild bee species have
results of which, in its initial years, support the view that undergone substantial declines in their numbers since
losses can vary substantially between years and regions, 1980. The distribution of 42 species has declined by more
and should be monitored for long periods to be able to than 50% (Fitzpatrick et al., 2006).
understand potential trends in losses of honey bee colonies.
Moths and butterflies have declined in abundance and
A particularly notable phenomenon in bee management range too, although they make a smaller contribution
has been colony collapse disorder (CCD) in the USA, to crop and wildflower pollination services. In a study of
which is characterised by the following clinical symptoms common macro-moths in Britain (Conrad et al., 2006),
(Dainat et al., 2012): the abundance of two-thirds of the 337 species studied
had declined over the 35-year study, and 21% (71) of
•• rapid loss of adult workers; the species declined by more than 30% per decade.
•• few or no dead bees in colonies; Sixty-two moth species have gone extinct since the
1960s (Fox et al., 2013). Similar decreases have been
•• colonies dead with excess brood; reported from other European countries. Groenendijk
and Ellis (2011) analysed 733 macro-moth species in
•• small cluster of bees with queen present;
the Netherlands, finding that 71% of Dutch species
•• presence of capped brood; decreased in abundance and the total abundance of
moths decreased by one-third (1980–2009). Mattila et al.
•• presence of food stores, both honey and bee bread; (2006, 2008) showed significant overall decreases in the
•• no damaging levels of Varroa destructor or Nosema distribution of macro-moths in the families Geometridae
species. and Noctuidae (590 species in total) in Finland.
6
Belgium, Denmark, Germany, Estonia, Finland, France, Greece, Hungary, Italy, Latvia, Lithuania, Poland, Portugal, Slovakia, Spain,
Sweden, United Kingdom.
7
This programme was co-financed by the European Commission (Directive 2012/362/EU) and coordinated by the European Union
Reference Laboratory for bee health.
8
http://www.step-project.net/
EASAC Ecosystem Services, Agriculture and Neonicotinoids | April 2015 | 13You can also read