EAST BAY REGIONAL PLANNING UNIT - Regional Plan 2021-2024 - East Bay Works
←
→
Page content transcription
If your browser does not render page correctly, please read the page content below

EAST BAY REGIONAL
  PLANNING UNIT
 Regional Plan 2021-2024
East Bay Regional Planning Unit
PY 21-24 Regional Plan Public Comment Announcement

The East Bay Regional Planning Unit (EBRPU) is pleased to release the Draft
2021–2024 Regional Plan for 30-day public comment ending April 19, 2021.
The plan is available on the EASTBAYWorks website. Comments can be
submitted directly to regionalplancommentebrpu@gmail.com or through the
EASTBAYWorks website.
The State of California Workforce Development Board requires regions to create
new Regional Plans every four years. The EBRPU comprises the four East Bay
Workforce Development Boards serving Alameda and Contra Costa
Counties and the Cities of Oakland and Richmond.
Developed with input from partners and stakeholders, the regional plan describes
goals and strategies for building regionally coordinated workforce services to
meet the needs of employers and job seekers anchored by equity and inclusion.
The East Bay Regional Planning Unit (EBRPU) includes the following Workforce
Development Entities in Alameda and Contra Costa Counties:
      • EASTBAYWorks
      • Alameda County Workforce Development Board
      • Contra Costa County Workforce Development Board
      • Oakland Workforce Development Board
      • Richmond Workforce Development Board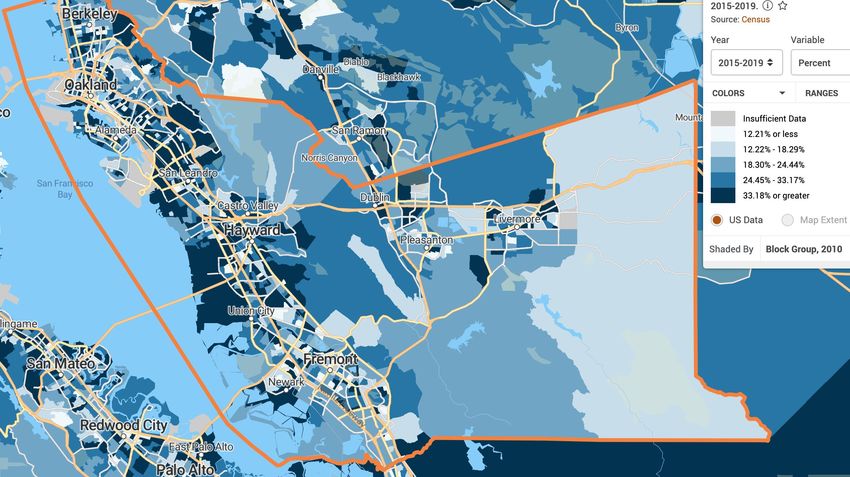
East Bay Regional Planning Unit
                                                                                                     Regional Plan 2021-2024

Table of Contents

Introduction ......................................................................................................................... 2
1. Analytical Overview of the Region ................................................................................... 2
   Workforce and Economic Analysis .................................................................................. 2
      1.a. COVID-19 Impact on the East Bay Workforce ...................................................... 2
      1.b. Overview ................................................................................................................ 6
      1.c. Labor Force .......................................................................................................... 16
      1.d. Industry and Occupational Demand ................................................................... 20
      1.e. Employer Needs ................................................................................................... 27
2. Fostering Demand-Driven Skills Attainment Regional Sector Pathways ....................30
      2.a. Developing Sector Initiatives for In-Demand Industry Sectors and
           Occupations ......................................................................................................... 30
      2.b. Increasing Access to Training and Education Aligned with the Regional
           Labor Market....................................................................................................... 33
      2.c. Training and Education Leading to Industry-Recognized Post-Secondary
           Credentials .......................................................................................................... 36
      2.d. Improving Program Alignment and Expanding Pre-Apprenticeship and
           Apprenticeship Opportunities ............................................................................ 37
3. Enabling Upward Mobility For Californians.................................................................38
   3.a. High Road Workforce System.................................................................................38
   3.b. Equity and Economic Justice ................................................................................. 39
4. Aligning, Coordinating, and Integrating Programs and Services .................................48
   4.a System Alignment .................................................................................................... 49
      Administrative Cost Arrangements for the Region ................................................... 49
      Regional Service Strategies, Including Cooperative Agreements and MOUs........... 49
      Coordination of Services with Regional Economic Development Services and
      Providers .................................................................................................................... 50
      Coordination of Supportive Services ......................................................................... 51
      Negotiating Local Levels of Performance .................................................................. 51
Conclusion ......................................................................................................................... 51

                                                            Page 1 of 51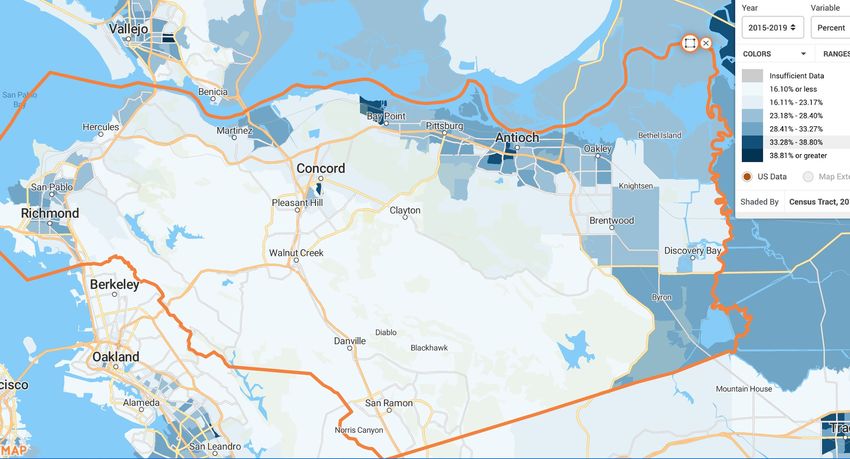
East Bay Regional Planning Unit
                                                                           Regional Plan 2021-2024

East Bay Regional Planning Unit
Regional Plan 2021-2024
Introduction
The East Bay Region of California is a sub-region of the nine county San Francisco Bay Area, one
of the most productive and prosperous regions on the planet. The East Bay Regional Planning
Unit (EBRPU) is a partnership of member Workforce Development Boards representing
Alameda County and the City of Oakland, and Contra Costa County and the City of Richmond.
The four Workforce Development Boards have a long-standing regional partnership pre-dating
the Workforce Innovation and Opportunity Act (WIOA), under the EASTBAYWorks brand.
1. Analytical Overview of the Region
Workforce and Economic Analysis
The East Bay Region’s economy and its workforce have been significantly impacted by the
COVID-19 pandemic. As a result, workforce and economic analysis requires maintaining a
balance between short-term impacts and long-term trends. Further, the value of historical data
in predicting future trends is limited. The uncertainties of the current economic crisis are woven
into this analysis as part of the larger effort to plan for regional workforce development efforts
once the COVID pandemic abates.

The following Workforce and Economic Analysis is intentionally framed through a racial equity
and economic justice lens. The disproportionate impact of the COVID-induced recession on
people of lower socio-economic status and persons of color cannot be overstated. Job losses
have hit levels not seen since the Great Depression of the 1930s, particularly in occupations such
as food service, hospitality, personal service, entertainment, and travel—positions filled
predominantly by lower paid workers. Protests on behalf of racial justice and equity occurred
across the country in the Fall of 2020. Though these protests were sparked by incidents of police
brutality against African American citizens, they were also an outcry against the economic
inequity laid bare by the pandemic.

This section also includes information vital to workforce development planning, such as
demographic information, income and poverty data, skills and educational levels, and employer
demand.
1.a. COVID-19 Impact on the East Bay Workforce
Much like the rest of the United States, California and the East Bay Region have experienced
serious disruption as a result of the COVID-19 pandemic. Beginning in March 2020, counties
issued stay-at-home orders and on March 19th California Governor Gavin Newsome issued the
nation’s first statewide stay-at-home order. At the time this plan was written the pandemic
continues, and both Alameda and Contra Costa Counties are under stay-at-home orders as rates
of infection and deaths remain high. This section details the impact of the COVID-19 pandemic
on the East Bay workforce.

The pandemic has had a devastating impact on jobs in the region, across sectors, with a 10.5%
decrease in total jobs during a one-year period (October 2019 - October 2020). The leisure and
hospitality industry has been the most affected industry during that time period, losing 36,700

                                           Page 2 of 51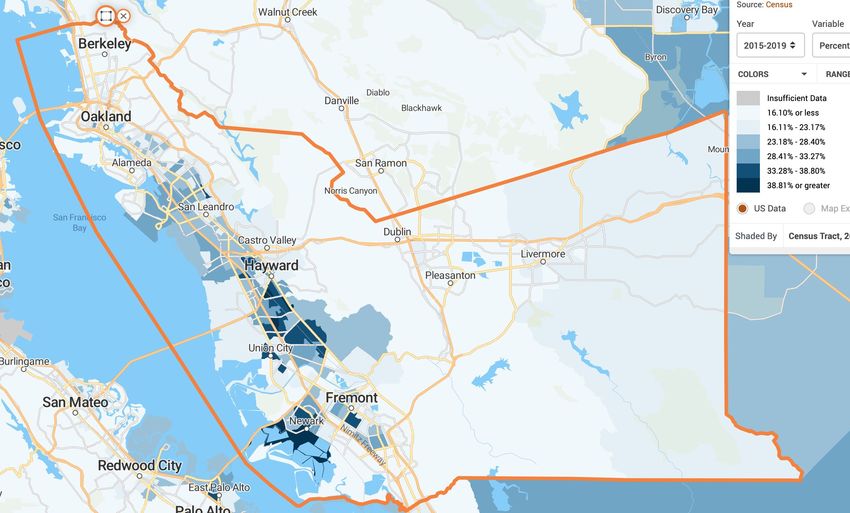
East Bay Regional Planning Unit
                                                                                      Regional Plan 2021-2024

(30.4%) jobs.1

Historically, when workers lose their employment during times of recession they experience
much larger lifetime earning losses than when employment is lost during non-recession times.
During the more recent Great Recession, workers in Washington State who were displaced and
reentered the workforce “earned 16% less than comparable workers who had not been
displaced.”2 Job loss during a recession can also have generational impacts. For example,
children whose fathers were dislocated during the 1980s recession earned less as adults than
children of fathers who were not displaced.3 It appears that job loss during a recession also has
serious health implications, with workers displaced during the 1980s recession experiencing a
life expectancy reduction of 1 to 1.5 years.4 Although not yet fully quantified, the current
pandemic and economic recession will likely have a similar impact on today’s workforce.

Prior to the pandemic (2014 - 2018), 28% of all workers (1.1 million) in the Bay Area were
considered essential.5 Among essential workers in the region, people of color and immigrants
are disproportionately represented. People of color comprised 58% of all workers and 66% of
essential workers. In contrast, white workers comprised 42% of all workers but only 34% of
essential workers. As shown in Table 1, 10 of the Bay Area’s 11 essential worker sectors are filled
disproportionately by people of color.

1 “Monthly Labor Force Data for Counties, October 2020 - Preliminary,”Employment Development Department:
Labor Market Information Division, published November 20, 2020,
https://docs.google.com/spreadsheets/d/1boqhAzDjtefSsxi1sTUijeJDEL_CTO1i/edit#gid=175580821
2 B. Rose Kelly, “Great Recession Still Plagues Workers With Lower Lifetime Wages,” Princeton University, March 12,

2018, https://spia.princeton.edu/news/great-recession-still-plagues-workers-lower-lifetime-wages
3 https://www.brookings.edu/blog/jobs/2011/11/04/unemployment-and-earnings-losses-a-look-at-long-term-

impacts-of-the-great-recession-on-american-workers/
4 Michael Greenstone, Adam Looney, and Michael Greenstone and Adam Looney, The Hamilton Project,

“Unemployment and Earnings Losses: A Look at Long-Term Impacts of the Great Recession on American
Workers,”Brookings Institute, November 4, 2011,
https://www.brookings.edu/blog/jobs/2011/11/04/unemployment-and-earnings-losses-a-look-at-long-term-
impacts-of-the-great-recession-on-american-workers/
5 All data in this paragraph is from Jamila Henderson, “A Profile of Frontline Workers in the Bay Area,” Bay Area

Equity Atlas, May 13, 2020, https://bayareaequityatlas.org/essential-workers

                                                   Page 3 of 51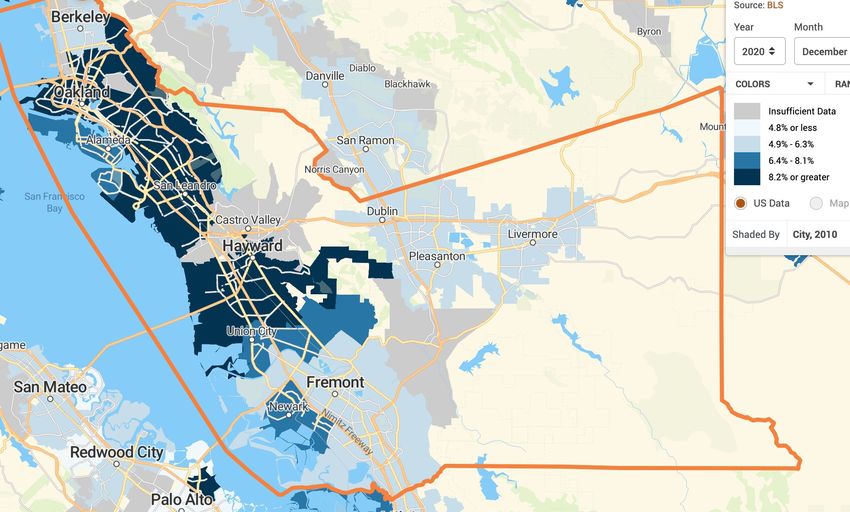
East Bay Regional Planning Unit
                                                                                    Regional Plan 2021-2024

Table 1: Bay Area Essential Workers By Industry and Race6

COVID-19 Impact on Minority-Owned Businesses
Workforce trends in the East Bay follow several national trends. Across the United States, over a
two-month period at the beginning of the pandemic, the number of Black-owned businesses
declined by 41%, immigrant-owned businesses by 36%, Latinx-owned businesses by 32%, and
Asian-owned businesses by 26%.7 In comparison, white-owned businesses decreased at a rate of
17%. As the pandemic endures and financial strain has continued to affect business, the impact
on minority-owned businesses has likely worsened since these early statistics were reported. The
East Bay small business community is particularly susceptible to negative effects caused by the
economic downturn. The majority of East Bay businesses (80%) employ less than 10 employees.
These “microbusinesses” are often less financially stable, with limited cash reserves for
emergency situations. Moreover, microbusinesses in the East Bay are disportionately minority
or women owned,8 making these populations particularly susceptible to economic loss. The

6 Henderson, “A Profile”. https://bayareaequityatlas.org/essential-workers
7 All data in this paragraph is from “Black and Brown Owned Businesses Hit Hardest by COVID-19 Pandemic,” Covid
Insight Center, posted August 1, 2020 https://insightcced.org/black-and-brown-owned-businesses-hit-hardest-by-
covid-19-pandemic/
8 East Bay Economic Development Alliance, “East Bay Business Recovery Survey Results,” May 19, 2020: 3.

                                                  Page 4 of 51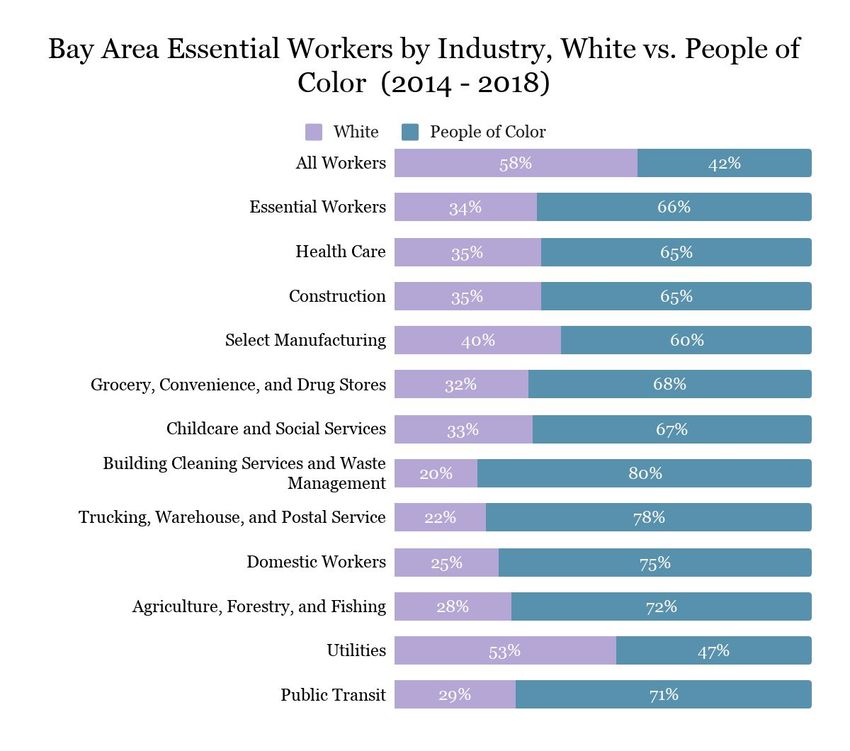
East Bay Regional Planning Unit
                                                                                    Regional Plan 2021-2024

image below demonstrates East Bay job loss during the pandemic in three key sectors. Prior to
the COVID-19 pandemic, in October 2019, the East Bay Region was home to 1,187,600 total jobs
in all sectors. As indicated in the figure below, the decline in total employment from that date to
October 2020 was 124,700, equal to 10.5% of all jobs.

                    East Bay jobs decreased by 124,7009
                           from October 2019 to October 2020.
Figure 1: Decline in Jobs in Identified Sectors

    Leisure and hospitality jobs       Government jobs decreased            Private educational/ health
            decreased by                        by                           services jobs decreased by
            36,700                               17,500                              14,80010

COVID-19 Impact on Workers
Many people have started working remotely to avoid health risks and abide by government
mandates to work remotely to the extent possible during the pandemic. Compared to the rest of
the Bay Area, the East Bay Region has fewer workers in occupations that are considered eligible
to work remotely.11 Although 45% of Bay Area residents can work remotely, in Contra Costa
County only 38% and in Alameda County 40% have that option.12, 13 Workers who are not able to
work remotely are faced with extremely difficult decisions related to balancing the need for
income, health, and issues related to childcare, child education, and public transportation.

Children across the country have been forced to rely on virtual or some form of home-based
“distance learning” as a result of school closures during the pandemic. According to the U.S.
Census Bureau, almost 93% of all households with school-aged children report that their
children have transitioned to learning at home.14

Working mothers, especially those with young children, have been negatively impacted by the
pandemic at greater rates than mothers with older children and all fathers. According to a
McKinsey & Company Women in the Workplace 2020 report, one out of every three working
mothers have considered either leaving their jobs or reducing their hours because of the
pandemic.15 Black, Latinx, and Hispanic women have experienced higher rates of

https://drive.google.com/file/d/1ajtpuoSRjo-4iL9swWuZDBOvwvJySkOj/view
9 Juliet Moeur, “Oakland Hayward Berkeley MD Labor Force and Industry Employment Narrative,” Employment
Development Department, 2020,
https://docs.google.com/document/d/1pI3oCSSlJT4zcnCfpBAKJjcXXLS0h5uL/edit#
10 Moeur, “Oakland Hayward”. https://docs.google.com/document/d/1pI3oCSSlJT4zcnCfpBAKJjcXXLS0h5uL/edit#
11 Jonathan I. Dingel and Brent Neiman, “How Many Jobs Can be Done at Home?” Becker Friedman Institute, (July

2020) 2-4, https://bfi.uchicago.edu/wp-content/uploads/BFI_White-Paper_Dingel_Neiman_3.2020.pdf
12 “Bay Area Economic Update,” Bay Area Council Economic Institute, October 22, 2020,

https://drive.google.com/file/d/1ayW8UePzg_3F5aw1oqB0-TUL1wA4DakO/view
13 East Bay Economic Outlook 2020,” East Bay Economic Development Alliance, published May 21, 2020,

https://drive.google.com/file/d/1mB3T8vx56GPxjlonuspUipFvEnvDvpdI/view
14 Kevin Mcelrath, "Nearly 93% of Households With School-Age Children Report Some Form of Distance Learning

During COVID-19" United States Census Bureau, August 26, 2020,
https://www.census.gov/library/stories/2020/08/schooling-during-the-covid-19-pandemic.html
15 Sarah Coury, Jess Huang, Ankur Kumar, Sara Prince, Alexis Krivkovich, and Lareina Yee,"Women in the Workplace

2020," McKinsey & Company, September 30, 2021, https://www.mckinsey.com/featured-insights/diversity-and-
inclusion/women-in-the-workplace

                                                  Page 5 of 51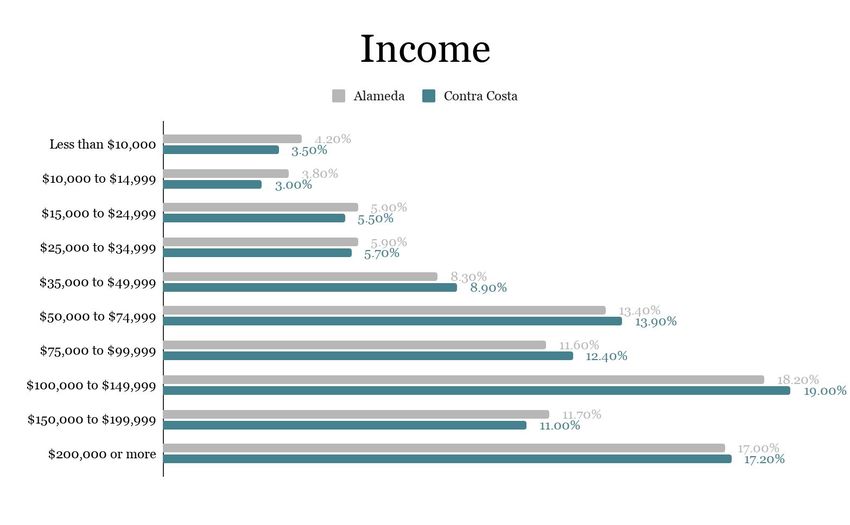
East Bay Regional Planning Unit
                                                                                    Regional Plan 2021-2024

unemployment compared to white women.16 Further, economists predict that female
employment will not return to pre-pandemic levels until 18 months after employment levels for
men return to normal.17

        “COVID-19 has also increased the pressure on working mothers, low-wage and
        otherwise. In a survey from May and June, one out of four women who became
        unemployed during the pandemic reported the job loss was due to a lack of
        childcare, twice the rate of men surveyed. A more recent survey shows the losses
        have not slowed down: between February and August mothers of children 12
        years old and younger lost 2.2 million jobs compared to 870,000 jobs lost among
        fathers.”
                - Bateman, Nicole and Ross, Martha. Why has COVID-19 been especially
        harmful for working women? Brookings. October 2020.

EBRPRU COVID-19 Recovery Strategy

EBRPU partners are preparing for continued COVID-19-impactsed and post-COVID-19
scenarios. The Region does not want to develop plans with potentially obsolete or inaccurate
data or in a state of great uncertainty. This exploratory work could include: strategies for surge
occupation recruitment, response to regional layoffs, and business engagement and support. It
could also include re-envisioning service delivery strategies, updating Board policies,
streamlining service delivery, and expanding virtual capacity. All of the above would be
considered through an equity lens, ensuring access for priority populations, with particular
emphasis on quality jobs and the training pathways and supports necessary for success in the
evolving labor market.
This work would more likely begin in the latter part of the first -year of 2021-2024 Regional Plan
implementation based upon the state of public health measures and of the economy. The region
does not want to develop plans with potentially obsolete or inaccurate data or in a state of great
uncertainty. The beginning of this exploratory work could includeWhen it does, it could begin
with convenings of EBRPU partner Board Directors to develop priorities, a potential scope of
work, and outcomes to put out for procurement, contract piggy-backing, or sole-sourcing, as
appropriate, to project manage this activity.

This initial activity would help the Region achieve the Regional Plan objective of developing
regional COVID-19 recovery strategies that are aligned with external developments and are most
likely to succeed.

1.b. Overview
As of the 2019 census, the East Bay Region had a population of 2,799,005 (1,656,754 in
Alameda, 1,142,251 in Contra Costa).18 Homelessness in the East Bay has been increasing in
recent years: in 2019, 8,022 individuals were experiencing homelessness in Alameda County

16 “May Jobs Report: A Case Study in Pervasive Racism and Sexism,” TIME’S UP Impact Lab: Women on the Front
Lines, June 8, 2020, https://timesupfoundation.org/may-jobs-report-a-case-study-in-pervasive-racism-and-sexism/
17 André Dua, Kweilin Ellingrud, Michael Lazar, Ryan Luby, Sanjay Srinivasan, and Tucker Van Aken "Achieving an

Inclusive US Economic Recovery," McKinsey & Company, February 3, 2021,
https://www.mckinsey.com/industries/public-and-social-sector/our-insights/achieving-an-inclusive-us-economic-
recovery
18 "ACS Demographic and Housing Estimates," United States Census Bureau, 2018,

https://data.census.gov/cedsci/table?q=dp05&g=0500000US06001,06013&tid=ACSDP5Y2019.DP05&hidePreview
=false

                                                 Page 6 of 51
East Bay Regional Planning Unit
                                                                                   Regional Plan 2021-2024

(compared to 4,040 in 2015 and 5,629 in 2017).19 In 2020, 2,277 individuals experienced
homelessness in Contra Costa (compared to 1,730 in 2016, 1,607 in 2017, and 2,234 in 2018).20,
21

In the Bay Area as a whole, almost 3 out of every 5 workers are people of color.22 Among the
emerging workforce (workers 25 years or younger), 70% are people of color. The largest
emerging demographic group is Lantinx workers, who will soon comprise 33% of the Bay Area
workforce.

Educational and Skill Levels of the Workforce
Residents of the East Bay have a relatively high level of educational attainment when compared
to the state as a whole. In Alameda County, 50.6% residents 25 years old or older have a
bachelor’s degree or higher.23 The comparable statistic for Contra Costa County is 43.0%. This is
significantly above the 35.0% of people 25 years and older statewide who have a bachelor’s
degree or higher. At the other end of the spectrum, 27.7% of residents of Alameda County aged
25 and older had a high school education of less, as did 28.8% of Contra Costa County residents
in this age group. The percentage for the state as a whole is 36.6%.

These relatively high levels of educational attainment for the region as a whole do not reflect the
substantial educational challenges faced by communities in Hayward, Oakland, Richmond, and
East Contra Costa County. As shown in the images below, educational attainment in the Bay
Area varies considerably in different geographic locations within the counties and within the
cities.

19 “Alameda County Homeless Count & Survey,” Applied Survey Research, 2019: 1-87,
https://homelessness.acgov.org/homelessness-assets/docs/2019AlamedaCountyHomelessCountReport.pdf
20 “Contra Costa County: Annual Point in Time Count Report” Contra Costa Health Housing & Homeless Services,

August 2020: 1-47, https://cchealth.org/h3/coc/pdf/PIT-report-2020.pdf
21 Contra Costa, “Annual Point in Time Count Report” . https://cchealth.org/h3/coc/pdf/PIT-report-2020.pdf
22 All the data in this paragraph is from Abbie Langston, Edward Muña, and Matthew Walsh,“Advancing Workforce

Equity in The Bay Area: A Blueprint for Action,” Rework The Bay, 20, Accessed February 22 2021,
https://reworkthebay.org/wp-content/uploads/2021/01/Advancing-Workforce-Equity-in-the-Bay-
Area_FINAL_0.pdf
23 All data in this paragraph is from "American Community Survey: Educational Attainment For The Population 25

Years And Over," United States Census Bureau, August 26, 2020,
https://data.census.gov/cedsci/table?q=American%20Community%20survey%20Table%20B15002&g=0500000US
06001,06013&tid=ACSDT1Y2019.B15002&hidePreview=false

                                                 Page 7 of 51
East Bay Regional Planning Unit
Regional Plan 2021-2024
Figure 2. Percentage of Alameda County Residents with a High School Degree or
Less
Figure 3. Percentage of Contra Costa County Residents with a High School Degree
or Less
Page 8 of 51East Bay Regional Planning Unit
Regional Plan 2021-2024
Figure 4. 2019 Educational Attainment in the East Bay for Population Age
25 and Older24
Figure 5. 2019 Educational Attainment in Alameda and Contra Costa
County25
In the long term, the relatively low level of formal education in these communities poses a
particular challenge, considering 7 out of the top 10 fastest growing professions in the Bay Area
all require more than a high school diploma (see Table 10).26 Educational attainment in the Bay
24 United States Census Bureau, “Sex By Educational Attainment” .
https://data.census.gov/cedsci/table?q=American%20Community%20survey%20Table%20B15002&g=0500000US
06001,06013&tid=ACSDT1Y2019.B15002&hidePreview=false
25 United States Census Bureau, “Sex By Educational Attainment” .
https://data.census.gov/cedsci/table?q=American%20Community%20survey%20Table%20B15002&g=0500000US
06001,06013&tid=ACSDT1Y2019.B15002&hidePreview=false
26 Employment Projections: 2016-2026 Local Employment Projections Highlights,” Employment Development
Page 9 of 51East Bay Regional Planning Unit
Regional Plan 2021-2024
Area varies considerably by race and ethnicity. For example, of individuals ages 25 - 64, more
than 60% of Asian or Pacific Islanders have a Bachelor's Degree compared to 29% of the Black
population and less than 28% of the Latinx population.27 These educational disparities depict a
critical challenge to achieving equity in the workforce.
Table 2. Bay Area Resident Education by Race
Bay Area Residents with a High School Diploma
or Less28
Race Percentage with HS
Diploma or Less
Asian or Pacific Islander 21%
Immigrant
Asian or Pacific Islander 12%
U.S.-born
Black 31%
Lantinx Immigrant 71%
Lantinx U.S.-born 37%
Native American 40%
White 14%
Workforce Age
In the East Bay, 1,886,664 people (67.9%) are of “working age,” between 15 and 64 years old.
There are 172,120 additional individuals (6.1%,) between the ages of 10 to 14, who will likely
enter the workforce in the near future.29 Figure 6 demonstrates the share of the East Bay
population by age group.
Department State of California, accessed February 22, 2021
https://www.labormarketinfo.edd.ca.gov/data/employment-projections.html
27 Abbie Langston, Edward Muña, and Matthew Walsh,“Advancing Workforce Equity in The Bay Area: A Blueprint for
Action,” Rework The Bay, 28, Accessed February 22 2021, https://reworkthebay.org/wp-
content/uploads/2021/01/Advancing-Workforce-Equity-in-the-Bay-Area_FINAL_0.pdf
28 Langston, Muña, and Walsh,“Advancing Workforce Equity,” 28 . https://reworkthebay.org/wp-
content/uploads/2021/01/Advancing-Workforce-Equity-in-the-Bay-Area_FINAL_0.pdf
29 "American Community Survey Demographic and Housing Estimates: 5-Year Estimates Data Profile ," United States
Census Bureau, 2018,
https://data.census.gov/cedsci/table?q=dp05&g=0500000US06001,06013&tid=ACSDP5Y2018.DP05&hidePreview
=false
Page 10 of 51East Bay Regional Planning Unit
Regional Plan 2021-2024
Figure 6. Age of East Bay Population30
Cost of Living
The annual cost of living for a family of two adults and two children in Alameda County is
$121,922 in Alameda County, and $125,672 in Contra Costa County. In the East Bay, housing
constitutes the largest expenditure in a family’s budget. Before the COVID-19 pandemic, child
care constituted 15% of the cost of living budget. Due to the pandemic, many working families
can no longer rely on traditional child care options, which has likely impacted child care
expenses. While the portion of the cost of living devoted to transportation has likely declined for
better-off workers who have been able to work from home, transportation remains a substantial
cost for lower income workers who do not have this option. This is particularly true for those
who have had to relocate farther from their place of employment in search of more affordable
housing.31 Table 3 below shows the breakdown in the annual cost of living for a typical family in
Alameda and Contra Costa Counties.
Table 3. Annual Cost of Living for a Family in Alameda & Contra Costa Counties32
% of Total % of Total
Alameda Cost of Contra Costa Cost of
Costs County Living County Living
Housing $27,525 22.58% $28,713 22.85%
Food $10,959 8.99% $10,443 8.31%
Child Care $17,984 14.75% $18,440 14.67%
Transportation $14,679 12.04% $15,922 12.67%
Health Care $13,228 10.85% $12,953 10.31%
30 United States Census Bureau, " Demographic and Housing Estimates” .
https://data.census.gov/cedsci/table?q=dp05&g=0500000US06001,06013&tid=ACSDP5Y2018.DP05&hidePreview
=false
31 “Family Budget Calculator” Family Budget Map, Economic Policy Institute, last modified March, 2018,
https://www.epi.org/resources/budget/
32 “Family Budget Calculator” Family Budget Map, Economic Policy Institute, last modified March, 2018,
https://www.epi.org/resources/budget/
Page 11 of 51East Bay Regional Planning Unit
Regional Plan 2021-2024
% of Total % of Total
Alameda Cost of Contra Costa Cost of
Costs County Living County Living
Other
Necessities $15,526 12.73% $15,797 12.57%
Taxes $22,021 18.06% $23,405 18.62%
Total $121,922 100.00% $125,672 100.00%
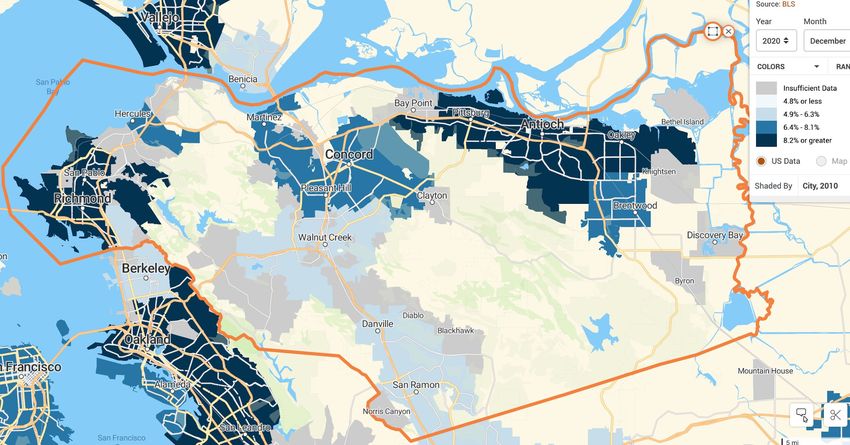
High Housing Cost
The very large number of households in the East Bay whose incomes fall below the cost of
living identified in the table above are required to spend an unmanageable portion of their
income on housing. When a household spends 30% or more of its income on housing costs, it is
considered housing burdened. Much of the East Bay is overburdened by housing costs. Almost
all of the East Bay has households that are housing burdened, however, specific geographic
locations (as shown in the maps below, developed from recent data from the U.S. Census) have
much higher percentages of their communities that are considered housing burdened.
Figure 7. Alameda Homeowners Burdened by Housing Costs (Census 2015 - 19)
As the maps indicate, the western portion of Alameda County is home to communities that are
experiencing housing burden, specifically portions of the cities of Berkeley, Hayward, and
Oakland. In contrast, the areas in Contra Costa County with the highest percentage of their
community burdened by housing costs are scattered throughout the county.
Page 12 of 51East Bay Regional Planning Unit
Regional Plan 2021-2024
Figure 8. Contra Costa Homeowners Burdened by Housing Costs (Census 2015 - 19)
Workforce Household Income
Cost of living for a two-adult and two-child household exceeds the median household income in
both Alameda ($121,922 cost of living compared to $92,574 income) and Contra Costa
($125,672 compared to $93,712).33,34,35 Many households in the East Bay earn much less than
the national median income ($68,703 in 2019).36 Nearly one quarter of households in Alameda
and Contra Costa Counties had an income between $10,000 and $49,999. In addition, both
counties have a sizable number of households making less than $10,000 per year (4.2% in
Alameda and 3.5% in Contra Costa).37 Further detail is provided in Figure 9 below. In the State
of California, minimum wage is $13.00 per hour for employers with 25 or less employees and is
$14.00 per hour for employers with 26 or more employers.38
33 “Family Budget Calculator” Family Budget Map, Economic Policy Institute, last modified March, 2018,
https://www.epi.org/resources/budget/
34 Jessica Semega, Melissa Kollar, Emily A. Shrider, and John Creamer, "Income and Poverty in the United States:
2019" United States Census Bureau, September 15, 2020,
https://www.census.gov/library/publications/2020/demo/p60-
270.html#:~:text=Median%20household%20income%20was%20%2468%2C703,and%20Table%20A%2D1).
35 "Income in the Past 12 Months (In 2018 Inflation-Adjusted Dollars): 2018: ACS 5-Year Estimates Subject Tables,"
United States Census Bureau, 2018,
https://data.census.gov/cedsci/table?q=S1901&g=0500000US06001,06013&tid=ACSST5Y2018.S1901&hidePreview
=false
36 Jessica Semega, Melissa Kollar, Emily A. Shrider, and John Creamer, "Income and Poverty in the United States:
2019" United States Census Bureau, September 15, 2020,
https://www.census.gov/library/publications/2020/demo/p60-
270.html#:~:text=Median%20household%20income%20was%20%2468%2C703,and%20Table%20A%2D1).
37 United States Census Bureau "Income in the Past 12 Months” .
https://data.census.gov/cedsci/table?q=S1901&g=0500000US06001,06013&tid=ACSST5Y2018.S1901&hidePreview
=false
38 “State Minimum Wage Laws,” Wage and Hour Division, U.S. Department of Labor, last modified January 1, 2021,
https://www.dol.gov/agencies/whd/minimum-wage/state#ca
Page 13 of 51East Bay Regional Planning Unit
Regional Plan 2021-2024
Figure 9: Proportion of the Population at Different Income Levels in the East Bay
The technology boom of recent decades brought dramatic changes to the San Francisco Bay
Area. However, from 1990 to 2018, the Bay Area experienced incredible job growth, the highest
of which was for low-wage jobs (50% compared to 38% for high-wage and 25% for middle-).39
However, during this same period, increases in total earnings for low- and middle-wage workers
(51% and 44%, respectively) significantly lagged behind those for high-wage workers (149%).40
During this same period, . 41 Though the number of low-wage jobs grew faster than the number
in other categories, the wages for those jobs increased at just one third of the rate for high-wage
jobs, raising significant questions about entrenched injustice within the region’s economy.
There are multiple factors that are currently contributing to an economic crisis for lower income
workers in the East Bay. These include: an extraordinarily high cost of living, including an
inordinate amount of income spent on housing; and growing commutes for workers who have
relocated in search of lower housing costs. These burdens have fallen most heavily on
communities of color, which are disproportionately represented among lower income workers.
For this reason, racial equity and economic justice must continue to be key reference points for
the creation of workforce development strategies for the region.
Poverty
The rate of residents living in poverty in the East Bay (8.47%) is considerably lower than the
national average (12.3%); however, these figures do not account for the high costs of living in the
East Bay compared to the rest of the nation (see Cost of Living above). The federal poverty line
39 Langston, Muña, and Walsh,“Advancing Workforce Equity,” 24 . https://reworkthebay.org/wp-
content/uploads/2021/01/Advancing-Workforce-Equity-in-the-Bay-Area_FINAL_0.pdf
40 Ibid.
41 Langston, Muña, and Walsh,“Advancing Workforce Equity,” 24 . https://reworkthebay.org/wp-
content/uploads/2021/01/Advancing-Workforce-Equity-in-the-Bay-Area_FINAL_0.pdf
Page 14 of 51East Bay Regional Planning Unit
Regional Plan 2021-2024
does not take into account geographic differences in the costs associated with housing,
transportation, child care, or medical costs, for example.42
In the Bay Area as a whole, nearly 60% of Black women renters and more than 50% of Latinx
women renters “are both housing-cost burdened (meaning they spend more than 30 percent of
their income on housing) and economically insecure (meaning they have family incomes below
200 percent of the federal poverty level). This is more than double the rate for white male
renters.”
Employment is a major protective factor against poverty. Therefore, workforce development
initiatives that enable unemployed individuals to secure employment should be viewed as a
major anti-poverty strategy in the region. Figure 10 indicates the poverty rate for unemployed
East Bay residents in contrast with that of employed residents.
Figure 10. Poverty Rates for Employed and Unemployed Individuals in the East
Bay
3.56% of employed 20.55% of unemployed
East Bay residents live in poverty43 East Bay residents live in poverty44
The above findings are particularly relevant during the current economic crisis. For low-wage
workers (those earning less than $27,000 per year), the employment rate from January to
October 2020 decreased by 22% in Alameda and 33% in Contra Costa. This is in contrast to only
a 0.9% decrease for high-wage workers (those earning more than $60,000) in Alameda and a
0.1% increase in employment for high-wage workers in Contra Costa.45 The threat of
unemployment makes already disadvantaged low-wage workers even more susceptible to falling
into or falling further into poverty.
Poverty among Black residents of the East Bay is 3 times the rate for white residents, while
poverty among the Latinx East Bay community is 1.8 times the rate for those who are white.
42 Areeba Haider, Justin Schweitzer, “The Poverty Line Matters, But It Isn’t Capturing Everyone It Should,” Center
for American Progress, March 5, 2020
https://www.americanprogress.org/issues/poverty/news/2020/03/05/481314/poverty-line-matters-isnt-capturing-
everyone/
43 “Poverty Status in the Past 12 Months: 2019: ACS 1-year Estimates Subject Tables” The United States Census
Bureau, 2019,
https://data.census.gov/cedsci/table?q=poverty&g=0500000US06001,06013&tid=ACSST1Y2019.S1701&hidePrevie
w=false
44 United States Census Bureau, “Poverty Status” .
https://data.census.gov/cedsci/table?q=poverty&g=0500000US06001,06013&tid=ACSST1Y2019.S1701&hidePrevie
w=false
45 Langston, Muña, and Walsh,“Advancing Workforce Equity,” 39 . https://reworkthebay.org/wp-
content/uploads/2021/01/Advancing-Workforce-Equity-in-the-Bay-Area_FINAL_0.pdf
Page 15 of 51East Bay Regional Planning Unit
Regional Plan 2021-2024
Among all census-designated race categories, whites have the lowest poverty rate. Table 4 below
provides the most recent census data by race for residents of Alameda and Contra Costa
Counties.
Table 4. Poverty Rates by Race in the East Bay (2019)46
Alameda County Contra Costa County Combined
Race
Number Percent Number Percent Number Percent
By Census Race Category
American Indian and
1,180 9.60% NA NA NA NA
Alaska Native
Asian 35,178 6.90% 10,270 5% 45,448 6.34%
Black or African
33,881 19.30% 14,771 14.8% 48,652 17.68%
American
Native Hawaiian and
797 6% N/A N/A N/A N/A
Other Pacific Islander
Two or More Races 7,546 7.20% 5,349 7.4% 12,895 7.32%
White 39,280 6.20% 33,500 5.6% 72,780 5.90%
Other Race 27,699 14.70% 25,816 16.1% 53,515 15.32%
By Hispanic or Latino Ethnicity (as defined by the Census)
Hispanic or Latino 37,577 10.30% 34,202 11.5% 71,779 10.84%
Not Hispanic or Latino 107,984 8.45% 56,306 6.66% 164,290 7.73%
1.c. Labor Force
Unemployment
As of October 2020, the East Bay region had a slightly lower rate of unemployment (7.9% in
both Alameda and Contra Costa County) than the state as a whole (9%). The region’s
unemployment rate more than doubled since March 2020 when it was 3.9%.47 According to a
national Federal Reserve analysis, COVID-19-caused unemployment is disproportionately
impacting workers in the lowest wage quartile.48 Wage earners in the lowest quartile are
experiencing unemployment above 20%, compared to less than 5% for the highest-wage earners.
46United States Census Bureau, “Poverty Status” .
https://data.census.gov/cedsci/table?q=poverty&g=0500000US06001,06013&tid=ACSST1Y2019.S1701&hidePrevie
w=false
47“East Bay Economic Outlook 2020,” East Bay Economic Development Alliance, published May 21, 2020,
https://drive.google.com/file/d/1mB3T8vx56GPxjlonuspUipFvEnvDvpdI/view
48All of the following data is from Lael, Brainard, speech on full employment in the new monetary policy framework,
January 13, 2021. https://www.federalreserve.gov/newsevents/speech/brainard20210113a.htm
Page 16 of 51East Bay Regional Planning Unit
Regional Plan 2021-2024
White unemployment rates nationwide are at 6%, while Latinx unemployment is 9.3% and Black
unemployment is 9.9%. Table 5 provides a snapshot of employment in Alameda and Contra
Costa Counties.
Table 5. October 2020 East Bay Labor Force49
County Labor Force Employment Unemployment Unemployment
Rate
Alameda 830,900 765,400 65,500 7.9%
Contra 552,600 508,900 43,700 7.9%
Costa
In an article published in June of 2020, the U. S. Bureau of Labor Statistics acknowledged that
the published national unemployment rate of 13.3% for May of that year was actually closer to
16.4%50 It is likely that the unemployment rates identified above are even higher than estimated
due to this misclassification.
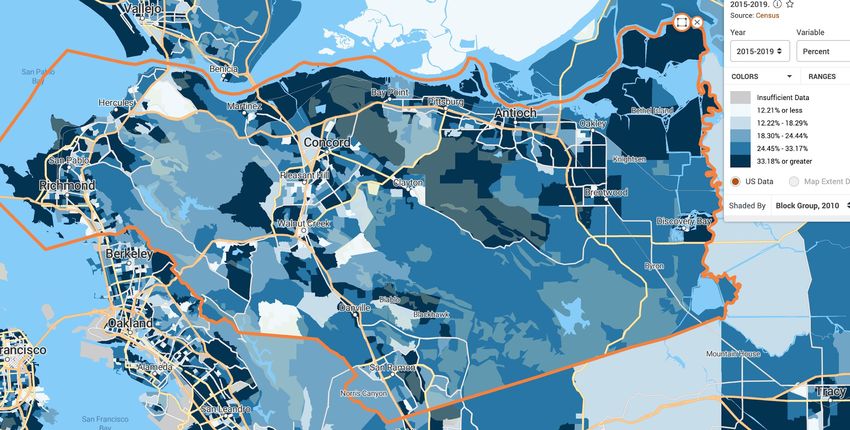
Although the East Bay Region has a lower rate of unemployment than does California, cities
within the region have higher rates than the state as a whole. In Alameda County, the highest
rates of unemployment are concentrated in the cities of Hayward, Oakland, and San Leandro.
Historically, certain ZIP Codes within Oakland and Hayward in Alameda County, and Richmond
and Pittsburg in Contra Costa County have experienced disproportionately high levels of
unemployment compared to the surrounding region. It is likely that these communities have
continued to experience extremely high rates of unemployment during the economic crisis
sparked by the pandemic.
The maps that follow provide a sense of the distribution of unemployment across each county in
the East Bay region.
49 “Monthly Labor Force Data for Counties, October 2020 - Preliminary,”Employment Development Department:
Labor Market Information Division, published November 20, 2020,
https://docs.google.com/spreadsheets/d/1boqhAzDjtefSsxi1sTUijeJDEL_CTO1i/edit#gid=175580821
50 Update on the Misclassification that Affected the Unemployment Rate, U.S. Bureau of Labor Statistics, June 29,
2020 https://blogs.bls.gov/blog/2020/06/29/update-on-the-misclassification-that-affected-the-unemployment-
rate/
Page 17 of 51East Bay Regional Planning Unit
Regional Plan 2021-2024
Figure 11: Alameda County Unemployment Rates: December 2020
In Contra Costa County, the highest rates of unemployment are in the cities of Richmond,
Pittsburg, Antioch, and Oakley.
Figure 12. Contra Costa County Unemployment Rates: December 2020
Page 18 of 51East Bay Regional Planning Unit
Regional Plan 2021-2024
Although the unemployment rates the number of “people who are jobless, looking for a job, and
available for work” is an important indicator of a regional workforce, it is also important to
consider the labor force participation rate, which provides the “percentage of the population [16
years old and over] either working or actively seeking work.”51, 52 In other words, those not
counted in the labor force participation rate are, for whatever reason, not participating in the
labor force. Along with the 7.9% of unemployed people who are actively looking for work in the
East Bay, 32.9% of individuals over the age of 16 in Alameda and 35.2% in Contra Costa have
chosen not to participate in the labor market. These numbers are even higher for individuals
who are living in poverty, of whom more than half have dropped out of the labor market. As
presented in Table 6 below, education appears to be a major protective factor against leaving the
labor market, as 34.6% of individuals in Alameda County with less than a high school diploma
have dropped out of the labor force compared to only 13% with a bachelor’s degree or more. The
numbers are similar for Contra Costa County (32.1% and 15.3%, respectively).53
Table 6. East Bay Labor Force Participation Rate 201954
Alameda Contra Costa California
County County
Over Age 16 67.1% 64.8% 63.7%
Under Poverty 45.5% 49.5% 48.5%
< High School Graduate 65.4% 67.9% 65.5%
High School Graduate 75.0% 74.2% 73.1%
Some College or Associates 80.0% 79.2% 73.1%
Bachelor's Degree or Higher 87.0% 84.7% 85.8%
In November 2020, approximately eight months into the COVID-19 pandemic, the labor force
participation rate for California as a whole was 60.5% (39.5% not participating).55 According to a
national Federal Reserve analysis released in January 2021, “labor force participation for prime-
age workers has declined, particularly for parents of school-aged children, where the declines
have been greater for women than for men, and greater for Black and Hispanic mothers than for
White mothers.”56 These statistics demonstrate that the pandemic has not only worsened
51 “How the Government Measures Unemployment: What are the basic concepts of employment and unemployment?”
U.S. Bureau of Labor Statistics, last modified October 8, 2015, https://www.bls.gov/cps/cps_htgm.htm
52 U.S. Bureau of Labor Statistics, ““How the Government Measures Unemployment” .
https://www.bls.gov/cps/cps_htgm.htm
53 “Employment Status: ACS 5-Year Estimates Subject Table,” U.S. Census Bureau, 2019
https://data.census.gov/cedsci/table?q=s2301&g=0400000US06_0500000US06001,06013&tid=ACSST5Y2019.S2
301&hidePreview=false
54 U.S. Census Bureau, “Employment Status” .
https://data.census.gov/cedsci/table?q=s2301&g=0400000US06_0500000US06001,06013&tid=ACSST5Y2019.S2
301&hidePreview=false
55 “Labor Force Participation Rate for California [LBSNSA06],” U.S. Bureau of Labor Statistics, retrieved from
Federal Reserve Bank of St. Louis, February 22, 2021. https://fred.stlouisfed.org/series/LBSNSA06
56 Lael, Brainard, speech on full employment in the new monetary policy framework, January 13, 2021.
https://www.federalreserve.gov/newsevents/speech/brainard20210113a.htm
Page 19 of 51East Bay Regional Planning Unit
Regional Plan 2021-2024
unemployment, but has potentially forced additional people out of the labor force altogether,
creating additional strain on communities and municipal services.
Prior to the pandemic (as shown in Table X below), although youth unemployment in the East
Bay was lower than the unemployment rate for the state as a whole, Alameda County was facing
lower rates of youth labor force participation than the rest of California. In Alameda, 70.5% of 16
to 19 year-olds and only 32.2% of 20 to 24 year-olds were participating in the labor market.
Table 7. Youth Unemployment and Labor Force Participation Rate 201957
Labor Force Participation Unemployment
Age Alameda Contra California Alameda Contra California
Costa Costa
16 - 19 29.5% 37% 31% 11.2% 15.6% 18.44%
20 - 24 67.8% 76% 72.7% 7.9% 5.3% 9.2%
1.d. Industry and Occupational Demand
Job Openings
Likely impacted by the pandemic, the total number of jobs in the East Bay Region decreased by
10.5% from October 2019 to October 2020. The leisure and hospitality industry was particularly
impacted during that time period, losing 36,700 (30.4%) jobs.58 Table 8 below demonstrates....
Table 8. Total Employers, Employees and Payroll for the East Bay Region and
California59
Area Total Employer Total Employees Total Annual
Establishments Payroll ($1,000)
Alameda 40,508 698,915 $51,985,434
Contra Costa 24,286 340,960 $23,960,119
California 954,632 15,223,664 $1,020,958,926
While there has been a decrease in the region’s total number of jobs, the East Bay region still has
job openings in a variety of industries. Considering the larger percentage of the population with
a low level of formal education (see Workforce Education section above), it might be
encouraging that the top 10 occupations with the most projected job openings between 2016 and
57 “Employment Status: ACS 5-Year Estimates Subject Table [ Table S2301],” U.S. Census Bureau, 2019
https://data.census.gov/cedsci/table?q=s2301&g=0400000US06_0500000US06001,06013&tid=ACSST5Y2019.S2
301&hidePreview=false
58 Employment Development Department,“Monthly Labor Force Data” .
https://docs.google.com/spreadsheets/d/1boqhAzDjtefSsxi1sTUijeJDEL_CTO1i/edit#gid=175580821
59 “COVID-19 Demographic and Economic Resources: US Demographic and Economic Data At A Glance,” U.S.
Census Bureau COVID-19 Site, last modified January 1, 2021, https://covid19.census.gov/
Page 20 of 51East Bay Regional Planning Unit
Regional Plan 2021-2024
2026 only require a high school diploma or less. However, as shown in Table 9 below, none of
these occupations provide wages comparable to the median income ($92,574 in Alameda and
$93,712 in Contra Costa). Personal care aides were projected to have the most job openings,
followed by food workers, cashiers, retail salespersons, and waiters and waitresses. Due to the
impact on both the leisure and hospitality and retail industries from the pandemic, it is possible
that the demand for these positions will be impacted, at least in the short term future. Out of the
occupations with the most projected job openings, personal care aides are the lowest paid
($24,707 median annual wage) and customer service representatives are the highest ($41,998).
Table 9. East Bay Job Openings by Occupation 2016 - 202660,61
Occupational Title Qualifications Total Median Median
Projected Hourly Annual Wage
Job Wage
Openings
Personal Care Aides High School diploma 82,800 $11.88 $24,707
or equivalent
Combined Food No credential required 51,000 $12.18 $25,325
Preparation and Serving
Workers, Including Fast
Food
Cashiers No credential required 47,950 $12.46 $25,909
Retail Salespersons No credential required 40,880 $12.92 $26,880
Waiters and Waitresses No credential required 32,740 $13.06 $27,166
Laborers and Freight, No formal educational 29,150 $15.63 $32,497
Stock, and Material credential
Movers, Hand
Office Clerks, General High School diploma 27,490 $18.24 $37,934
or equivalent
Stock Clerks and Order High School diploma 22,540 $13.52 $28,128
Fillers or equivalent
Janitors and Cleaners, 22,150 $16.75 $34,829
Except Maids and No credential required
Housekeeping Cleaners
Customer Service High School diploma 21,270 $20.20 $41,998
Representatives or equivalent
60 “Employment Projections: 2016-2026 Local Employment Projections Highlights,” Employment Development
Department State of California, accessed February 22, 2021
https://www.labormarketinfo.edd.ca.gov/data/employment-projections.html
61 Updated projections that consider the impact of COVID and recovery efforts may look different.
Page 21 of 51East Bay Regional Planning Unit
Regional Plan 2021-2024
COVID-19 Impact on Job Openings in the East Bay
In contrast to the projections (2016 to 2026) presented above, the San Francisco Bay Center of
Excellence for Labor Market Research examined job postings over an eight-month period during
the pandemic (March through October 2020). This analysis is reflected in the charts below,
which show the types of low-level and mid-level skill jobs in the East Bay with the most job
openings over this period on average. Middle-skill jobs are defined as jobs “that require more
education and training than a high school diploma but less than a four-year college degree.”62 Of
the 25 jobs they recorded the most postings for, 19 are considered to require only low- or
middle-level skills. Although the “Laborer / Warehouse” worker was the leading job in terms of
the number of postings during the period (1,961), the second most prevalent was “Software
Developer / Engineer” (1,128), which is considered a high-skill job.63 Overall, low-skill jobs
appear to be more resilient during the COVID-19 pandemic than middle skills jobs, with 7,199
low skill job postings versus 4,466 middle skill job postings in the region.
Many similar occupations projected to have the most job openings in the table above are also
proving to be resilient during the pandemic, as indicated in the chart below. The “Laborer /
Warehouse” occupation, which likely corresponds with the category of “Laborers and Freight,
Stock, and Material Movers, Hand” is the most resilient occupation during the pandemic and
was also projected to be the occupation with the 6th most openings between 2016 and 2026.
Personal care aides were the most projected occupation before the pandemic and are still very
prevalent in the region, ranking seventh most common in the Excellence for Labor Market
Research’s analysis. Considering the extra demand for cleanliness and sanitation caused by the
public health crisis,64 it is particularly noteworthy that “Janitors and Cleaners, Except Maids and
Housekeeping Cleaners,” which ranked number nine in the projection, does not even appear in
the most COVID resilient list. Many of these positions may have experienced a reduced demand
because employees are now working from home instead of in office buildings. This is one
occupation that could rebound in the near future, especially as workers return to the workplace
while the pandemic continues. “Sales Delivery Driver” makes an appearance on the most
resilient list, but was not projected at all before the pandemic, which is likely the result of the
increasing number of Americans buying goods online during the pandemic.65
62 “Research: Middle Skills,” Harvard Business School, accessed February 22, 2021
https://www.hbs.edu/competitiveness/research/Pages/middle-skills.aspx
63“San Francisco Bay Center of Excellence for Labor Market Research,” San Francisco Bay Region: LMI News &
Updates, published December, 2020 https://sites.google.com/baccc.net/coe
64 Dan Biewener, “Janitorial Services Face Explosive Demand Due to COVID-19. Are You Ready?” Fundbox, March
24, 2020 https://fundbox.com/blog/covid-19-janitorial-demand-rise/
65 “Exclusive Data: Twenty-Five Percent of Consumers Say Retail, Online Grocery Digital Shift Will Stick” PYMNTS,
June 4, 2020 https://www.pymnts.com/coronavirus/2020/the-great-reopening-doubling-down-on-digital-
coronavirus-ecommerce-contactless/
Page 22 of 51East Bay Regional Planning Unit
Regional Plan 2021-2024
Figure 13: Low-Skill Job Openings March to November 2020
Overall, middle skill jobs comprised 5 out of the top 10 job postings during the pandemic.66
“San Francisco Bay Center of Excellence for Labor Market Research,” San Francisco Bay Region: LMI News &
66
Updates, December, 2020, https://sites.google.com/baccc.net/coe
Page 23 of 51East Bay Regional Planning Unit
Regional Plan 2021-2024
Figure 14: Middle-Skill Job Openings March to November 2020
Software Developer / Engineer was the only high-skill job in the top 10 job posting.67
Figure 15: High Skill Job Openings March to November 2020
Fastest Growing Occupations
Looking forward, wages for the fastest growing occupations are much higher compared to wages
for the current most common jobs. Although many of the fastest growing occupations only
67“SanFrancisco Bay Region: The Labor Market in 2020,” Centers of Excellence for Labor Market Research, accessed
March 1, 2021, https://sites.google.com/baccc.net/coe
Page 24 of 51East Bay Regional Planning Unit
Regional Plan 2021-2024
require at the most an Associates or postsecondary non-degree award, educational requirements
for these occupations are substantially higher than the current most common occupations,
which only require at most a high school education. Table 10 below demonstrates the wages for
the region’s fastest growing occupations. Across these 10 occupations, the average median wage
(excluding Medical and Clinical Laboratory Technicians) is $40,263.
Table 10. East Bay Fastest Growing Occupations (2016 - 2026)68
Occupation Qualifications Change Median Median
Hourly Wage Annual Wage
Solar Photovoltaic Installers High school
diploma or 120.80% $18.94 $39,401
equivalent
Cabinetmakers and Bench High school
Carpenters diploma or 50.90% $17.90 $37,237
equivalent
Diagnostic Medical Associate's degree
42.90% $48.02 $99,881
Sonographers
Medical Assistants Postsecondary non-
38.30% $18.89 $39,283
degree award
Emergency Medical Postsecondary non-
37.60% $19.35 $40,263
Technicians and Paramedics degree award
Surgical Technologists Postsecondary non-
34.90% $31.19 $64,868
degree award
Respiratory Therapists Associate's degree 33.60% $41.68 $86,711
Medical and Clinical Associate's degree
33.00% NA NA
Laboratory Technicians
Home Health Aides High school
diploma or 32.80% $13.20 $27,454
equivalent
Magnetic Resonance Imaging Associate's degree
31.10% $41.55 $86,426
Technologists
Middle-Skill Jobs
Middle-skill jobs, “those that require more education and training than a high school diploma
but less than a four-year college degree”69 are abundant in the East Bay region. The region’s
68 “Employment Projections: 2016-2026 Local Employment Projections Highlights,” Employment Development
Department State of California, accessed February 22, 2021
https://www.labormarketinfo.edd.ca.gov/data/employment-projections.html
69 “Research: Middle Skills,” Harvard Business School, accessed February 22, 2021
https://www.hbs.edu/competitiveness/research/Pages/middle-skills.aspx
Page 25 of 51East Bay Regional Planning Unit
Regional Plan 2021-2024
large number of people with some college experience or an associate’s degree have plenty of
potential job opportunities. Table 11 below provides job opening information for the Bay Area as
a whole. The occupation title category of bookkeeping, accounting, and auditing clerks have the
most job openings out of the region’s top 20 occupations with the most openings and the ninth
highest wages ($54,468). is the average median annual wage across the top 20 middle skill
occupations which have the most job openings in the East Bay occupations is $51,412.
Table 11. Bay Area Top 20 Middle Skill Occupations By Total Job Openings
(2016-2026)70
Occupational Title Total Projected Median Median
Openings Hourly Annual
Wage Wage
Bookkeeping, Accounting, and Auditing 14,825 $26.19 $54,468
Clerks
Teacher Assistants 13,662 NA $39,704
Nursing Assistants 11,265 $19.88 $41,351
Heavy and Tractor-Trailer Truck Drivers 10,355 $23.82 $49,548
Medical Assistants 8,959 $22.18 $46,139
Preschool Teachers, Except Special 5,308 $20.31 $42,239
Education
Dental Assistants 5,113 $21.65 $45,039
Automotive Service Technicians and 5,035 $25.62 $53,276
Mechanics
Computer User Support Specialists 4,435 $33.93 $70,576
Licensed Practical and Licensed Vocational 4,426 $32.50 $67,595
Nurses
Manicurists and Pedicurists 4,373 $13.41 $27,894
Hairdressers, Hair Stylists, and 3,991 $15.02 $31,244
Cosmetologists
Paralegals and Legal Assistants 2,575 $29.59 $61,552
Massage Therapists 2,532 $23.36 $48,598
Telecommunications Equipment Installers 2,353 $33.05 $68,738
and Repairers, Except Line Installers
Electrical and Electronics Engineering 2,301 $31.25 $64,990
Technicians
Heating, Air Conditioning, and 2,041 $34.18 $71,110
Refrigeration Mechanics and Installers
Web Developers 1,913 $47.08 $97,923
Emergency Medical Technicians and 1,833 $17.00 $35,349
Paramedics
Computer Network Support Specialists 1,531 $38.97 $81,061
70“Employment Projections: Supply and Demand Tool,” Employment Development Department State of California,
accessed February 22, 2021, https://www.labormarketinfo.edd.ca.gov/geography/supply-and-demand-tool.html
Page 26 of 51You can also read