Eastern Creek Quarter - Stage 3 - Economic Impact Assessment - Major Projects
←
→
Page content transcription
If your browser does not render page correctly, please read the page content below
Eastern Creek Quarter – Stage 3
Economic Impact Assessment
PREPARED FOR
Frasers Property Retail Holdings Pty Ltd as trustee of the FPR (Eastern Creek No. 3) Trust

December 2020
Important Notice
© Macroplan Holdings Pty Ltd All Rights Reserved. No part of this document may be reproduced, transmitted,
stored in a retrieval system, or translated into any language in any form by any means without the written
permission of Macroplan Holdings Pty Ltd. All Rights Reserved. All methods, processes, commercial proposals
and   other   contents   described   in   this   document   are   the   confidential   intellectual   property   of
Macroplan Holdings Pty Ltd and may not be used or disclosed to any party without the written permission of
Macroplan Holdings Pty Ltd.

Macroplan staff responsible for this report:
Brian Haratsis, Executive Chairman
Ellis Davies, Principal – Retail
Adam Zhong, Senior Consultant
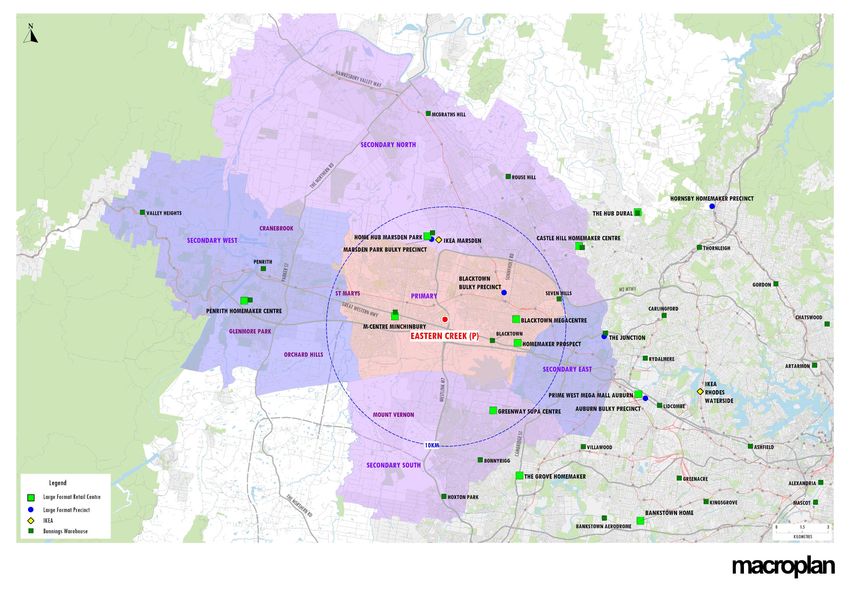
Table of contents

Executive summary...................................................................................................................................... 1

Introduction ................................................................................................................................................. 4

Section 1:              Site and development context............................................................................................. 5

                        1.1       Site and regional context .......................................................................................... 5

                        1.2       Planned development ............................................................................................... 9

Section 2:              Trade area analysis.......................................................................................................... 13

                        2.1       Trade area definition............................................................................................... 13

                        2.2       Trade area population ............................................................................................ 17

                        2.3       Socio-demographic profile ...................................................................................... 19

                        2.4       Retail expenditure .................................................................................................. 22

Section 3:              Competitive context.......................................................................................................... 25

Section 4:              Supportable factory outlet floorspace and centre sales potential ........................................ 30

                        4.1       Factory outlet retail floorspace demand analysis...................................................... 30

                        4.2       Assessment of sales potential ................................................................................. 34

Section 5:              Economic impact considerations....................................................................................... 35

                        5.1       Economic and social benefits.................................................................................. 35

                        5.2       Employment stimulus ............................................................................................. 37

                        5.3       Consideration of trading impacts ............................................................................. 38

                        5.5       Summary and net community benefit ...................................................................... 45

Appendix ................................................................................................................................................... 47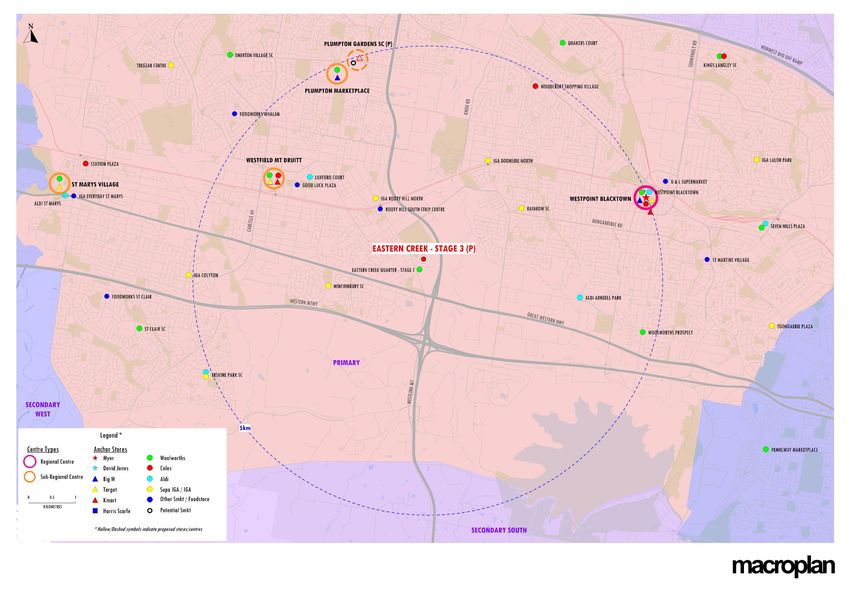
Executive summary

Site context
The 34 hectare Eastern Creek Quarter site is situated to the north of the Great Western Highway between Rooty Hill
Road South and the M7 Motorway. Church Street marks the site’s northern boundary. The site forms part of the
Western Sydney Parklands and is located within the Blacktown Local Government Area. It is located approximately
1.5 km south east of Rooty Hill Station.

Eastern Creek Quarter and purpose of report
This Economic Impact Assessment has been prepared for Frasers Property Australia to support a State Significant
Development Application (SSDA) submitted to the Department of Planning, Industry and Environment (DPIE)
relating to Lot 3 of the Eastern Creek Quarter Site at Rooty Hill Road South, Eastern Creek. The application seeks
Concept Plan approval for the staged construction of a new factory outlet centre at Lot 3 with supporting food and
beverage tenancies, and ancillary entertainment and recreation usages. This report examines the potential for a
factory outlet centre as part of Stage 3 development at Eastern Creek Quarter and will include assessments of
supportable floorspace, economic benefits and anticipated trading impacts on the relevant network of surrounding
retail facilities. The Appendix of this report provides an analysis of the existing development consent for Stage 3
developments at Eastern Creek Quarter, comparing the current approved specialised retail concept and the
proposed factory outlet development in terms of sales potential, trading impacts and employment generation.

Trade area analysis

• Population levels within the defined main trade area for a factory outlet development at Eastern Creek Quarter
    is forecast to grow strongly over the forecast period. At mid-2020, the main trade area population is estimated
    at almost 1.14 million (including 318,000 in the key primary sector) and is projected to reach almost 1.34 million
    at 2031, reflecting an average annual growth rate of 1.5% over the forecast period.

• The apparel expenditure capacity generated by the main trade area population (which is the key expenditure
    category of factory outlet centres), is forecast to grow from $1.6 billion at 2020 to $1.9 billion at 2031, at an
    average annual growth rate of 1.9% over the forecast period.

Competition
A factory outlet development at Eastern Creek Quarter is likely to compete mostly with other factory outlet centres
throughout Sydney, and to a lesser degree traditional shopping centres with a critical mass of apparel retailers,
i.e. regional centres and sub-regional centres. The most relevant competitive factory outlet centres include the
recently opened Fashion Spree Liverpool and the strong performing DFO Homebush. In terms of traditional retail
centres, regional centres which are likely to bear some competitive influence on the factory outlet development at
Eastern Creek Quarter include Westpoint Blacktown, Westfield Parramatta and Westfield Penrith.

Eastern Creek Quarter – Stage 3                                                                                     1
Economic Impact Assessment
Executive summary

Economic benefits
The proposed factory outlet development will result in a range of economic benefits, particularly for residents of the
main trade area. The key positive impacts will include the following:

•    Alleviating some of the undersupply of factory outlet floorspace in Sydney, particularly Western Sydney;

•    Creating greater choice for consumers, particularly for discount fashion;

•    Synergy with surrounding infrastructure – potentially attracting a similar customer profile to those visiting the
     Sydney Zoo and Bungarribee Park at large; and

•    Providing an employment stimulus – with a factory outlet development projected to support over 500 ongoing
     jobs. In addition, the development could support 555 direct jobs during the construction phase (based on a
     construction cost of $130 million, including fit out works, infrastructure and other associated costs), while
     further jobs in the broader community would also be created from supplier induced multiplier effects during
     this period (based on the appropriate ABS input/output multipliers).

Economic impacts
The likely impacts on traditional retail centres are considered to be well within the reasonable bounds of normal
competition, estimated to average around 2% for higher order centres in the Blacktown LGA. Impacts at this level
are considered almost negligible and immaterial and would not in any way threaten the viability of any retailer in
the area. The factory outlet development at Eastern Creek Quarter is projected to impact the surrounding factory
outlet centres by no more than 4%, which is considered minor and unlikely to materially affect the viability of these
centre or inhibit their ability to continue to effectively serve their respective catchments.

Comparison between factory outlet and large format retail use
Our analysis demonstrates that a greater range of economic and social benefits are likely to arise from a factory
outlet centre as part of Stage 3 developments at Eastern Creek Quarter, compared to a large format retail centre
(as approved under the current development consent). These include alleviating the undersupply of factory outlet
floorspace, interacting with the other Stages of development at Eastern Creek Quarter and the surrounding
infrastructure, creating greater choice for consumers through price competition and reducing leakage expenditure.
The development is expected to have some trading impacts on existing traditional retail and factory outlet facilities
in the region, but are greater for large format retail centres in the surrounding area, if a large format retail
development was to proceed. Therefore, it is concluded that a greater net community benefit will result from the
factory outlet development compared to a large format retail centre.

Eastern Creek Quarter – Stage 3                                                                                      2
Economic Impact Assessment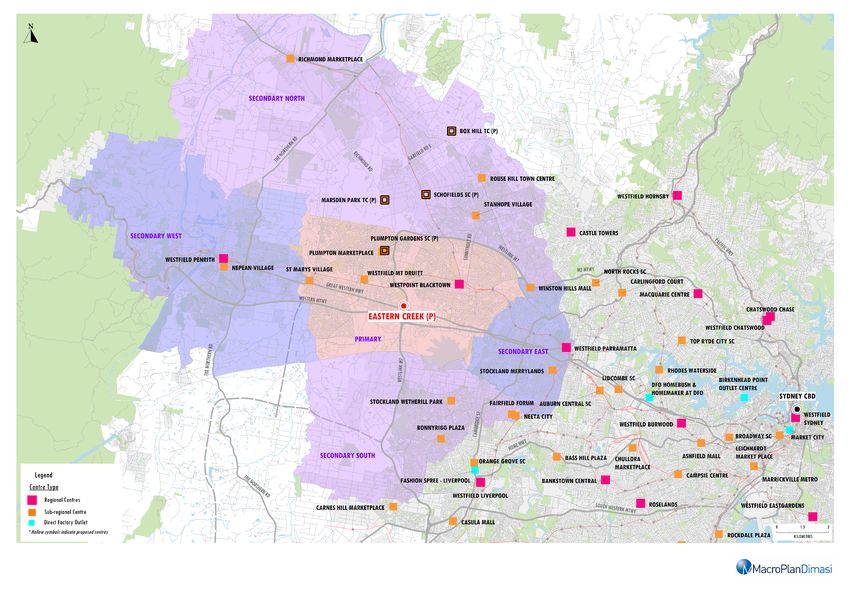
Executive summary

Summary
The high profile nature of the subject site is considered an ideal location for a factory outlet centre, which would
have the potential to serve a large proportion of Western Sydney. A quality facility would also result in some
reduction in the amount of retail expenditure escaping the municipality, while also being able to serve the visitor
market, attracting spend into the area.

The analysis in this report demonstrates that a range of economic and social benefits are likely to arise from a
factory outlet centre development at Eastern Creek Quarter. These include alleviating the undersupply of factory
outlet floorspace, interacting with the surrounding infrastructure, creating greater choice for consumers through
price competition and reducing leakage expenditure. The development is expected to have some trading impacts
on existing traditional retail and factory outlet facilities in the region, however, the trading impacts will not be such
as to threaten any existing facility’s ability to continue operating successfully. Therefore, it is concluded that a net
community benefit will result from the development of a factory outlet centre at Eastern Creek Quarter.

Eastern Creek Quarter – Stage 3                                                                                        3
Economic Impact Assessment
Introduction

This Economic Impact Assessment has been prepared for Frasers Property Australia to support a State Significant
Development Application (SSDA) submitted to the Department of Planning, Industry and Environment (DPIE)
relating to Lot 3 of the Eastern Creek Quarter Site at Rooty Hill Road South, Eastern Creek. The application seeks
Concept Plan approval for the staged construction of a new retail outlet centre at Lot 3 with supporting food and
beverage tenancies, and ancillary entertainment and recreation usages. This report presents an independent
assessment of the market potential for a factory outlet development at Eastern Creek Quarter (Stage 3), as well as
examine the potential benefits and trading impacts on competitive centres in the surrounding region arising from
the development.

The report is structured as follows:

• Section 1 details the locational context of the subject site and the Eastern Creek Quarter development.

• Section 2 provides an analysis of the likely trade area available to be served by the Eastern Creek Quarter
    factory outlet development, including current and projected population levels, the socio-demographic profile of
    the population, and the estimated current and future retail expenditure capacity of trade area residents.

• Section 3 provides an overview of the competitive context in which the factory outlet centre at Eastern Creek
    Quarter will operate.

• Section 4 details the quantum of supportable floorspace and sales potential of a factory outlet centre at Eastern
    Creek Quarter.

• Section 5 outlines the potential economic benefits and trading impacts that can be anticipated following the
    factory outlet centre at Eastern Creek Quarter.

• Appendix examines the trade area, sales potential and anticipated trading impacts arising from the
    development of a large format retail centre at Eastern Creek Quarter under the current development consent,
    assessed against HillPDA’s Economic Impact Assessment for the subject site.

Eastern Creek Quarter – Stage 3                                                                                   4
Economic Impact Assessment
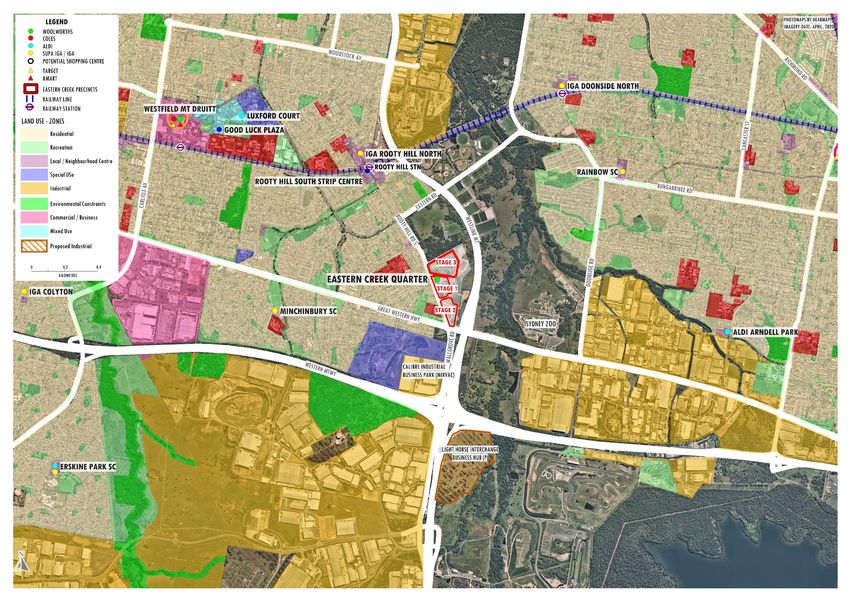
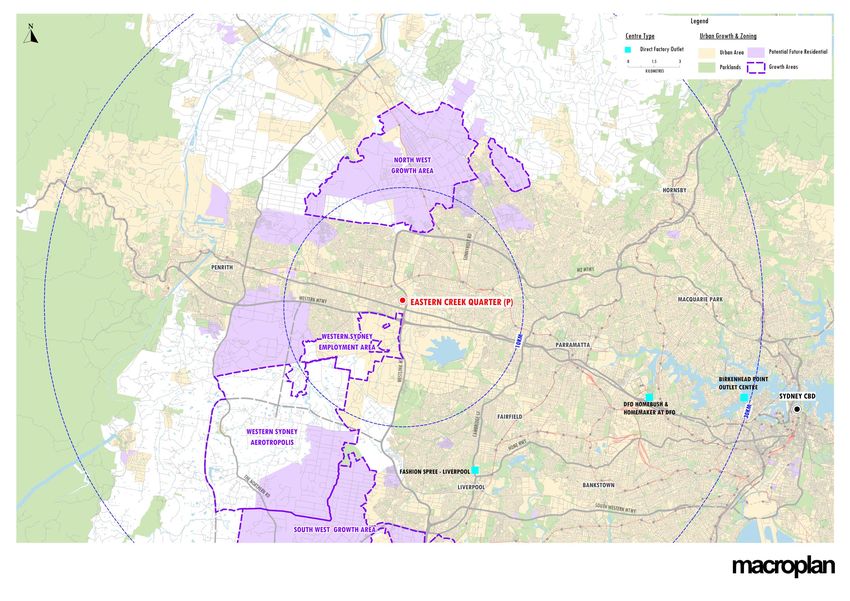
Section 1: Site and development context

This section of report details the locational context of the subject site and the Eastern Creek Quarter development.

1.1       Site and regional context
The 34 hectare Eastern Creek Quarter site is situated to the north of the Great Western Highway between Rooty Hill
Road South and the M7 Motorway. Church Street marks the site’s northern boundary. The site forms part of the
Western Sydney Parklands and is located within the Blacktown Local Government Area, approximately 35 km form
the Sydney CBD (refer Map 1.1).

This State Significant Development Application (SSDA) relates to Lot 3 of the Eastern Creek Quarter site, which is
the final lot proposed to be developed. It is located in the northern part of the site and encompasses an area of
approximately 7.29 hectares (refer Figure 1.1).

The high-profile nature of the Eastern Creek Quarter site enables strong regional connectivity, making it an ideal
site for a retail development which draws from a broad and wide-ranging area. The Great Western Highway is a
major thoroughfare in the region, providing access to Parramatta in the east and Penrith to the west. The
Westlink M7 links the subject site to significant growth area to the south and north and connects to the
M4 Motorway, M2 Motorway at Baulkham Hills and M5 Motorway at Prestons. The subject site possesses excellent
exposure to passing traffic and is connected to emerging resident populations to the north (the North West Growth
Area), north-west (Penrith Lakes, Jordan Springs) and south west (Western Sydney Aerotropolis and the South
West Growth Area).

The locality surrounding Eastern Creek Quarter is undergoing significant development creating a number of
destinational family attractions and employment hubs (refer Map 1.2). Located opposite the subject site on the
eastern side of the Westlink M7, the $15 Bungarribee Park is a 200 hectare recreational and parklands, which was
completed in 2017. In addition, the $45 million development of the adjoining Sydney Zoo was completed in late
2019 and is expected to draw almost 750,000 visitors per year. In conjunction with the surrounding locality, which
also contains attractions such as the Western Sydney Parklands, Raging Waters, Featherdale Sydney Wildlife
Park and the Western Sydney Wanderers Centre of Football, the development of Eastern Creek Quarter is
expected to solidify the status of the area as a hub of leisure, recreation and tourism activities.

Located in the south-eastern portion of the Westlink M7 Motorway and M4 Western Motorway, the Western Sydney
Parklands Trust is developing the Light Horse Interchange Business Hub, which is planned to encompass
157,000 sq.m of industrial and light industrial floorspace, as well as 8,000 sq.m of ancillary commercial floorspace.
Likely land uses for the business hub include advanced manufacturing, freight and logistics and warehouse
and distribution facilities. This development follows the recent completion of Calibre Industrial Park by Mirvac, a
22-hecatre site to the west of Wallgrove Road and the north of the Western Highway which provides 120,000 sq.m
of industrial floorspace and houses tenants such as CEVA Logistics, Miele and Sheldon and Hammond.

Eastern Creek Quarter – Stage 3                                                                                     5
Economic Impact Assessment
Map 1.1: Eastern Creek
Regional context
Section 1: Site and development context

Figure 1.1: Site location
Source: Nearmap

Eastern Creek Quarter – Stage 3           7
Economic Impact Assessment
Map 1.2: Eastern Creek
Site location
Section 1: Site and development context

1.2        Planned development
Table 1.1 provides a summary of the current development consent for Eastern Creek Quarter granted by the
NSW Minister of Planning in 2015 and later modified by the Independent Planning Commission, acting as a
delegate for the Minister of Planning and Public Spaces (2019).

                                                           Table 1.1
                                   Eastern Creek Quarter - Current development consent

                                                                       Existing                 Utilised GFA
                                                                    Concept Plan                 Stage 1 & 2
   Land Use                                                         GFA (sq.m)                     (sq.m)

   Specialised Retail Premises                                         39,400                        10,637

   Recreational facility (indoor)                                        3,000                              0
   Vehicle Repair Station                                                  400                              0
   Convenience Retail                                                  10,754                        10,599

   • Supermarket                                                         3,794
   • Specilaty shops/ small business                                     6,960
   Childcare centre                                                      1,200                          708
   Circulation                                                           1,684                         1684

   Total                                                                56,438                       23,628

   Source: Frasers Property; MacroPlan

A Woolworths anchored neighbourhood centre opened at Eastern Creek Quarter in June 2020. The 3,794 sq.m
supermarket is supported by a number of convenience-oriented specialties, while also accommodating a fitness
centre and medical centre to serve the needs of the growing community. Stage 2 of Eastern Creek Quarter has
been granted approval for the development of ‘specialised retail premises’, which could accommodate a major
tenant of 1,810 (plus 200 sq.m of outdoor display); 19 specialised retail premises which total around 8,300 sq.m, a
tyre sales and service centre of 400 sq.m, a café and a fast food restaurant pad site.

A ‘specialised retail premise’ refers to a building or place the principal purpose of which is the sale, hire or display
of goods which are of a weight, size or quantity, that requires:

• a large area for handling, display or storage, or

• direct vehicular access to the site of the building or place by members of the public for the purpose of loading
      or unloading such goods into or from their vehicles after purchase or hire,

• but does not include a building or place used for the sale of foodstuffs or clothing unless their sale is ancillary
      to the sale, hire or display of other goods referred to in this definition.

Examples of goods that may be sold at specialised retail premises include automotive parts and accessories,
household appliances and fittings, furniture, homewares, office equipment, outdoor and recreation equipment, pet
supplies and party supplies. It is important to note that the general composition and offer between a specialised

Eastern Creek Quarter – Stage 3                                                                                        9
Economic Impact Assessment
Section 1: Site and development context
retail premise and large format retail significantly overlap, with the size of the tenancy, the main distinguishing
feature.
While Stage 3, which is the subject assessment of this report, has been granted development consent to expand
upon the specialised retailing of Stage 2, Frasers Property have proposed the development of a factory outlet
centre in place of specialised retailing uses.
The proposed SSDA seeks Concept Plan approval for a new retail outlet centre at Lot 3 of the Eastern Creek
Quarter site. The Concept Plan will establish the following framework to guide the future detailed design of the
Lot 3 development:
• Land uses, including retail (factory outlet), food and drink premises, amusement centre and indoor recreation
facility;
• Building footprints, including basement, with a maximum height of 12 metres;
• A maximum GFA of 39,500m2 at Lot 3 which will be staged as follows:
− Phase A: 29,500 sq.m
− Phase B: 10,000 sq.m
• Upgrade of Church Street for vehicular access, including traffic signals at the Church Street/Rooty Hill Road
South intersection;
• Modifications to the Cable Place/Rooty Hill Road South/Site Access intersection; and
• Modifications to the Francis Street/Eastern Road/Rooty Hill Road South intersection.
It is also proposed to seek consent for a series of early works including:
Removal of up to 0.73 ha of Cumberland Plains Woodlands in the south west corner of the site;
Bulk earthworks within Lot 3; and
Extension of the internal access road to connect to the basement car park.
The proposed outlet centre at Lot 3 will necessitate the inclusion of conditions of consent which requires the
modification of SSD 5175 (the existing Concept Plan for the broader ECQ site) to amend the overall allocation of
GFA and associated uses, relevant Concept Plans and the existing Design Guidelines. This report is based on the
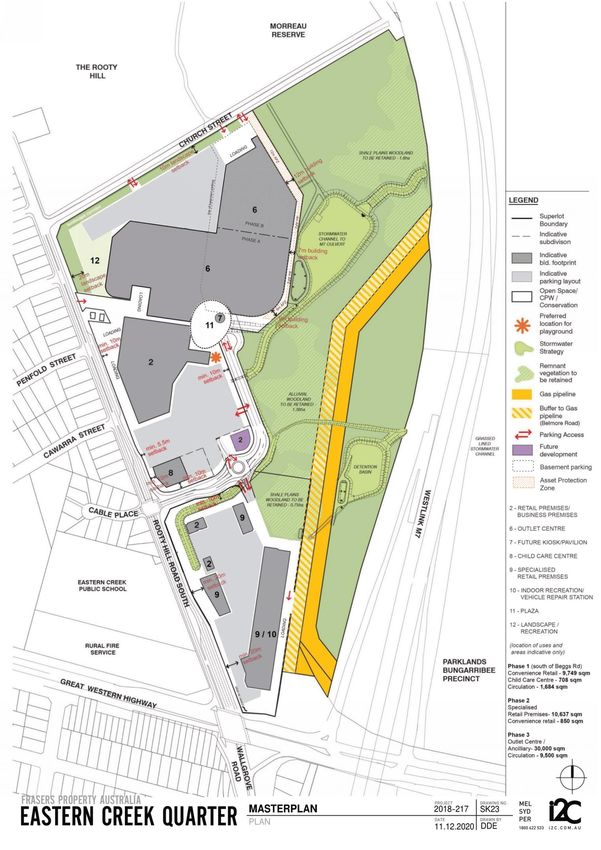
Concept Plan prepared by i2C shown on Figure 1.2.
Table 1.2 details the proposed Gross Leasable Area (GLA) of the development by use. It is important to note that
the analysis provided throughout this report is based on GLA (unless explicitly stated otherwise), which is
considered the industry standard in assessing the level of supportable retail, sales productivity (sales per sq.m)
and trading impacts which can be anticipated to arise from the subject development. GLA refers to the amount of
floorspace available to be rented, including the trading floor, back-of-house areas and storage. Gross Floor Area
(GFA) on the other hand, refers to the total floorspace contained within a development, and includes floorspace
designated for amenities and centre circulation.
Eastern Creek Quarter – Stage 3 10
Economic Impact AssessmentSection 1: Site and development context
Development of Stage 3A is planned to contain a retail GLA of 18,500 sq.m, comprised of 16,150 sq.m of factory
outlet floorspace, 1,200 sq.m of supporting food & beverage floorspace, 1,080 sq.m of tenant storage and an
assumed rate of 120 sq.m of kiosk space. An additional 1,500 sq.m is also planned for entertainment uses (which
is considered a non-retail use), with the total GLA for Stage 3A totalling 20,000 sq.m. It is important to note that
factory outlet floorspace in this report refers to centre floorspace tenanted by predominantly discounted
apparel/fashion stores, but can also contain discounted offers across the household goods, leisure and general
retail categories.
A subsequent expansion of 9,327 sq.m in GLA is planned to be delivered as part of Stage 3B, primarily building
upon the provision of factory outlet uses at the centre, while also increasing the food and beverage amenities, in
anticipation of a greater level of visitation at the centre. In total, Stage 3 developments at Eastern Creek Quarter is
planned to contain a GLA of 29,327 sq.m, with 23,530 sq.m (equivalent to 80% of total GLA) designated for factory
outlet uses.
This report examines the potential for a factory outlet centre as part of Stage 3 developments at Eastern Creek
Quarter and will include assessments of supportable floorspace, economic benefits and anticipated trading impacts
on the relevant network of surrounding retail facilities. The Appendix of this report provides an analysis of the
existing development consent for Stage 3 developments at Eastern Creek Quarter, comparing the current approved
specialised retail concept and the proposed factory outlet development in terms of sales potential, trading impacts
and employment generation.
Table 1.2
Eastern Creek Quarter Stage 3 - Indicative Factory Outlet Centre floorspace by use
Stage Stage Total
3A 3B Stage 3
Use/category (sq.m) (sq.m) (sq.m)
Factory Outlet 16,150 7,380 23,530
Food and beverage 1,150 705 1,855
Kiosk* 120 131 251
Tenant storage/kiosks 1,080 1,111 2,191
Total retail 18,500 9,327 27,827
Entertainment* 1,500 - 1,500
Total GLA 20,000 9,327 29,327
**The split in floorspace between Stage 3A and 3B is yet to be determined and a provision of 120 sq.m and 131 sq.m has
been assumed respectively, for the pruposes for this assessment.
** Classified as a non-retail use
Source: Frasers Property; MacroPlan
Eastern Creek Quarter – Stage 3 11
Economic Impact AssessmentFigure 1.2
Section 2: Trade area analysis

This section of the report provides an analysis the likely trade area available to be served by the Eastern Creek
Quarter factory outlet development, including current and projected population levels, the socio-demographic
profile of the population, and the estimated current and future retail expenditure capacity of trade area residents.

2.1        Trade area definition
The extent of the trade area or catchment that is served by any shopping centre, or retail facility, is shaped by the
interplay of a number of critical factors. These factors include:

  i. The relative attraction of the retail facility or centre, in comparison with alternative competitive retail facilities
       of the same /relevant type. The factors that determine the strength and attraction of any particular centre are
       primarily its scale and composition (in particular the major trader or traders that anchor the centre); its layout
       and ambience; and carparking, including access and ease of use.

  ii. The proximity and attractiveness of competitive retail facilities. The locations, compositions, quality and scale
       of competitive retail facilities all serve to define the extent of the trade area which a retail facility is effectively
       able to serve.

  iii. The available road network and public transport infrastructure, which determine the ease (or difficulty) with
       which customers are able to access a centre, or retail facility.

  iv. Significant physical barriers which are difficult to negotiate, and can act as delineating boundaries to the trade
       area served by an individual centre, or retail facility.

The trade area defined for Stage 3 of the Eastern Creek Quarter development reflects the following:

• The high-profile location of the site, with regional accessibility provided by the M7 Westlink, the Great Western
      Highway and the M4 Motorway;

• The planned composition of the centre. Stage 1 of Eastern Creek Quarter is planned to contain a neighbourhood
      centre, while Stage 2 is centred around a large format retail development. Stage 3, the subject assessment of
      this report is planned to encompass a critical mass of factory outlet retailers, with the overall development
      planned to accommodate a comprehensive retail offering; and

• The location of competitive retail facilities in the surrounding region, including factory outlet centres, Large
      Format retail centres and traditional regional/sub-regional shopping centres.

Eastern Creek Quarter – Stage 3                                                                                             13
Economic Impact Assessment
Section 2: Trade area analysis
The trade area has been defined to include a primary sector and four secondary sectors, as shown on Map 2.1
(while Map 2.2, which illustrates the retail context of the primary sector). The sectors defined are described as
follows:
• The primary sector contains the southern half of the Blacktown LGA, as well as the St Mary’s growth area to
the west and the more established Erskine Park and St Clair region to the southwest of the subject site.
• The secondary north sector contains the designated North West Growth Area of Sydney, as well as the
adjoining region to the west which includes the town of Richmond, extending approximately 28 km north-west
of the subject site.
• The secondary east sector encompasses parts of the Cumberland and Parramatta LGAs, extending
approximately 13 km east of the subject site.
• The secondary south sector contains the majority of the Fairfield LGA and also part of Penrith and Liverpool,
extending approximately 15 km south of the subject site.
• The secondary west sector contains the majority of Penrith City, and parts of the Blue Mountains LGA.
The combination of the primary and the secondary sectors is referred to as the main trade area throughout this
report. The trade area defined is broad and wide-ranging and is reflective of the potential destinational draw of the
centre, which is expected to provide a Regional/District – level offering for Western Sydney.
Eastern Creek Quarter – Stage 3 14
Economic Impact AssessmentMap 2.1: Eastern Creek Main trade area and competition
Map 2.2: Eastern Creek
Primary trade area and competition
Section 2: Trade area analysis

2.2         Trade area population
Table 2.1 details the recent and projected resident population levels for the defined trade area. The population
estimates and forecasts are based on the following sources:

• Australian Bureau of Statistics (ABS) Census of Population and Housing (2011, 2016);

• ABS Dwellings Approvals and Estimated Residential Population Data (2016 – 2019);

• NSW Department of Planning, Industry and Environment population projections, 2019

• Transport for NSW (tfNSW) population projections by Travel Zones;

• Forecast .id projections for Blacktown City (updated October 2017), the Hills Shire (October 2017), City of
      Parramatta (October 2017) and the Cumberland Council area (September 2017).

• Investigations of residential developments in the main trade area and surrounding areas conducted by this
      office.

The Eastern Creek Quarter main trade area population is estimated at almost 1.14 million at mid-2020, including
close to 318,000 in the key primary sector. The main trade area population is projected to reach almost 1.34 million
at 2031, reflecting an average annual growth rate of 1.5% over the period.

The Covid-19 pandemic has introduced significant uncertainty in the Australian economy and the resulting rate of
population growth in the main trade area is likely to be below that of the level anticipated, at least in the short term.
On one hand, market uncertainty has led many households to deferring long term buying decisions in the property
market, reducing demand for residential product. Furthermore, reduced net migration, both domestically and
internationally, which had been the key driver of Sydney’s population, particularly for Greater Western Sydney, is
also likely to have dampening effect on the residential market.

One the other hand, record low interest rates as well as a programme state and federal government schemes
incentivising demand seek to act as a buffers against a downturn. These policy initiatives, which are particular
relevant for the Eastern Creek Quarter main trade area, whose greenfield development is underpinned by first
home buyers and/or young families, include:

• The First Home Owners Grant, which encompasses a $10,000 contribution to the purchase price of a new
      home up to $750,000;

• The First Home Buyers Assistance Scheme – which grants a full or partial waiver of stamp duty of up to
      $800,000 in purchase price;

• The Homebuilder Grant - a $25,000 grant for singles earning less than $12,500 per annum and couples up to
      $200,000 per annum, building new homes below $750,000 in value; and

• The First Home Loan Deposit Scheme - with the government guaranteeing up to 15% of the property
      purchased, allowing first home owners to purchase without paying lender’s insurance with as a little as 5%
      deposit.

Eastern Creek Quarter – Stage 3                                                                                       17
Economic Impact Assessment
Section 2: Trade area analysis
Assuming that an effective vaccine is widely distributed and freedom of movement becomes increasingly
unconstrained, population growth is projected to approach forecast levels over the medium and long term
particularly given the Reserve Bank has signalled interest rates will remain low for a sustained period. In the
intervening period, purchasing decisions may be delayed in the short term and push out to future period, where
there is greater certainty, security of employment and confidence in the wider economy.
Table 2.1
ECQ Factory Outlet Centre trade area population, 2011-2031*
Estimated population Forecast population
Trade area sector 2011 2016 2020 2021 2026 2031
Primary 289,440 307,870 317,870 320,370 330,370 337,870
Secondary sectors
• North 196,850 227,800 255,800 263,300 305,800 353,300
• East 176,290 195,940 211,940 215,940 235,940 255,940
• South 158,560 171,830 177,830 179,330 186,830 194,330
• West 154,040 167,730 175,730 177,730 186,730 194,230
Total secondary 685,740 763,300 821,300 836,300 915,300 997,800
Main trade area 975,180 1,071,170 1,139,170 1,156,670 1,245,670 1,335,670
Average annual growth (no.)
Trade area sector 2011-16 2016-20 2020-21 2021-26 2026-31
Primary 3,686 2,500 2,500 2,000 1,500
Secondary sectors
• North 6,190 7,000 7,500 8,500 9,500
• East 3,930 4,000 4,000 4,000 4,000
• South 2,654 1,500 1,500 1,500 1,500
• West 2,738 2,000 2,000 1,800 1,500
Total secondary 15,512 14,500 15,000 15,800 16,500
Main trade area 19,198 17,000 17,500 17,800 18,000
Average annual growth (%)
Trade area sector 2011-16 2016-20 2020-21 2021-26 2026-31
Primary 1.2% 0.8% 0.8% 0.6% 0.4%
Secondary sectors
• North 3.0% 2.9% 2.9% 3.0% 2.9%
• East 2.1% 2.0% 1.9% 1.8% 1.6%
• South 1.6% 0.9% 0.8% 0.8% 0.8%
• West 1.7% 1.2% 1.1% 1.0% 0.8%
Total secondary 2.2% 1.8% 1.8% 1.8% 1.7%
Main trade area 1.9% 1.6% 1.5% 1.5% 1.4%
*As at June
Source: ABS Census 2016; NSW DPIE 2019; NSW Transport Performance and Analytics 2016Forecast.id; Macroplan
Eastern Creek Quarter – Stage 3 18
Economic Impact AssessmentSection 2: Trade area analysis
2.3 Socio-demographic profile
Table 2.2 and Chart 2.1 detail the socio-demographic profile of residents within the defined main trade area as
sourced from the 2016 ABS Census of Population and Housing. The profile is compared with benchmarks for
metropolitan Sydney and Australia, with the key points to note including the following:
• Average income levels for the main trade area population are lower than the metropolitan Sydney benchmark.
• The average age of main trade area residents, at 35.6 years, is below the metropolitan Sydney average of
37.5 years. This reflects the high representation of children in the trade area and a much lower than average
proportion of elderly residents.
• Total home ownership levels throughout the main trade area are above the metropolitan Sydney average,
underpinned by households who own their homes with a mortgage at 40%, compared to benchmark levels of
34%.
• Approximately 60% of residents in the trade area are Australian born, while almost 20% of residents are Asian
born, both in line with the metropolitan Sydney benchmark.
• Traditional families (i.e. couples with dependent children) are the most common family type throughout the main
trade area at 52%, while the proportion of lone person households is below benchmark levels.
In summary, the trade area is characteristic of an outer growth area in Sydney, comprised of traditional families in
their early life stages who are attracted by the relative affordability of housing and lifestyle in the area.
Eastern Creek Quarter – Stage 3 19
Economic Impact AssessmentSection 2: Trade area analysis
Table 2.2
ECQ Factory Outlet Centre main trade area - socio-demographic profile, 2016
Primary Secondary sectors Main Syd Metro Aust.
Census item sector North East South West TA avg. avg.
Per capita income $31,658 $44,235 $35,456 $30,012 $39,142 $35,935 $45,173 $39,800
Var. from Syd Metro bmark -29.9% -2.1% -21.5% -33.6% -13.4% -20.5%
Avg. household income $96,155 $141,750 $103,341 $101,744 $107,491 $109,521 $123,654 $101,610
Var. from Syd Metro bmark -22.2% 14.6% -16.4% -17.7% -13.1% -11.4%
Avg. household size 3.0 3.2 2.9 3.4 2.7 3.0 2.7 2.6
Age distribution (% of population)
Aged 0-14 21.8% 23.0% 20.9% 20.0% 21.2% 21.5% 18.7% 18.7%
Aged 15-19 6.9% 7.1% 5.1% 7.4% 6.6% 6.7% 6.0% 6.1%
Aged 20-29 14.8% 12.5% 15.3% 14.5% 13.4% 14.1% 15.0% 13.8%
Aged 30-39 15.4% 15.5% 19.5% 13.0% 14.5% 15.6% 15.5% 14.0%
Aged 40-49 12.9% 15.6% 12.5% 13.4% 13.7% 13.6% 13.7% 13.5%
Aged 50-59 12.0% 11.9% 10.2% 13.7% 12.1% 11.9% 12.2% 12.7%
Aged 60+ 16.1% 14.5% 16.6% 18.0% 18.5% 16.5% 18.9% 21.1%
Average age 35.2 34.7 35.6 36.8 36.5 35.6 37.5 38.6
Housing status (% of households)
Owner (total) 63.7% 76.4% 57.7% 70.7% 71.8% 67.6% 64.2% 67.4%
• Owner (outright) 24.8% 26.3% 26.0% 33.3% 29.0% 27.3% 30.0% 31.9%
• Owner (with mortgage) 38.9% 50.1% 31.7% 37.4% 42.8% 40.3% 34.2% 35.5%
Renter 35.9% 23.2% 41.3% 29.0% 27.7% 31.9% 35.1% 31.8%
Birthplace (% of population)
Australian born 59.2% 65.6% 49.2% 48.1% 80.2% 60.3% 60.9% 71.9%
Overseas born 40.8% 34.4% 50.8% 51.9% 19.8% 39.7% 39.1% 28.1%
• Asia 21.2% 19.2% 30.8% 17.5% 6.0% 19.5% 19.1% 11.2%
• Europe 6.5% 6.8% 5.8% 9.1% 8.8% 7.2% 9.6% 9.6%
• Other 13.1% 8.5% 14.3% 25.2% 5.0% 13.0% 10.4% 7.4%
Family type (% of population)
Couple with dep't child. 49.6% 59.7% 53.5% 50.6% 48.2% 52.3% 48.5% 44.8%
Couple with non-dep't child. 10.7% 10.3% 8.7% 15.2% 9.5% 10.7% 9.1% 7.7%
Couple without child. 15.4% 15.4% 17.3% 13.5% 19.8% 16.3% 20.1% 22.8%
One parent with dep't child. 11.8% 6.7% 7.5% 10.3% 9.9% 9.4% 7.9% 8.8%
One parent w non-dep't child. 5.3% 3.0% 4.3% 5.7% 4.3% 4.5% 4.1% 3.7%
Lone person 5.9% 4.2% 7.3% 3.7% 7.5% 5.8% 9.2% 11.0%
Car ownership
% 0 Cars 26.5% 23.4% 5.1% 14.2% 10.0% 17.2% 11.4% 7.7%
% 1 Car 41.8% 42.9% 30.4% 43.5% 40.3% 39.8% 38.5% 36.1%
% 2 Cars 22.3% 23.8% 40.7% 30.1% 35.8% 29.6% 34.0% 37.5%
% 3 Cars 6.2% 6.5% 14.8% 8.2% 9.5% 8.7% 10.5% 12.2%
% 4 plus Cars 3.3% 3.3% 9.1% 3.9% 4.5% 4.7% 5.7% 6.5%
Source: ABS Census of Population & Housing, 2016; Macroplan
Eastern Creek Quarter – Stage 3 20
Economic Impact AssessmentSection 2: Trade area analysis
Chart 2.1
ECQ Factory Outlet Centre main trade area - socio-demographic profile, 2016
Age distribution
25% 22%
21% ECQ Factory Outlet Centre PTA ECQ Factory Outlet Centre MTA Syd Metro Aust. Avg. 21%
20% 19% 19% 19%
15%16% 16%17%
15% 15% 16%
15% 14% 14% 14% 14% 14%
13% 14% 12%12%12%
13%
10%
7% 7% 6%
6%
5%
0%
Aged 0-14 Aged 15-19 Aged 20-29 Aged 30-39 Aged 40-49 Aged 50-59 Aged 60+
Income levels
$160,000
$123,654
$109,521
$120,000 $101,610
$96,155
$80,000
$35,935 $45,173 $39,800
$31,658
$40,000
$0
Per capita income Avg. household income
Country of birth
80% 72%
59% 60% 61%
60%
41% 40%
39%
40%
28%
20%
0%
Australian Born Overseas Born
Family type
60% 52%
50%
48% 45%
50%
40%
30%
23%
20%
20% 15%16%
11%11% 12%9% 11%
9% 8% 8% 9% 6% 6% 9%
10% 5% 5% 4% 4%
0%
Couple with Couple with non- Couple without One parent with One parent with non- Lone person
dependent children dependent children children dependent children dependent children
Source: ABS Census of Population & Housing, 2016; Macroplan
Eastern Creek Quarter – Stage 3 21
Economic Impact AssessmentSection 2: Trade area analysis
2.4 Retail expenditure
Macroplan estimates retail expenditure capacity generated by the main trade area residents based on information
sourced from Market Data Systems (MDS), which utilises a detailed micro simulation model of household
expenditure behaviour for all residents of Australia. The model takes into account information from a wide variety
of sources including the regular ABS Household Expenditure Surveys, national accounts data, Census data and
other information. MarketInfo data is a relatively accurate measure of available retail expenditure and is widely
used in the retail industry.
Chart 2.2 illustrates the average per capita retail expenditure capacity of main trade area residents for the year
2019/20, and compares these estimates with the average for metropolitan Sydney and Australia. All expenditure
estimates are presented inclusive of GST. Total per capita retail expenditure for main trade area residents is
estimated at $13,369 in 2019/20, which is below the Sydney metropolitan average of $15,004 per annum.
Chart 2.2
ECQ Factory Outlet Centre main trade area - retail expenditure per person, 2019/20*
Total retail
$16,000 15,004 14,512
13,369
ECQ Factory Outlet Centre MTA Syd Metro Aust. Avg.
$12,000
8,669 8,327
7,893
$8,000 6,335 6,185
5,476
$4,000
$0
Total Food Total Non-food Total Retail
Food
$4,000
3,201 3,272 3,386
$3,000
2,158 2,334 2,319 2,282
1,859 1,826
$2,000
$1,000 675 781 797
$0
Fresh Food Other Food & Groceries Packaged Liquor Food Catering
Non-food
$3,000
2,535 2,571
$2,500 2,236
$2,000
1,631
1,379 1,436
$1,500
1,003 1,090 1,119
$1,000
512 620 626
347 458 432
$500
$0
Apparel Household Goods Leisure General Retail Retail Services
*Including GST
Source: MarketInfo; Macroplan
Eastern Creek Quarter – Stage 3 22
Economic Impact AssessmentSection 2: Trade area analysis
Table 2.3 presents projections of total retail spending generated by the main trade area population over the period
from 2020 to 2031, while Table 2.4 details the estimated retail spending capacity of the main trade area by retail
category. Spending forecasts are presented in constant 2019/20 dollars, (i.e. excluding inflation) and include GST.
The retail expenditure capacity of the main trade area is estimated to grow from $15.1 billion at 2020 to $19.3 billion
at 2031, at an average annual growth rate of 2.2% over the forecast period. The key components underpinning this
growth is the population growth of the main trade area, which is projected to increase at an average annual rate of
1.5%, while an allowance has been made for real growth in per capita retail expenditure which is expected to
average between 0.6-0.7% per annum over the forecast period.
The apparel expenditure capacity of the main trade area, which is the main expenditure category for factory outlet
centres, is estimated to grow from $1.6 billion at 2020 to $1.9 billion at 2031, at an average annual growth rate of
1.9% over the forecast period.
Table 2.3
ECQ Factory Outlet Centre main trade area - retail expenditure ($M), 2020-2031*
Year ending Primary Secondary sectors Main
June sector North East South West TA
2020 3,943 3,775 2,732 2,083 2,583 15,116
2021 4,002 3,911 2,804 2,115 2,631 15,463
2022 4,059 4,059 2,877 2,148 2,678 15,820
2023 4,113 4,217 2,950 2,181 2,723 16,184
2024 4,168 4,377 3,024 2,215 2,770 16,553
2025 4,223 4,539 3,100 2,249 2,817 16,927
2026 4,279 4,703 3,176 2,283 2,864 17,304
2027 4,332 4,876 3,253 2,318 2,910 17,689
2028 4,382 5,060 3,332 2,353 2,953 18,081
2029 4,433 5,247 3,411 2,389 2,998 18,477
2030 4,485 5,436 3,491 2,425 3,042 18,878
2031 4,537 5,627 3,572 2,461 3,088 19,284
Average annual growth ($M)
2020-2031 54.0 168.3 76.3 34.4 45.9 378.8
Average annual growth (%)
2020-2031 1.3% 3.7% 2.5% 1.5% 1.6% 2.2%
*Constant 2019/20 dollars & including GST
Source: MarketInfo; Macroplan
Eastern Creek Quarter – Stage 3 23
Economic Impact AssessmentSection 2: Trade area analysis
Table 2.4
ECQ Factory Outlet Centre main trade area - retail expenditure by category ($M), 2020-2031*
Year ending FLG Food Apparel Household Leisure General Retail Total
June catering goods retail services retail
2020 6,822 2,102 1,559 2,528 579 1,134 393 15,116
2021 6,983 2,159 1,589 2,582 590 1,158 402 15,463
2022 7,149 2,218 1,620 2,637 602 1,183 411 15,820
2023 7,318 2,278 1,651 2,694 614 1,208 421 16,184
2024 7,489 2,340 1,683 2,751 626 1,233 431 16,553
2025 7,662 2,402 1,715 2,809 639 1,259 441 16,927
2026 7,838 2,466 1,747 2,867 651 1,285 451 17,304
2027 8,017 2,531 1,779 2,926 664 1,311 461 17,689
2028 8,199 2,598 1,812 2,987 676 1,338 471 18,081
2029 8,383 2,666 1,845 3,047 689 1,365 482 18,477
2030 8,570 2,734 1,879 3,109 702 1,392 492 18,878
2031 8,759 2,805 1,912 3,171 715 1,420 503 19,284
Average annual growth ($M)
2020-2031 176.1 63.9 32.1 58.5 12.4 26.0 10.0 378.8
Average annual growth (%)
2020-2031 2.3% 2.7% 1.9% 2.1% 1.9% 2.1% 2.3% 2.2%
*Constant 2019/20 dollars & including GST
Source: MarketInfo; Macroplan
Retail expenditure category definitions:
• FLG: take-home food and groceries, as well as packaged liquor.
• Food catering: expenditure at cafes, take-away food outlets and restaurants.
• Apparel: clothing, footwear, fashion accessories and jewellery.
• Household goods: giftware, electrical, computers, furniture, homewares and hardware goods.
• Leisure: sporting goods, music, games, books, newspapers & magazines, stationery and photography equipment.
• General retail: pharmaceutical goods, cosmetics, toys, florists, mobile phones and pets.
• Retail services: hair & beauty, optical goods, dry cleaning, key cutting and shoe repairs.
Eastern Creek Quarter – Stage 3 24
Economic Impact AssessmentSection 3: Competitive context
This section of the report provides an overview of the competitive context in which the subject factory outlet centre
will operate.
A factory outlet development at Eastern Creek Quarter is likely to compete with other factory outlet centres in the
surrounding region, as well as traditional shopping centres with a critical mass of apparel retailers, i.e. regional
centres, and to a lesser extent, sub-regional centres.
Table 3.1 presents a summary of the factory outlet centres in Sydney, while Table 3.2 presents the relevant
competitive higher order centres in the surrounding region (with the locations of these facilities illustrated on
Map 2.1 and Map 2.2 respectively. The key points to note are summarised below.
Table 3.1
Eastern Creek Quarter - Stage 3 - schedule of factory outlet centres
Retail Dist. by road from
Centre GLA Offer ECQ
(sq.m) (km)
Within trade area
Fashion Spree - Liverpool 15,000 59 predominantly national fast fashion and 20.0
casual apparel tenants
Beyond trade area
DFO Homebush 29,880 110 international, luxury and mid-market apparel 25.0
retailers, 15 large format stores
Birkenhead Point 35,000 Coles, Aldi, 10 homemaker mini-majors 34.0
apparel and outlet outlet specialties
Source: SCN Shopping Centre News; Vicinity; Property Council of Australia; MacroPlan
Eastern Creek Quarter – Stage 3 25
Economic Impact AssessmentSection 3: Competitive context
Table 3.2
Eastern Creek Quarter Stage 3 - schedule of major traditional retail facilities
Retail Dist. by road from
Centre GLA Major traders ECQ
(sq.m) (km)
Within trade area
Regional centres
Westpoint Blacktown 82,500 Myer, Target, Big W, Coles, Woolworths, Aldi 7.2
Westfield Parramatta 137,700 David Jones, Myer, Kmart, Target, Coles, Woolworths 16.5
Westfield Penrith 76,000 Myer, Big W, Target, Woolworths, Aldi 21.6
Sub-regional centres
Westfield Mt. Druitt 60,000 Kmart, Target, Woolworths, Coles 4.3
Plumpton Marketplace 16,000 Big W, Woolworths 5.7
Plumpton SC (p) 15,000 dds (p), smkt (p) 6.0
St. Mary's Village 15,700 Target, Woolworths 9.0
Stockland Wetherill Park 71,500 Big W, Target, Coles Woolworths 12.1
Stanhope Village 18,000 Kmart, Coles, Aldi 12.6
Nepean Village 23,000 Kmart, Coles
Rouse Hill TC 15.0
• Rouse Hill TC (existing) 56,600 Big W, Target, Woolworths, Coles
• Rouse Hill TC (p) 29,000 ds (p), smkt (p)
Stockland Merrylands 59,600 Big W, Target, Kmart, Coles, Woolworths, Aldi 15.9
Bonnyrigg Plaza 21,000 Big W, Woolworths 16.6
Winston Hills SC 24,500 Big W, Woolworths, Coles, Aldi 17.4
Fairfield Forum 18,000 Kmart, Coles, Aldi 17.7
Neeta City 20,000 Big W, Woolworths 18.7
Carnes Hill Marketplace 17,200 Big W, Woolworths 19.3
Richmond Marketplace 16,500 Big W, Woolworths 25.8
Beyond trade area
Westfield Liverpool 83,400 Myer, Target, Big W, Coles, Woolworths 20.9
Castle Towers 24.6
• Castle Towers (existing) 101,900 David Jones, Myer, Kmart, Target, Coles, Aldi
• Castle Towers (p) - dds (p), smkt (p)
Westfield Burwood 63,200 David Jones, Kmart, Target, Coles, Woolworths 28.1
Macquarie Centre 135,500 David Jones, Myer, Big W, Target, Woolworths, Aldi 37.3
Westfield Hornsby 99,800 David Jones, Myer, Kmart, Target, Woolworths, Aldi 38.4
Source: Property Council of Australia; Shopping Centre News; MacroPlan
Eastern Creek Quarter – Stage 3 26
Economic Impact AssessmentSection 3: Competitive context
Outlet centres
• Fashion Spree Liverpool is a recently new factory outlet development, situated on Orange Grove Road in
Warwick Farm, approximately 20 km south-east of the subject site. The centre contains close to
60 predominantly fast fashion/streetwear apparel retailers (Glue, H&M, Bonds Outlet, Just Jeans, Supre,
Converse), across 15,000 sq.m of floorspace.
• DFO Homebush is one of the most successful factory outlet developments in Australia and is located around
25 km east of the subject site. The two-level centre contains over 100 outlet retailers, including a large provision
of luxury and high-end brands (such as Burberry, Coach, Zegna, Max Mara, Mulberry, Salvatore Ferragamo,
Armani), mid-market luxury international labels (such as Calvin Klein, Guess, Hugo Boss, Ted Baker, Michael
Kors), as well as a provision of prominent casual apparel retailers.
• DFO Homebush also contains a sizable large format retail component, encompassing 15 large format retailers
including JB Hi-Fi Home, Adairs, Adventure Megastore, Oz Design Furniture and Snooze. The centre achieved
a very strong MAT of $331.4 million in 2019, at a sales productivity rate of $12,413 per sq.m.
• Located around 33 km east of the subject development, Birkenhead Point Outlet Centre is a hybrid
development, which in addition to a significant provision of factory outlet apparel floorspace, contains Coles
and Aldi supermarkets. According to SCN Little Guns, the centre recorded sales of $299 million in 2019, at an
average sales productivity of $10,406 per sq.m.
Traditional retail centres
• Westpoint Blacktown is a large regional centre encompassing 82,500 sq.m of retail floorspace, located
approximately 7.2 km north east of Eastern Creek Quarter. The centre is anchored by a Myer department store,
Target and Big W dds, as well as Coles and Woolworths supermarkets. According to SCN Big Guns 2019, the
centre achieved an MAT of $522.99 million at a sales productivity level of $6,439 per sq.m, and a specialty
sales productivity level of $9,406 per sq.m.
Westpoint Blacktown contains an extensive provision of mini-major tenants, including JB Hi-Fi, Daiso,
T K Maxx, Best&Less and rebel. The centre encompasses over 70 apparel stores (equivalent to an estimated
10,000 sq.m), and possesses a particular focus on low price point/ fast fashion for teenagers and young adults
(such as Factorie, Forever New, Jay Jays, Jeanswest and Platypus), a range of womenswear targeting the
suburban mum (Millers, Suzanne Grae and Rockmans) and childrenswear (Cotton On Kids, Carter’s Osh Kosh
and Best and Less). There are also close to 60 food & beverage retailers, comprised of fast food operators
(such as KFC, McDonald’s and Hungry Jack’s), food court/takeaway options (such as Donut King, Ali Baba and
Sandwich Chefs), cafes (such as Gloria Jean’s Coffee, Jamaica Blue and the Coffee Club) and casual dining
restaurants such as Nando’s, Hogs Breath Café and Mad Mex.
• Located approximately 16.5 km east of Eastern Creek Quarter, Westfield Parramatta, is a regional centre
encompassing 137,700 sq.m of retail floorspace, and is anchored by David Jones and Myer department stores,
Kmart and Target dds, as well as Coles and Woolworths supermarkets. According to SCN Big Guns, Westfield
Parramatta achieved a MAT of $834.55 million at a sales productivity level of $6,822 per sq.m, and a specialty
sales productivity level of $12,215 per sq.m. The centre contains a large apparel provision, possessing close
to 130 apparel stores in the centre, which are mainly centred around low price point/ fast fashion for teenagers
and young adults (such as Valleygirl, General Pants Co, Factorie, Bardot, Glue and Industrie), mid-market
Eastern Creek Quarter – Stage 3 27
Economic Impact AssessmentSection 3: Competitive context
apparel (Witchery, Tony Bianco, Oroton, Aquila) and streetwear/athleisure (Nike, Glue, General Pants Co.).
There are also a number of jewellery retailers (such as Bevilles, Eternity Jewellers, Gregory Jewellers,
Goldmark and Michael Hill Jewellers) and prominent international fashion retailers (such as Uniqlo, Superdry
and Victoria’s Secret). As is typical for regional Westfield Centre, food and beverage is a key emphasis. There
are close to 100 food catering operators, comprised fast food (such as McDonald’s, Hungry Jack’s and KFC),
food court offerings (such as Roll’d, Oporto, Soul Origin and Subway), cafes (Gloria Jean’s coffee, Starbucks
and the Coffee Emporium) and a number of casual dine-in restaurants (such as Pappa Rich, Grill’d and Chefs
Gallery).
• Westfield Penrith is a regional centre encompassing a retail GLA of 76,000 sq.m, located approximately 21.6 km
west of Eastern Creek Quarter, anchored by a Myer department store, Big W and Kmart dds, as well as Coles
and Woolworths supermarkets. According to SCN Big Guns, Westfield Penrith recorded a MAT of
$676.14 million at a sales productivity level of $8,244 per sq.m, and a specialty sales productivity level of
$12,109 per sq.m. Westfield Penrith features approximately 100 apparel stores, mostly comprising fast fashion
offerings (such as Valleygirl, Supre, Bardot and Country Road), streetwear/athleisure (Glue, General Pants
Co.), jewellery retailers (York Jewellers, Prouds the Jewellers, Pandora and Michael Hill) and footwear retailers
(such as Ziera, Wittner and R.M. Williams). There are also 64 food catering stores operating within the centre,
mainly comprising fast food (such as McDonald’s and KFC), food court offerings (such as Ali Baba, Subway,
Donut King and Sushi Hub), cafes (such as The Coffee Club, The Coffee Emporium, Muffin Break and Café
LeLunar) and dine-in restaurants (such as The Bavarian, Rashay’s Casual Dining, Grill’d and Coco Cubano).
• Westfield Mt. Druitt is a large sub-regional centre encompassing a retail Gross Leasable Area (GLA) of
60,000 sq.m, located approximately 4.3 km north-west of the Eastern Creek Quarter, and is anchored by Kmart
and Target dds, as well as Woolworths and Coles supermarkets. According to SCN Big Guns, Westfield
Mt. Druitt recorded a MAT of $676.14 million at a sales productivity level of $8,005 per sq.m, and a specialty
sales productivity level of $8,948 per sq.m. Westfield Mt. Druitt is comprised of a more ad hoc provision of
almost 60 apparel retailers (equivalent to an estimated 6,000 sq.m), with Millers, Collette, Footlocker,
Strandbags and Pandora the most prominent operators. There are 44 food catering retailers operating within
the centre, mainly comprising fast food outlets (such as McDonald’s, Hungry Jacks, Subway and KFC) as well
as food court offerings (such as Soul Origin, Yiro’Yio, Hero Sushi and Donut King) and cafes (such as Café
Lelunar, Jamaica Blue, Gloria Jean’s Coffee and Starbucks).
It has been noted that the $1.49 billion Mt. Druitt CBD revamp has recently been approved by the State
Government. The project is planned to deliver 2,800 new apartments, as well as a mix of cafes, restaurants,
other retail and commercial uses. This revitalisation is unlikely to bear a strong competitive influence on the
factory outlet centre at Eastern Creek Quarter, as it will likely have a food & beverage focus. Any competitive
fashion tenants are likely to be provided more ad hoc, without a critical mass or scale to have a competitive
bearing on the subject centre.
• Stockland Wetherill Park is a large sub-regional shopping centre encompassing a retail GLA of 71,500 sq.m,
located 12.1 km south east of the Eastern Creek quarter, anchored by a Big W and Target dds and Coles and
Woolworths supermarkets. According to SCN Big Guns, Stockland Wetherill Park recorded a MAT of
$381.83 million, at a sales productivity level of $6,627, and a specialty sales productivity level of $9,091. There
are 63 apparel retailers operating in the shopping centre, with a focus on low-end fast fashion retailers (such
as Jay Jays, Just Jeans, Bardot, Forever New and Dotti), menswear (Connor, Industrie, Politix) footwear
retailers (such as Foot Locker, Platypus, Sketchers and Novo Shoes) and jewellers (such as Prouds, Pandora,
Eastern Creek Quarter – Stage 3 28
Economic Impact AssessmentSection 3: Competitive context
Atlas Jewellers and Michael Hill). Stockland Wetherill Hill also features 44 food catering retailers, mainly
comprising fast food (such as McDonald’s, KFC and Subway), food court offerings (such as Soul Origin,
Hokka Hokka, Curry Delight and Ataman Kebab) and cafes (such as Gloria Jean’s Coffee, The Coffee
Emporium, Café Cherry Beans and Blue Star Café), as well as a small range of dine-in restaurants (such as
Mr. Chen Chinese Restaurant, Nando’s, The Bavarian and Savanas Restaurant).
• Rouse Hill TC is a large sub-regional shopping centre encompassing a retail GLA of 56,600 sq.m, located
15 km north east of the Eastern Creek Quarter, anchored by a Big W and Target dds and Woolworths and
Coles supermarkets. GPT Group, the owners of Rouse Hill TC, announced plans to expand the shopping
centre, proposing an additional 29,000 sq.m of retail GLA and the addition of a new dds and supermarket.
Rouse Hill TC recorded a MAT of $435.57 million at a sales productivity level of $7,987, and a specialty sales
productivity level of $8,753 per sq.m. There are 59 apparel retailers operating within centre, which mainly
comprise fast fashion, mid-market retailers and athleisure/streetwear (such as Bardot, City Beach, Cotton On,
Dotti, General Pants Co and Jay Jays) and jewellers (such as Prouds, Pandora, Forever Jewellers and
Carati Jewellers). There are also 44 food catering retailers operating within the centre, with a particular focus
on food court/takeaway food type tenancies (such as Sushi Tabi, Dumpling Project, Seoul Street Food and
Fogo Brazilia) and dining (the Bavarian, Outback Jacks, Lusso Italian Restaurant).
• Located in the Blacktown LGA, Plumpton Marketplace is a single discount department store centre, anchored
by Big W and a Woolworths supermarket. Despite its sub-regional status, the centre provides a strong focus
on serving the main food, grocery and convenience-oriented needs of residents in the surrounding region. The
centre encompasses a small provision of apparel retailers (equivalent to an estimated 1,500 sq.m), which
includes Millers, Crossroads and Strandbags the key retailers.
• Also located in the Blacktown LGA, Stanhope Village is a Kmart anchored single discount department store
centre, which also contains Coles and Aldi supermarkets. Like Plumpton Marketplace, the centre aims to serve
the weekly food, grocery and convenience-oriented needs of surrounding residents and contains a generally
limited apparel offer (with Cotton On, Crossroads and Noni B the key retailers).
• There are also a number of additional smaller sub-regional shopping centres within the trade area. However,
due to the smaller scale of their apparel offer, it is unlikely these centres will bear a strong competitive influence
on the factory outlet development at Eastern Creek Quarter.
Eastern Creek Quarter – Stage 3 29
Economic Impact AssessmentYou can also read