Ecological Effects of Fishing - IN MARINE ECOSYSTEMS OF THE UNITED STATES - The Pew Charitable Trusts
←
→
Page content transcription
If your browser does not render page correctly, please read the page content below

Ecological Effects
                 of Fishing
IN MARINE ECOSYSTEMS OF THE UNITED STATES

                                        Prepared for the
                              Pew Oceans Commission by

                                        Paul K. Dayton
                                      Scripps Institution
                                       of Oceanography

                                         Simon Thrush
                                    National Institute of
                                 Water and Atmospheric
                                 Research (New Zealand)

                                   Felicia C. Coleman
                                  Florida State University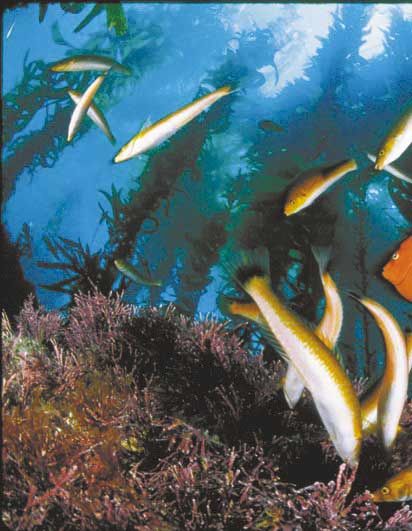
FRONT AND BACK COVER: A submarine jungle of giant kelp teems with life in the cool nutrient-rich waters of southern California. Giant kelp—a
kind of seaweed—can grow up to two feet (0.61 m) a day and may reach one hundred feet (30 m) in length. Kelp provides sustenance and shelter
for a vast array of marine organisms, such as the orange garibaldi and señorita wrasses in the photograph, as well as sea otters, and many other
marine animals and plants. The productivity of kelp forest ecosystems rivals that of most productive terrestrial systems. In the United States, kelp
ecosystems occur along the Pacific coast and in the northwest Atlantic. All of these ecosystems are affected directly through kelp harvesting and
natural environmental variation. They are also affected indirectly through fishing that removes the natural predators of sea urchins, causing
trophic cascades as sea urchin populations expand to overgraze and decimate kelp forests.

David Doubilet

Commercial fishermen landed*
                                                                                about 9.1 billion pounds of
                                                                                fish from waters in the United
                                                                                States in 2000. In addition,
                                                                                recreational fishermen took an
                                                                                estimated 429.4 million fish and

Contents                                                                        kept or released dead an
                                                                                estimated 184.5 million fish

                                         National Geographic Image Collection
                                                                                weighing 254.2 million pounds.
                                                                                Source: NMFS, 2002.

                                         JONATHAN BL AIR
Abstract                                                                                                      ii
      Glossary                                                                                                iii

I. Introduction                                                                                               1

II. General Effects of Fishing                                                                                3
      Extent of Fishing Effects on Target Species                                                             3
      Ecological Consequences of Fishing                                                                      7
      Challenges to Recovery of Overfished Species                                                           11

III. Bycatch                                                                                                 16
      Causes of Bycatch and Effects on Marine Species                                                        16
      Seabirds                                                                                                18
      Marine Mammals                                                                                          19
      Sea Turtles                                                                                             19
      Bycatch Trends and Magnitude in U.S. Fisheries                                                          22

IV. Habitat Disturbance and Alteration                                                                       24
      Significance of the Structural and Biological Features of Marine Habitats                              24
      The Role of Fishing Gear in Habitat Alteration and Disturbance                                         26

V. Perspectives and Recommendations for Action                                                               30
      The Proper Perspective for an Ecosystem-Based Approach to Management                                    31
      Increasing Scientific Capacity for an Ecosystem-Based Approach to Management                            32
      Restructuring the Regulatory Milieu                                                                     34
      Conclusion                                                                                              36

Acknowledgements                                                                                             37

Works Cited                                                                                                  38

*Does not include bycatch and discards
Abstract

     Are the oceans in crisis because of fishing? Perhaps        Understanding the ecological consequences
     they are not. Data from the last decade of United       of exploitation is a necessary component of
     Nations’ reports suggests that global fishing yields    ecosystem-based management, an approach
     have kept pace with increasing fishing effort.          called for by the NMFS Ecosystem Principles
     However, this simple correlation tells little of the    Advisory Panel in a report to Congress in 1999. It
     story. Indeed, the reality of declining yields has      requires (1) knowledge of the total fishing mor-
     been obscured by chronic misreporting of catches,       tality on targeted and incidentally caught species,
     by technological advances in gear that increase the     including mortality resulting from regulatory dis-
     capacity to locate and capture fish, and by shifts      cards and bycatch; (2) investigations of the links
     among industrial fishing fleets toward lower            between species (e.g., predators and prey, com-
     trophic-level species as the top-level predators dis-   petitors) and the habitat within which they
     appear from marine ecosystems.                          reside; and (3) recognition of the trade-offs to
         Do these global realities transfer to the United    biodiversity and population structure within
     States? Yes. They may not transfer at the same          ecosystems that result from high levels of extrac-
     scale, but with the addition of recreational impacts    tion. Current fisheries practice effectively ignores
     of fishing, the elements are consistent. In the 2001    these essential requirements.
     report to Congress on the status of U.S. stocks, the        Based on our review of the ecological effects
     National Marine Fisheries Service (NMFS) found          of fishing, we recommend that ecosystem-based
     that approximately one-third of the stocks for          management incorporate broad monitoring pro-
     which the status was known were either overfished       grams that directly involve fishers; ecosystem
     or experiencing overfishing. Though increasing          models that describe the trophic interactions and
     application of conservative single-species manage-      evaluate the ecosystem effects of fishing; and field-
     ment techniques has begun to improve conserva-          scale adaptive management experiments that eval-
     tion in recent years, it remains that current levels    uate the benefits and pitfalls of particular policy
     of fishing result in significant ecological and eco-    measures. In adopting this approach, it is incum-
     nomic consequences. The combined effects of             bent upon the citizens of the United States to rec-
     overfishing, bycatch, habitat degradation, and fish-    ognize their position as the resource owners, and
     ing-induced food web changes alter the composi-         to properly hold the U.S. government responsible
     tion of ecological communities and the structure,       for management that ensures that benefits are sus-
     function, productivity, and resilience of marine        tained through time. It is also imperative that the
     ecosystems. A discussion of these ecological conse-     regulatory milieu be restructured to include
     quences serves as the basis for this report.            marine zoning designed to reduce management
ii
error and cost, and provide sites for evaluating the to make swift—and perhaps painful—decisions
effects of fishing. The regulatory milieu should without the luxury of perfect knowledge, while
also provide substantive support for law enforce- still grappling for a more thorough understanding
ment by developing enforceable regulations, of the ecological mechanisms driving population
require the use of vessel monitoring systems, and dynamics, structuring communities, and affecting
require permitting and licensing for all fisheries. biodiversity. We must also hold the managers
If we are serious about saving our fisheries responsible when there is inaction. Otherwise, sus-
and protecting the sea’s biodiversity, then we need tained fisheries production is unlikely.
Glossary
Bycatch is the incidental catching, discarding, or damaging of species (typically prey or forage species) are caught.
living marine resources when fishing for targeted species. Three
Fishing mortality is the level of mortality in an exploited popula-
categories of bycatch are:
tion that is attributed to fishing activity or catch.
• Economic discards—species with little or no current economic
Ghost fishing is the mortality of fish caused by lost or discard-
value, such as certain sponges, corals, skates, or targeted
ed fishing gear.
species in poor condition;
Growth overfishing occurs when the fishing pressure concen-
• Regulatory discards—individuals of commercially valuable
trates on smaller fish, which limits their ability to reach their
species discarded for not meeting regulatory requirements
maximum biomass. The loss in biomass due to total fishing
because they are a prohibited species, an illegal size, or the
mortality exceeds the gain in biomass due to growth, resulting
quota for the species has already been filled and the fishery
in a decline in the total yield.
is closed;
Maximum Sustainable Yield (MSY) is the largest average catch
• Collateral mortality—individual species killed through encoun-
that can be captured from a population under existing environ-
ters with active or discarded fishing gear
mental conditions on a sustainable basis.*
(Alverson, 1998).
Overfishing is a level or rate of fishing mortality that reduces
Depensation is a reduction in per capita productivity of a fish
the long-term capacity of a population (that is, an identifiable
population.
separate group within a species) to produce MSY on a continu-
Ecosystem overfishing Fishing-induced ecosystem impacts, ing basis.
including reductions in species diversity and changes in commu-
Recruitment overfishing occurs when the rate of removal of
nity composition; large variations in abundance, biomass, and
the parental stock is so high that it reduces the number of fish
production in some of the species; declines in mean trophic lev-
reaching a catchable size. It is characterized by a greatly
els within ecological systems; and significant habitat modifica-
reduced spawning stock, a decreasing proportion of older fish
tions or destruction. Catch levels considered sustainable under
in the catch, and generally very low recruitment (that is, the
traditional single-species management may adversely affect
survival and growth of young individuals) year after year.
other living marine resources, creating ecosystem overfishing.
Resilience is a measure of the ability of systems to absorb
Eutrophication is an excess supply of organic matter to an
changes and persist. It determines the persistence of relation-
ecosystem—often because of excess nutrient loading.
ships within a system. Thus, resilience is a property of a sys-
A fishery is a targeted effort to catch a species of fish, as well tem, and persistence (or the probability of extinction) is the
as the infrastructure to support that effort. result of resilience (Holling, 1973; NMFS, 2001).
Fishing down the food web refers to systematic removal of the Year-class is a “generation” of fish. Fish of a given species
largest and usually most valuable fish species in a system spawned or hatched in a given year. For example, a three-year-old
(explicitly top-level predators). As a result, smaller, less-valuable fish caught in 2002 would be a member of the 1999 year-class.
* The pitfalls of using this concept as a reference point for managing fisheries are many, including the fact that the maximum sustainable
yield cannot be determined without first exceeding it (overfishing), and that it has been used as a target point rather than a limit. In
addition, what might be deemed a sustainable yield for a single species lacks consideration for the complex relationships existing
between the exploited species and its competitors, prey, and predators. Arguments for both its burial (Larkin, 1977) and its reformation iii
(Mangel, 2002) point to its shortcomings.Flip Nicklin/Minden Pictures
I. Introduction
Gray’s Reef Marine Sanctuary
Marine ecosystems are enormously variable and induced or natural disturbances. Compounding
complex. They are subject to dramatic environ- the problem, but only touched upon here, are the
mental events that can be episodic, like volcanic influences of pollution, climate change, and inva-
eruptions or meteor impacts. On the other hand, sive species (covered in the Pew Oceans
change can occur over far greater time and spatial Commission reports by Boesch et al., 2001 and
scales, such as the advance and retreat of glaciers Carlton, 2001).
during the ice ages. Marine ecosystems maintain This report provides an overview of the eco-
a high degree of biodiversity and resilience, logical effects—both direct and indirect—of cur-
rebounding from disturbances to accumulate rent fishing practices. Among the consequences
natural capital—biomass or nutrients—and sup- are changes in the structure of marine habitats
port sustained biogeochemical cycles (Holling, that ultimately influence the diversity, biomass,
1996; Pauly et al., 1998; NRC, 1999). When loss and productivity of the associated biota (Jennings
of biodiversity precipitates decreased functional and Kaiser, 1998); removal of predators, which
diversity, the inherent unpredictability of the sys- disrupts and truncates trophic relationships
tem increases, resilience declines, and overall bio- (Pauly et al., 1998); and endangerment of marine
logical productivity is reduced (Folke et al., mammals, sea turtles, some seabirds, and even
1996). Given human dependence on natural sys- some fish (NRC, 1998). Fishing can change the
tems to support biological production from composition of ecological communities, which
whence economic benefits are derived, it can lead to changes in the relationships among
behooves us to understand how our activities species in marine food webs. These changes can
affect ecosystem structure and function. alter the structure, function, productivity, and
Using the crudest preindustrial fishing tech- resilience of marine ecosystems (Figure One).
nologies, the human population has derived food The repeated patterns of overfishing, bycatch
from ocean waters, damaged marine habitats, and mortality, and habitat damage are so transparent
overfished marine organisms for millennia that additional science adds only incrementally to
(Jackson et al., 2001). In the last hundred years, further documentation of immediate effect.
the percentage of marine waters fished, the sheer Although it is always possible to find exceptions
volume of marine biomass removed from the sea, to these patterns, the weight of evidence over-
and the pervasiveness of habitat-altering fishing whelmingly indicates that the unintended conse-
techniques has cumulatively eroded marine quences of fishing on marine ecosystems are
ecosystems’ capacity to withstand either human- severe, dramatic, and in some cases irreversible.
1The role of science should be to address these We need to manage fisheries by redefining the
broader ecosystem effects and the interaction of objectives, overhauling the methods, and
fishing with other stressors in order to advance embracing the inherent uncertainty and unpre-
ocean management. dictability in marine ecosystems. This is accom-
We address the policy implications of con- plished by developing a flexible
ventional management approaches and suggest decision-making framework that rapidly incor-
options for reducing adverse ecological conse- porates new knowledge and provides some level
quences to ensure the future values of marine of insurance for unpredictable and uncontrol-
ecosystems. There are management success sto- lable events. The sustainability we seek to sup-
ries, but they appear to be the exception rather port human needs requires resilient ecosystems,
than the rule. What is required is that we come which in turn depend on a high degree of func-
to terms with the natural limits on exploitation. tional diversity (Folke et al., 1996).
Figure One
Ecosystem Overfishing
Fishing directly affects the abundance of marine fish populations as well as the age of maturity, size structure, sex ratio, and genetic makeup of those populations
(harvest mortality). Fishing affects marine biodiversity and ecosystems indirectly through bycatch, habitat degradation, and through biological interactions (incidental
mortality). Through these unintended ecological consequences, fishing can contribute to altered ecosystem structure and function. As commercially valuable popula-
tions of fish decline, people begin fishing down the food web, which results in a decline in the mean trophic level of the world catch.
Fishing
Bycatch
Harvest Physical Impacts •Economic •Regulatory •Collateral
Mortality of Fishing Gear Discards Discards Mortality
Incidental
Mortality
Habitat Modification Discarded Bycatch
or Destruction and Offal
Decline
in Mean
Trophic
Level
Biological Interactions
•Predator-Prey •Competitive •Changes in Marine
Interactions Interactions Food Webs
Altered Ecosystem Structure and Function
Source: Adapted from Pauly et al., 1998; Goñi, 2000.
2II. General Effects
of Fishing
Fishing, even when not extreme, presents a according to reports from the Food and
very predictable suite of consequences for the Agriculture Organization of the United Nations
targeted populations, including reduced num- (FAO). Unfortunately, this led to shortsighted
bers and size of individuals, lowered age of complacency among governments about the
maturity, and truncated age structure. This is state of world fisheries. The more pessimistic
as true for recreational fishing as it is for com- view held that technological advances in gear
mercial fishing. It is also accompanied by a less that enhanced the capacity to locate and cap-
frequently predicted consequence to the ture fish were keeping step to offset declines in
ecosystems in which the exploited populations targeted species, while the exploitation of less
are embedded. We offer here descriptions of favored species subsidized the continued
these fishing effects, and a discourse on the exploitation of the more valued ones.
ability of marine systems to recover from them. However, reports of sustained yield proved
inaccurate. Watson and Pauly (2001) revealed
Extent of Fishing Effects on Target Species that decades of misreported catches obscured
Worldwide, some 25 to 30 percent of all declining yields. In the face of increasing fish-
exploited populations experience some degree ing effort, this signaled an important mile-
of overfishing, and another 40 percent is heavi- stone in which the world fisheries started a
ly to fully exploited (NRC, 1999). Experience decline (Figure Two).
suggests that those populations classified as Fisheries in the United States fare little
fully exploited nearly always proceed to an better. The most recent report on the status of
overfished status (Ludwig et al., 1993). Indeed, U.S. stocks reveals that of the 304 managed
between 1980 and 1990, the number of overex- stocks that have been fully assessed (only 32
ploited populations increased 2.5 times percent of the 959 managed stocks), just under
(Alverson and Larkin, 1994). This is truly an a third are either overfished, experiencing
unfortunate pattern because overfishing is not overfishing, or both—93 out of 304 (NMFS,
a necessary consequence of exploiting fish pop- 2002; Figure Three on page 5). Sixty-five
ulations (Rosenberg et al., 1993). stocks are experiencing overfishing. Eighty-one
Despite increasing levels of fishing effort, stocks are overfished and three more stocks are
the global yield of fish—measured in weight— approaching an overfished condition. Of the
remained relatively constant for decades, overfished stocks, 53 are still experiencing
3Figure Two
Declines in Global Fishery Catches
Decades of inflated catch data have masked serious declines in global yield.
A. El Niño Events B.
90 Corrected 18 Overall Marine
Constant Catch Mandated
Uncorrected 16 EEZ Corrected
Chinese Catch (x 10 tonnes)
85
Global Catch (x 10 tonnes)
Corrected, No Anchoveta 14 EEZ Uncorrected
80
12
6
75
6
10
70
El Niño Events
8
65
6
60
4
55
2
50
45 0
1970
1975
1980
1985
1990
1995
2000
0
1970
1975
1980
1985
1990
1995
2000
“Time series of global and Chinese marine fisheries catches…. A. Global reported catch, with and without the highly variable Peruvian anchoveta.
Uncorrected figures are from FAO; corrected values were obtained by replacing FAO figures by estimates from B. The response to the 1982–83 El
Niño/Southern Oscillation (ENSO) is not visible as anchoveta biomass levels, and hence catches were still very low from the effect of the previous ENSO
in 1972. B. Reported Chinese catches (from China’s exclusive economic zone (EEZ) and distant water fisheries) increased exponentially from the mid-
1980s to 1998, when the ‘zero-growth policy’ was introduced. The corrected values for the Chinese EEZ were estimated from the general linear model
[of fisheries catches].” (Watson and Pauly, 2001)
Source: Watson and Pauly, 2001.
overfishing (65.4 percent of 81 overfished List and 8 stocks considered overfished in 2000
stocks), frustrating efforts to rebuild those and unchanged in 2001—is included in the
depleted stocks. Roughly 31 percent of these overfished category.
overfished stocks—such as queen conch in the The federal government manages some 650
Caribbean; red drum, red grouper, and red additional stocks for which the status is either
snapper in the Gulf of Mexico; black sea bass unknown or undefined. Many of these stocks
in the Mid-Atlantic; and white hake and sum- are considered minor because annual landings
mer flounder in the Northeast—are considered per stock are less than 200,000 pounds, making
major stocks. Major stocks each produce more their commercial value relatively low (though
than 200,000 pound landings per year.* In an they may be important in an ecosystem con-
interesting move, NMFS added to its status text—a more relevant measure to ensure conser-
report a new “N/A” category that includes 57 vation). The fact that relatively few (28 percent)
natural and hatchery salmon stocks from the of the minor stocks that have been assessed are
Pacific Northwest. All of these stocks are listed considered overfished should not lull us into a
as known stocks. Yet, none—including 20 state of complacency. The truth is that we know
stocks that appear on the Endangered Species pitiably little about the status of nearly 81 per-
*In 2001, 295 major stocks produced the majority of landings, totaling more than 8 billion pounds, compared to
9 million pounds from 664 minor stocks.
4Figure Three
LUCIDITY INFORMATION DESIGN, LLC
5cent of these minor stocks, even though they are marine ecosystems. In the Gulf of Mexico, for
fished or perhaps overfished, and we still cannot instance, recreational catches exceed commercial
determine the status of 40.7 percent of the catches for many of the principal species landed
major stocks that produce the vast majority of in that region (Figure Four).
annual landings (Figure Three).
Figure Four
Absence of information should not be con-
Recreational Fishing
strued as absence of a problem. In some cases,
Allocation of total catch (by weight) of the principal finfish species con-
these stocks may even be overfished. History tained in the management plan for the Gulf of Mexico, as defined in the
NMFS Report to Congress on the 2001 Status of Fisheries. Note: We used
reveals that minor stocks have a way of becoming the landings data for the year 2000 to create this graph because the 2001
landings data on recreational fisheries were not available on the NMFS
major ones as other species decline. In addition, website at the time of this writing. The NMFS website notes that the catch
weights for the recreational fishing component are likely underestimated.
many of these minor stocks, including some
100
species of snappers and groupers, have life histo- 90
80
ry characteristics and behaviors that are quite
70
similar to those of closely related overfished 60
Percent
50
stocks. Thus, we can forecast their likely vulnera- 40
30
bility to overfishing.
20
As the status of unknown stocks becomes 10
0
known, undoubtedly some will require manage-
Red Drum
King Mackerel
Gag
Dolphin
Greater Amberjack
Spanish Mackerel
Red Snapper
Red Grouper
Menhaden
ment to end or prevent overfishing (NMFS,
1999). In some regions of the country and for
some important fisheries, this may mean devel-
Recreational Fishing
oping management plans directed primarily at
Commercial Fishing
reducing fishing mortality effected by the recre-
Source: NMFS, 2002.
ational fishing sector. Although the recreational
sector appears to contribute minimally to the Is it Climate or Fishing?
total annual U.S. fishery landings—usually con- What puts populations at greater risk? Is it nat-
sidered to be about 2 percent when landings from ural environmental change or human-induced
Alaska pollock and menhaden are considered— effects? This is the subject of fierce debate in
quite a different picture emerges if one considers nearly every major fishery decline. Certainly,
those populations experiencing both recreational ocean climate shifts are associated with collaps-
and commercial fishing pressures. In these cases, es (Francis, 1986; McGowan et al., 1998;
the recreational fishery can emerge as a very Anderson and Piatt, 1999). Situations in which
important source of mortality for a number of excessive fishing is the principal cause of col-
species, with pressure predominantly exerted on lapse are also certain (Richards and Rago, 1999;
top-level predators rather than forage species in Fogarty and Murawski, 1998). However, severe
6population and fishery declines often involve by removing species that initiate schooling
some combination of environmental and fish- behavior in their prey, making that prey
ing effects (NRC, 1999). While it is academical- unavailable to other predators. For instance,
ly interesting, the continued debate over which seabirds that are less well adapted to diving
is more important only delays implementation depend on subsurface predators such as tuna,
“By its very
of precautionary policy that acknowledges the billfish, and dolphins to make dense prey
nature, fishing
can significantly inherent variation and unpredictability in aggregations available to them at the ocean
reduce the marine ecosystems. surface (Ballance et al., 1997; Ribic et al.,
biomass of 1997). They may lose feeding opportunities
a fish species
Ecological Consequences of Fishing when fishing removes these predators
relative to its
unfished condition.” By its very nature, fishing can significantly (Ballance, personal communication). The
reduce the biomass of a fish species relative to opposite side of this particular coin is that
its unfished condition. Therefore, the most sig- removal of one predator may create additional
nificant ramification may be decreased prey feeding opportunities for others, encouraging
availability for predators in the ecosystem. To their population growth (Tasker et al., 2000).
some extent, fishing concentrated in space and Regardless, these are the first-line symptoms of
time may exacerbate the large-scale reduction disrupted food webs.
in overall biomass, increasing the likelihood of Acquiring information on predator-prey
localized prey depletion (NMFS, 2000; and competitive interactions is essential to
DeMaster et al., 2001). Fishing may therefore understanding the impact of fishing on natural
appropriate fish or other types of biological systems. However, getting the qualitative and
production, forcing dietary shifts among pred- quantitative measures necessary to show a rela-
ators from preferred to marginal prey of lower tionship between these interactions and fishery
energetic or nutritional value. Also, if fishing production presents an enormous challenge,
pressure is sufficiently intense on alternative both logistically and conceptually. Logistically, it
populations that it compromises a predator’s means a significant investment in basic ecologi-
ability to make adequate dietary shifts, the cal study and monitoring. Conceptually, it
result may be reduced foraging opportunities means a change in perspective from a single-
and reduced growth, reproduction, and sur- species approach in which maximum sustain-
vival, as seen in both Humboldt and African able yield is a goal, to acknowledging that
penguins (Crawford and Jahncke, 1999; Tasker fishery production is entirely dependent on
et al., 2000) and suggested for Steller sea lions functioning ecosystems. We are not there yet.
(NMFS, 2000). Although we can reconstruct the cascading
Fishing may indirectly affect trophic links trophic events that led to the decline of kelp
7communities (Box One on page 9), and we can commercially valuable populations (Tyler,
trace the growth of krill populations to a decline 1999). This is a widespread problem occurring
in the whales that consume krill, there are very among groundfish in the Northeast, rockfish on
few other data available on trophic interactions the Pacific coast, reef fish in the Gulf of Mexico,
in marine systems (Pinnegar et al., 2000). At and contributing to severe declines in crus-
“This sequential
best, we rely on inferential and corroborative tacean fisheries in the Gulf of Alaska (Orensanz
or serial over-
evidence to make the case (Pitcher, 2001). et al., 1998; Fogarty and Murawski, 1998). fishing of
Fortunately, ecological models are proving different species
useful in this regard. Kitchell and others (1999) Effects on Marine Food Webs of Removing is characteristic
of overfished
used trophic models of the central North Top-Level Predators
ecosystems.”
Pacific to demonstrate the extraordinarily Another ecological shift among exploited pop-
diverse roles top-level predators play in organ- ulations is the shift from higher trophic levels
izing ecosystems. For instance, they found that to lower ones. That is, subsequent to removing
fishery removals of some large predators— the top-level predators—the larger, long-lived
sharks and billfish—resulted in only modest species—to the point of fishery closure or eco-
ecosystem impacts, such as shifts in their prey. nomic extinction, we then fish for their prey.
However, the removal of other top-level preda- The result? A decline in the mean trophic level
tors like the more heavily targeted fishery of the world catch—a direct consequence of
species—such as yellowfin and skipjack tuna— how we fish, revealed through ecosystem-level
affected entire suites of competitor and prey analyses of fishing.
species for sustained periods and constrained This “fishing down the food web” is a top-
the species that persisted in the system. down ecological problem, having its greatest
documented influence through the removal of
Serial Depletion predators at the peak trophic levels with con-
The next set of ecological ramifications of fish- comitant changes among their competitors
ing involves the shift from prized species to and prey (Pauly et al., 1998). Examples of
related, but perhaps less valuable, species as the truncated trophic webs occur worldwide. In
prized ones decline in abundance. When these the Gulf of Thailand, for instance, the elimina-
less valuable species then decline, fishermen tion of rays and other large, bottom-dwelling
move to yet another species and so on. This fish resulted in a population explosion of
sequential or serial overfishing of different squid (Pauly, 1988). In addition to trophic
species is characteristic of overfished ecosys- shifts, the changes often reveal unexpected
tems (Murawski, 2000). It is a contributing fac- linkages among species not normally consid-
tor in the decline of entire assemblages of ered to interact (Box One on page 9).
8Box One
Kelp Forest Ecosystems: Case Studies in Profound Ecosystem
Alterations Due to Overexploitation
Large seaweeds, such as kelp, which furnish struc- declines result from
ture and food for a highly diverse and productive predation by killer
ecosystem, are typical of hard-bottom habitats in all whales seeking
cold-temperate seas. Their productivity rivals that of alternative prey in a
the most productive terrestrial systems and they are system depleted of
remarkably resilient to natural disturbances. Yet, kelp their normal prey
ecosystems are destabilized to such an extent by the (Estes et al.,
removal of carnivores that they retain only remnants 1998).
of their former biodiversity (Tegner and Dayton, 2000).
In the nor thwest
In the United States, kelp systems occur along the Atlantic, large
Pacific coast and in the nor thwest Atlantic. All have ERIC HANAUER predator y fish—
suffered severe declines because of exploitation that especially halibut,
may have star ted thousands of years ago. In the wolffish, and cod—
Nor th Pacific, aboriginal hunters probably caused the rather than sea
disappearance of the huge kelp-eating Steller’s sea otters are key predators of sea urchins and crabs.
cow as well as population declines in sea otters, and Heavy fishing of these large fish, beginning 4,500
a consequent increase in the number of sea urchins— years ago and peaking in the last centur y, dramatical-
a principal prey of the otters. Without effective control ly reduced their abundance, allowing sea urchin popu-
of their populations by predators, sea urchins often lations to explode and overgraze the kelp (Witman and
completely overgraze the seaweeds. The shift from a Sebens, 1992; Steneck, 1997). More recently, the
carnivore-dominated system to a sea urchin-dominat- sea urchin population has been subjected to intense
ed system triggered the collapse of kelp communities fishing, which, together with widespread diseases,
(Simenstad et al., 1978). Although sea otters recov- has led to the collapse of the population. Left in the
ered to some extent, Russian fur hunters nearly exter- wake, a once productive kelp habitat is now character-
minated the animals through the 1800s. One ized by a community of invasive species with little
hypothesis suggests that more recent sea otter economic value (Harris and Tyrrell, 2001).
Effects on Marine Food Webs of Removing Single-species models, particularly those based
Lower Trophic-Level Species on maximum sustainable yield, suggest that
Lower trophic-level species—like sardines, lower trophic-level species have tremendous
herring, and anchovies—typically mature rap- potential for sustainable exploitation.
idly, live relatively short lives, and are extreme- Ecosystem models, on the other hand, present
ly abundant. As a result, they are among the a more sobering view. First, these models sug-
most heavily exploited species in the world. gest that heavy exploitation could effect
9increased populations of their competitors, Chesapeake ecosystem through the loss from
and declines in populations of their predators. the system of these important filter feeders.
Second, ecosystem models suggest that large Oysters present the best example. Before the
removals of forage species could work syner- mechanized harvest of oysters and the signifi-
gistically with heavy nutrient loading to exac- cant decline of oyster reefs in the late 19th
“…large removals
erbate problems of eutrophication in enclosed century, oysters in the Chesapeake Bay were
of forage species
coastal ecosystems (Mackinson et al., 1997). considered abundant enough to filter a volume could work syner-
Thus, intense harvesting of these species can of water equivalent to the volume of the bay in gistically with
affect ecosystems in two different directions— just three days. Their removal of phytoplank- heavy nutrient
loading to exacer-
from intermediate levels up and from interme- ton and other fine particles from the water
bate problems of
diate levels down. allowed sufficient light penetration to support eutrophication in
extensive seagrass beds. Furthermore, oyster enclosed coastal
Bottom-Up Effects reefs provided habitat for a diverse range of ecosystems.”
There are, in fact, few data revealing bottom-up both benthic and swimming organisms.
interactions resulting from fishing species at Oyster reefs largely disappeared by the
intermediate trophic levels. Suggestive, however, early 20th century. This reduced oyster
are reports that intense exploitation of men- filtration capacity, making the ecosystem
haden negatively affects their predators. more susceptible to algal blooms associated
Menhaden stocks support one of the largest with increased nutrient loading in the bay
fisheries in the southeastern United States. It during the late 20th century. Indeed, it takes
also serves as an important food source for the present-day oyster population six months
many of the top-level predators in marine food to a year to filter the same volume of water
webs—such as mackerel, cod, and tuna. that it once could filter in a matter of days
Population declines associated with intense fish- (Newell, 1988). Restoring oyster biomass to
ing for menhaden* are correlated with body enhance biofiltration and habitat is inhibited
condition declines in striped bass, which, in the by the scarcity of suitable hard substrates—
face of fewer encounters with menhaden, pursue largely removed through unsound harvesting
alternate prey of lower caloric value (Mackinson activities—and disease mortality resulting
et al., 1997; Uphoff, in press). from an introduced pathogen.
Top-Down Effects Cumulative and Synergistic Impacts
The intense exploitation of menhaden to some The cumulative or synergistic contributions of
extent (Gottlieb, 1998; Luo et al., 2001) and of top-down and bottom-up effects on ecosys-
oysters to a greater degree (Boesch et al., 2001) tems can be difficult to detect (Micheli, 1999)
is linked to increased eutrophication of the and equally difficult to tease apart into indi-
*Menhaden stocks have cycled between extreme highs (1950s) to moderate highs (1970s), and extreme lows (1960s) to moder-
ate lows (1980s), resulting in significant fishery cutbacks. However, recent low recruitment levels do not appear to be due to
overfishing. They more likely result from either habitat loss or increased predation (Vaughan et al., 2001; Vaughan et al., 2002).
10
Therefore, reduced fishing mortality may have little to no effect on the recovery in this stock—although it would certainly
leave more menhaden for predators to consume until the stock begins to rebound and fishing mortality could be increased.vidual stresses (Boesch et al., 2001b). Although potential of most exploited populations, and
Micheli (1999) in a recent meta-analysis* of the classic notion that fish compensate for
bottom-up and top-down pressures on marine fishery removals with strong recruitment—
food webs detected changes only across a sin- that is, the per capita production of offspring
gle trophic level, she acknowledged that this could be maximized at low population densi-
“Fishing not only
was more likely because of insufficient infor- ties. Indeed, many species of fish do produce
alters the abun-
dance of stocks, mation about the relationship than it was huge numbers of young, from the relatively
but it also affects absence of an effect. The most important les- short-lived sardines, to grouper that survive
the age of maturi- son derived from these models is that fishing for dozens of years and to the sometimes cen-
ty, size structure,
impacts on ecosystems are diffuse, diverse, and tury-old rockfish. Some fish species also have
sex ratio and
genetic makeup of difficult to predict. remarkable compensatory growth capabilities
populations.” To the list of concerns—fishing, pollution, in the face of exploitation. These characteris-
climate change, eutrophication, and disease— tics led Thomas Huxley to state at the Great
we would add the effects of intensive aquacul- International Fishery Exhibition in London in
ture for consideration in the context of 1884, “…nothing we do seriously affects the
cumulative impacts. Although aquaculture number of fish.”
affects a relatively small amount of acreage in This misperception still haunts fishery
the coastal habitats of the United States management more than 100 years later.
(Goldberg, 1997), it has resulted in significant Fishing not only alters the abundance of
loss of habitat in many developing nations stocks, but it also affects the age of maturity
(Naylor et al., 2000) and it is responsible for (McGovern et al., 1998), size structure
the spread of invasive species worldwide (Hilborn and Walters, 1992), sex ratio
(Naylor et al., 2001). This should serve as a (Coleman et al., 1996), and genetic makeup of
warning to heed as aquaculture develops in the populations (Chapman et al.,1999; Conover
United States. and Munch, 2002). The relationship between
the abundance of spawners in populations and
Challenges to Recovery of Overfished Species the strength of subsequent year-classes of
Fisheries scientists disagree about the ability of recruits is often hard to measure empirically,
marine fish to resist declines in abundance in but it can be both significant and positive
the face of intense exploitation. Although they (Brodziak et al., 2001; Myers and Barrowman,
all acknowledge the problem of growth over- 1996). Thus, recruitment overfishing is not
fishing, some have found no relevant relation- only possible but is largely responsible for the
ship between population size and recruitment, poor condition of stocks that have been man-
making recruitment overfishing unlikely. This aged without regard for maintaining the abun-
view followed from the high reproductive dance of the spawning stock, as indicated in
*Summary statistical analyses across separate studies
11northern cod stocks off the Atlantic coast of
Canada (Myers and Barrowman, 1996; Myers
et al., 1997). Further, in terms of recruit pro-
duction per spawner biomass, some areas are
more productive than other areas (MacKenzie
National Geographic Society
et al., 2002). This important aspect of recruit-
ment variability should be addressed in
ecosystem-based management approaches.
An obvious means of improving spawner
abundance is to reduce fishing mortality.
Gag, Mycteroperca microlepis
However, attempts to effect meaningful
reductions in fishing mortality are often do smaller fish. Unfortunately, models of repro-
compromised by stock assessments that over- ductive output assume that all eggs are equal.
estimate stock size and by political interference It is easy to see where the problem lies for a
that blocks managers from reducing catches. species like gag (Mycteroperca microlepis).
The result is a quota often set too high for Female gags may start reproducing at age 3 or
sustainability (Walters and Maguire, 1996). 4; males at age 8. Gag live for 30 to 35 years,
Spawner abundance can be increased to some giving them a reproductive life span of several
extent by instituting size limits that increase decades. During the time they are reproductive-
the age at which fish are caught, although this ly active, gags more than double their total
method sometimes has significant limitations length. Most of the fish caught, however, are 2
(see pages 17–18). to 5 years old; fish older than 12 years of age
are rarely encountered. Truncating the age
Reduced Reproductive Potential structure of the population means that the
of Populations largest and most fecund fish no longer exist in
An important consequence of the way we fish fished populations.
has been a reduction in the mean fecundity The problem of truncated age structure is
across all age groups and often the disappear- exacerbated in hermaphroditic species. For
ance of the largest, most fecund individuals. instance, gag changes sex from female to male
Larger fish produce far more eggs than smaller when they reach a certain age and size. Thus,
fish, demonstrating an exponential rather than larger gag in spawning aggregations would
linear relationship between fecundity and size. typically be males. Fishing that seasonally con-
In addition, larger fish produce superior eggs centrates on spawning aggregations removes
(e.g., larger eggs that contain greater amounts the largest fish. Over the last 20 years, the sex
of stored energy and growth hormones) than ratio has changed from a historic level of 5
12females to 1 male to a ratio of 30 females to 1 complexity inadequately addressed by most man-
male (Coleman et al., 1996). Stock assessments agement regimes (Johannes, 1981; Coleman et
erroneously treat this declining male-to-female al., 2000).
ratio as though it represents complete loss of
the larger size classes instead of a much more Depensation: Are There Critical Thresholds for
“A spawning
significant loss of an entire sex. Population Size?
aggregation, once
eliminated, may If population size falls below some critical level,
never recover” Aggregating Behaviors Increase per capita reproduction could decline significant-
Vulnerability ly. The causes of this reduction in per capita pro-
Species that aggregate to spawn are often targeted ductivity—known as depensation—are not well
by fishers who know where and when the aggre- understood. Sedentary animals such as abalone,
gations occur (Ames, 1998; Dayton et al., 2000). scallops, clams, and sea urchins need to exist in
Not only are individuals removed from popula- dense patches of closely packed individuals (a few
tions, but also entire aggregations can be elimi- meters apart) to ensure fertilization (Lillie, 1915;
nated. A spawning aggregation, once eliminated, Stokesbury and Himmelman, 1993; Tegner et al.,
may never recover. Intense fishing pressure on 1996; Stoner and Ray-Culp, 2000). These animals
Nassau grouper (Epinephelus striatus) and stop reproducing when density declines. On the
Goliath grouper (Epinephelus itajara) resulted in other hand, reviews of heavily exploited North
the rapid disappearance of many spawning aggre- Atlantic and North Pacific populations by Myers
gations. In 1990, the Gulf, Caribbean, and South and others (1995) and Liermann and Hilborn
Atlantic Fishery Management Councils effected (1997) indicate that, in general, none of the pop-
complete fishery closures for these grouper ulation collapses could be attributed to depensa-
species to protect the remaining populations tion. The life histories of fish species explain this
throughout the United States (Sadovy and difference: the highly migratory species find
Eklund, 1999). The same phenomenon occurred mates; the less mobile species are very vulnerable
in the population of pelagic armorhead to depensation.
(Pseudoentaceros wheeleri), which aggregates on The warm-temperate or tropical species that
seamounts along the ocean floor of the Hawaiian change sex and are fished while spawning are
Islands (Boehlert and Mundy, 1988; Somerton more likely to exhibit depensation. In addition,
and Kikkawa, 1992) and holds true for several ecosystem relationships may play a role in depen-
species of abalones, especially white abalone, now sation. Walters and Kitchell (2001) offer an exam-
perilously close to extinction in southern ple of depensation occurring because of a
California (Tegner et al., 1996). When reproduc- fishery-induced food web shift. In this case,
tive success depends on experienced fish leading declines in abundance of top-level predators lead
novices to breeding sites, the loss of leaders to increased abundance of forage species, which
results in reduced spawning success, another are intermediate-level predators. When they are
13no longer cropped by predation, the forage popu- economically important species. Recovery appears
lations prey upon the juveniles of their predators. to be the rule rather than the exception.
The result is decreased juvenile survival, which Hutchings (2000), however, suggests that recovery
drives down top-level predator populations fur- depends on the individual population’s resilience.
ther. No single-species model could predict these Thus, some species—herring sardines, anchovies,
“…a population
types of consequences. and menhaden—that mature at relatively young
with reduced
ages and feed lower on the food chain, tend to reproductive out-
Increased Susceptibility to respond more rapidly to reduced fishing pressure put is more sus-
Environmental Variation than do species that mature late and live longer. ceptible to
environmental
Fish reproduce in highly variable environments Less resilient species include warm-temperate and
vagaries than one
that can significantly affect reproductive success. tropical reef fishes such as snappers and groupers protected by the
Therefore, a population with reduced reproduc- in the southeastern United States (Polovina and “insurance” of
tive output is more susceptible to environmental Ralston, 1987; Musick, 1999), Pacific Coast rock- large population
size, longevity,
vagaries than one protected by the “insurance” of fish (Leaman, 1991), and deep-sea fishes world-
and diverse age
large population size, longevity, and diverse age wide (Koslow et al., 2000). The marbled rock cod structure.”
structure. In ecosystems where fishing has precip- (Notothenia rossi) fishery of the Indian Ocean, for
itated significant changes in the composition of instance, which collapsed in the 1960s, has not
marine communities, and thus the interactions of recovered to fishable levels despite complete fish-
resident species, uncertainty is introduced that ery closures. Similarly, the wild population of the
confounds our ability to pinpoint cause and black-lipped pearl oyster (Pinctada margaritifera)
effect. This has led many observers to consider in the northwest Hawaiian Islands, which pro-
“cascading” effects, where overexploitation duced more than one hundred tons of catch in
increases the chances that dynamic environmen- 1927, declined to fewer than ten individuals by
tal effects or ecosystem-level changes will interact the year 2000 (Landman et al., 2001; Birkeland,
with fishing to produce collapses, or prevent or personal communication). For whatever rea-
prolong recovery (NRC, 1996). sons—including the possibility of depensation—
this species is virtually extinct in the wild
Reversing Effects of Fishing: Do throughout the entire chain of Hawaiian Islands.
Populations Always Recover? There are some success stories, however.
The ability and speed with which a population The mid-Atlantic striped bass fishery, which
recovers depends largely on the life history char- declined because of recruitment overfishing in
acteristics of the species and the natural history of the early 1980s, recovered in less than 15 years.
the community within which the species is The recovery resulted from implementation of
imbedded. Myers and others (1995) found that fishing moratoria in some states and increased
reduced fishing mortality rates would lead to pop- size limits (effectively raising the age of first
ulation recovery in cod, plaice, hake, and other capture from 2 to 8 years) in other states (Field,
141997; Richards and Rago, 1999).* ecosystem conditions. The list includes northern
Examples of overexploited stock populations right whales, the Hawaiian and Mediterranean
“…changes in
that may be approaching recovery include monk seals, the Pacific leatherback turtle, several
marine communi-
ties that bring Atlantic sea scallops (Murawski et al., 2000), species of California abalone, and fish species
about species some northeastern ground fishes (NOAA, 1999), such as Coelacanths, the Irish ray, the barndoor
replacements Atlantic mackerel, and to a lesser extent, herring skate, bocaccio, and some 82 other marine fish
make recovery
(Fogarty and Murawski, 1998). Scallop recovery species in North America (Musick et al., 2000). In
less likely.”
can be credited to the establishment of large area addition, as Hutchings (2000) clearly points out,
closures. Similarly, northeastern groundfish ignoring the potential for marine fish to go
rebuilding is due to the same area closures and to extinct is inconsistent with U.S. interests in pre-
dramatic reductions in fishing mortality. Atlantic cautionary fisheries management and the conser-
herring and mackerel recoveries appear to result vation of marine biodiversity.
from the combined effects of dramatically lower
fishing pressure and reduced predation pressure Figure Five
resulting from depleted groundfish populations
The Challenge of Rebuilding
such as cod, pollock, and silver and white hake Overfished Stocks
(Fogarty and Murawski, 1998). Illustrating the
125
challenge of successful fishery restoration, most
Target Biomass (%)
100
of those stocks still have a long way to go before 75
they can be considered recovered (Figure Five). 50
25
The Possibility of Extinction 0
d
d
k
k
r
l
r
r
One of the growing concerns is that population tai
de
de
de
oc
oc
Co
Co
ow
un
un
un
dd
dd
ine
k
lo
Flo
Flo
ll
an
a
Ha
collapse could threaten a species’ persistence.
Ye
kH
lF
Ma
sB
ine
tch
er
nd
tai
an
of
ge
int
Certainly, changes in marine communities that
Ma
gla
ow
Wi
sB
or
lf
kW
En
Gu
ll
Ge
of
ge
Ye
bring about species replacements make recovery
an
ew
or
lf
nk
Gu
sB
Ge
nN
a
sB
less likely. This is a complete reversal from the
ge
er
or
ge
uth
Ge
or
once prevailing view that marine species were
So
Ge
immune from extinction. However, the litany of Once abundant off New England’s coast, many groundfish have been
depleted and have only recently begun to rebuild under aggressive conser-
species driven to that state by human activities— vation measures. Though their populations are on the rise, many have a
long way to go before they recover. The famed Georges Bank cod popula-
the Atlantic gray whale, the Caribbean monk seal, tion, for instance, is estimated to be less than a third of the size it was just
20 years ago. Most of the major New England groundfish stocks are cur-
the Steller’s sea cow, and the great auk—has rently below their target population levels, and many are far from approach-
ing the population abundance (target biomass) that would support
removed our naiveté (Vermeij, 1993; Roberts and maximum sustainable yield.
Source: NEFSC, 2002.
Hawkins, 1999). If we desire further evidence, we
Note: The eight species in this graph were selected from the NEFSC report
need only look at the long list of marine animals because they are the principal FMP species listed in the NMFS 2001
Annual Report to Congress on the Status of U.S. Fisheries and the species
considered at risk of extinction under current whose status is known.
*Recovery of striped bass, however, may contribute to low recovery potential in Atlantic menhaden populations.
15 See footnote on page 10.III. Bycatch
“Economics and technology rather than Causes of Bycatch andooi
ecological principles, have determined the
Effects on Marine Species
way an ecosystem is exploited.”
(M. Hall et al., 2000) Bycatch fundamentally results from the limited
selectivity of fishing gear (Alverson, 1998;
The significance of bycatch mortality on NOAA, 1998b). It occurs in active fishing gear.
exploited fish populations and wild popula- It also occurs in gear that is lost at sea but
tions of otherwise unexploited species around continues to fish unattended. Marine species
the world varies widely. Its effect on ecological whose reproductive or foraging behaviors
communities is proving more substantial, as bring them in contact with fishers are particu-
evidenced in a persuasive and growing body of larly vulnerable. These include sea turtles that
literature on the important ecological roles nest on beaches close to shrimping grounds,
played by affected species: “the magnitude, and seabirds, marine mammals, sharks, rays,
complexity, and scope of the bycatch and and other species that share the same prey and
unobserved fishing mortality problem will feeding grounds as the targeted populations.
require priority attention well into the next Other species that are attracted to vessels to
century” (Alverson, 1998). scavenge discards are often accidentally
Bycatch monitoring should be considered caught as well.
an essential component of stock assessment. Species with low reproductive rates suffer
Although monitoring has increased in recent the greatest population-level consequences of
years, it still involves less than one-third of the bycatch mortality. Seabirds, marine mammals,
fisheries in the United States (Alverson, 1998). sea turtles, most sharks and rays, and some
Compiling this bycatch data is critical for two long-lived finfish all fall into this category.
reasons. First, the inclusion of bycatch mortal- Colonial invertebrates, such as sponges, bry-
ity data in fishing mortality analyses provides ozoans, and corals, which have limited disper-
a more realistic assessment of stock health sal capabilities, are also affected. In most cases,
(Saila, 1983). Second, information is necessary the death of these important invertebrates is
to identify potential solutions. This is best never recorded. For species that already have
demonstrated by efforts to reduce the inciden- small populations or limited geographic
tal killing of dolphins in the eastern Pacific ranges, it takes only the loss of a few breeding-
Ocean tuna fishery. age specimens or colonies to have strong nega-
16tive effects on population size and stability. In Discarding is not always based on regulatory
many cases, the underestimation of bycatch limitations. Indeed, high grading can represent
mortality leads to overly optimistic estimates a major source of discards in all fishery sectors
of the environmental impact of fishing as a that are value-based. Here, fish are caught and
whole (Mangel, 1993; Pitcher, 2001). either discarded immediately because of nonex-
“In many cases,
istent market values (commercial high grading),
the underestima-
tion of bycatch Discards of Economically or they are held until they can be replaced with
mortality leads to Important Species larger, more valued fish (commercial or recre-
overly optimistic People are generally more concerned about ational high grading).
estimates of the
collateral mortality caused by the bycatch of Catch-and-release practices—in which fish
environmental
impact of fishing “charismatic megafauna”—marine mammals, are caught purely for sport and intended for
as a whole.” seabirds, and sea turtles—than they are about release—are solely the province of recreational
bycatch of fish and invertebrates. Yet, billions fisheries. Many fishers certainly feel justified in
of finfish, corals, sponges, and other habitat- doing this based on their contributions to tag-
forming invertebrates caught incidentally ging programs, which presumably provide a
every year are damaged or discarded for a vari- service to managers by developing information
ety of reasons. on movement patterns, age and growth, and
Size limits are a significant source of regu- abundance. Tagging programs are particularly
latory discards and subsequent mortality of popular in high-end recreational fishing for
otherwise targeted species in commercial fish- ocean pelagics such as billfish, tuna, and mack-
eries (Chopin and Arimoto, 1995) and recre- erel, but the mortality that results from catch-
ational fisheries. In the commercial Canadian ing and “playing” these large fish for extended
Atlantic cod fishery, juvenile cod discards rep- periods can be substantial and ecologically sig-
resent the removal of 33 percent of the young nificant. Even relatively shallow-water species
fish that would eventually have recruited into can be affected. For example, the mortality
the fishery (Myers et al., 1997). In the com- rates for some of these species ranges from
mercial gag and red grouper fisheries, under- 26 percent in striped bass (Morone saxatilis)
sized fish constitute as much as 87 percent of to 45 percent for red drum (Sciaenops ocellatus)
the total catch (Johnson et al., 1997). To a fish- to as high as 56 percent for spotted sea trout
erman, throwing away otherwise useful fish (Cynoscion nebulosus) (Policansky, 2002).
because of regulatory requirements is perhaps Discards of economically important
the greatest tragedy of single-species manage- species also occur in fisheries not targeting
ment practices. Many fishermen would far those species. For example, discard rates of the
rather see the use of more ecologically sound juvenile stages of red snapper, Atlantic men-
management tools. haden, and Atlantic croaker in the Gulf of
17You can also read