Ecological Integrity of Forests in Tāmaki Makaurau / Auckland 2009-2019. State of the Environment Reporting - Georgianne J. K. Griffiths, Jade ...
←
→
Page content transcription
If your browser does not render page correctly, please read the page content below
Ecological Integrity of Forests in Tāmaki Makaurau /
Auckland 2009-2019. State of the Environment Reporting
Georgianne J. K. Griffiths, Jade Khin, Todd J. Landers,
Grant Lawrence, Miriam R. Ludbrook, Craig D. Bishop
February 2021                       Technical Report 2021/01
Ecological integrity of forests in Tāmaki Makaurau /
Auckland 2009-2019. State of environment reporting

February 2021                                          Technical Report 2021/01

Georgianne J. K. Griffiths
Jade Khin
Todd J. Landers
Grant Lawrence
Miriam R. Ludbrook
Research and Evaluation Unit, RIMU, Auckland Council

Craig Bishop
AUT, Auckland University of Technology

Auckland Council
Technical Report 2021/01

ISSN 2230-4525 (Print)
ISSN 2230-4533 (Online)

ISBN 978-1-99-100202-0 (Print)
ISBN 978-1-99-100203-7 (PDF)
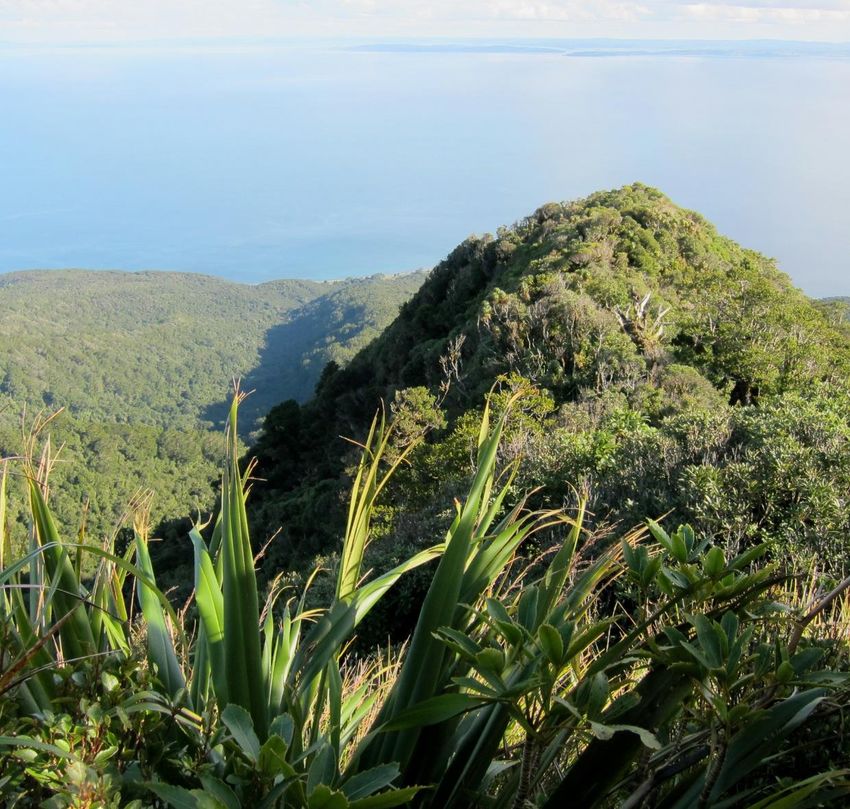
This report has been peer reviewed by the Peer Review Panel.

   Review completed on 5 February 2021
   Reviewed by three reviewers

   Approved for Auckland Council publication by:

   Name: Eva McLaren

   Position: Manager, Research and Evaluation (RIMU)

   Name: Dr Megan Carbines

   Position: Manager, Air, Land and Biodiversity (RIMU)

   Date: 5 February 2021

Recommended citation
Griffiths, Georgianne J. K., Jade Khin, Todd J. Landers, Grant Lawrence, Miriam R.
Ludbrook and Craig D. Bishop (2021). Ecological integrity of forests in Tāmaki Makaurau /
Auckland 2009-2019. State of environment reporting. Auckland Council technical report,
TR2021/01

Cover image credit: View from Te Hauturu-o-Toi. Photograph by Georgianne Griffiths.

© 2021 Auckland Council

Auckland Council disclaims any liability whatsoever in connection with any action taken in
reliance of this document for any error, deficiency, flaw or omission contained in it.

This document is licensed for re-use under the Creative Commons Attribution 4.0
International licence.
In summary, you are free to copy, distribute and adapt the material, as long as you
attribute it to the Auckland Council and abide by the other licence terms.
Executive summary

Forest in the Auckland region covers a wide diversity of ecosystems each with its own
unique complement of indigenous species. Auckland Council conducts long-term
monitoring of the region’s forests as part of its State of the Environment programme to
assess the state and trends in forest ecosystems, in fulfilment of Auckland Council’s
obligations under the Resource Management Act 1991. Information gained is used to
identify issues and inform policy development and environmental decision-making.
Forests have ecological integrity when all the indigenous plants and animals typical of
a region are present and key ecological functions are sustained. Ecological integrity is
described using three elements: ecosystem representation, indigenous species
occupancy, and indigenous species dominance. Change in ecosystem representation
was examined using Auckland Council’s terrestrial ecosystem classification and
mapping, together with geospatial data from the Landcover Database. Species
occupancy and indigenous dominance were examined using 10 years of data from the
network of unbiased, point-based, spatially stratified permanent forest plots in
Auckland Council's Terrestrial Biodiversity Monitoring Programme (TBMP).
At a sub-regional scale there are numerous examples of forest and scrub supporting
diverse indigenous plant communities with healthy forest structures. These are more
common in the large, continuous forest patches with high habitat heterogeneity such
as the Waitākere Ranges, Hunua Ranges and Aotea, and at sites with intensive
conservation management including Tāwharanui, Shakespear and the offshore island
of Te Hauturu-o-Toi. Absence of weed plants is typically a function of low exposure to
propagules (e.g. large forest patch size, distant from rural or urban land, offshore
island) and weed control. Few forests have high native bird species occupancy, which
appears strongly determined by pest animal eradication in fenced or offshore locations.
Native bird communities in unfenced sanctuaries appear to be limited, possibly due to
continuous pest incursions. There are also numerous examples of forest and scrub
with depauperate indigenous plant communities. These are more common in small
forest patches where weeds are most abundant and may outcompete natives and
disrupt normal ecosystem processes. Tāwharanui Regional Park however, illustrates
how the ecological integrity of small forest patches in predominately rural areas can be
improved, albeit with considerable effort.
At a regional scale, the ecological integrity of Auckland's forests is strongly impaired
by the absence or reduced extent of many forest and scrub ecosystem types, the
absence of many native bird species, the widespread abundance of pest animal
species and the frequency of weed incursions. Indigenous forest ecosystems have
been reduced to 23 per cent of their original extent, with some ecosystem types

Ecological integrity of forests in Tāmaki Makaurau / Auckland 2009-2019               1
disproportionately affected. For example, only 16 per cent of kauri, podocarp, broadleaf
forest, two per cent of kahikatea, pukatea forest and 0.3 per cent of pūriri forest remain
(Singers et al 2017). Much remaining forest and scrub has been disturbed and
degraded to such an extent it has been reclassified as regenerating forest and scrub
ecosystem types that did not previously occur in the Auckland region. This assessment
of the ecological integrity of forests in Auckland has long been implicitly understood;
what is new is the use of unbiased quantitative data to examine where and how
ecological integrity is impaired, for those components of wildlife that the TBMP
measures, namely plants and birds.
As New Zealand’s most populated region, Auckland cannot replace all its lost forest
and scrub habitat, but all remaining forest and scrub, however small the fragment,
should be recognised as a precious and highly limited natural resource. Best practice
for forest bird conservation is generally well understood; sustained pest animal
eradication combined with fencing or isolation, native bird reintroductions and
indigenous replanting where necessary, give the best conservation outcomes (Binny
et al 2020). Successful examples of such conservation practices can be seen in Te
Hauturu-o-Toi and Tāwharanui, but these native bird communities need secure forest
to expand into if they are to be sustainable (Lovegrove and Parker in review). Many
conservation groups across the Auckland region conduct intensive forest restoration
and indigenous bird conservation projects, often in collaboration with Auckland Council
and other conservation charities e.g. Forest and Bird. Better ecological monitoring and
analytical support for these community groups could further enhance their
conservation outcomes. This will be necessary if Auckland is to achieve the aim to be
pest-free by 2050 (Pest-free Auckland 2050). Creation, expansion and restoration of
forest habitats may be necessary to maintain the full range of forest and scrub
ecosystem types that once occurred in the region, and provide a buffer against
emerging risks such as myrtle rust and the effects of a changing climate. Ultimately,
forest conservation needs to take a landscape approach; multi-partner initiatives such
as the Northwest Wildlink provide a good example, by maximising the ecological value
of and benefit to small and large forest patches.

Ecological integrity of forests in Tāmaki Makaurau / Auckland 2009-2019                 2
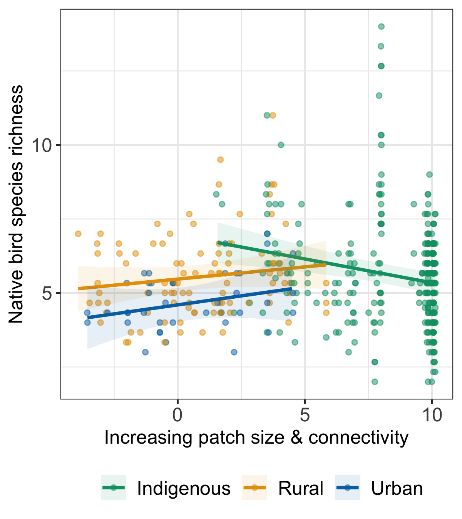
Table of contents

1.0 Introduction ......................................................................................................... 7
   1.1          Habitat loss, fragmentation and degradation ............................................. 7
   1.2          Invasive weeds, pests and pathogens ....................................................... 8
   1.3          Climate change ........................................................................................ 10
   1.4          Policy and monitoring .............................................................................. 11
2.0 Methods ............................................................................................................ 12
   2.1          Measures of forest ecological integrity..................................................... 12
   2.2          Ecosystem representation and landscape structure ................................ 15
   2.3          Terrestrial Biodiversity Monitoring Programme: Forest plot network........ 16
   2.4          Forest plot protocol .................................................................................. 20
   2.5          Analyses .................................................................................................. 22
3.0 Results and Discussion ..................................................................................... 28
   3.1          Ecosystem representation ....................................................................... 28
   3.2          Landscape structure ................................................................................ 33
   3.3          Native plant species richness .................................................................. 39
   3.4          Forest structure........................................................................................ 43
   3.5          Weeds ..................................................................................................... 49
   3.6          Birds ........................................................................................................ 54
   3.7          Pest animals ............................................................................................ 59
4.0 Summary ........................................................................................................... 61
   4.1          Ecosystem representation – are the full range of ecosystems in the region
                being maintained? ................................................................................... 61
   4.2          Species occupancy – are the species present that should be there? ...... 62
   4.3          Indigenous dominance – are the key natural ecological processes being
                maintained by native biota? ..................................................................... 63
5.0 Conclusions....................................................................................................... 65
6.0 Acknowledgements ........................................................................................... 67
7.0 References ........................................................................................................ 68
Appendix A Regional Tier 1 and Targeted Monitoring Areas in Tiers 2 and 3 ........... 78
   A.1          Tier 1: regional forest ............................................................................... 78
   A.2          Tier 2: Aotea (Great Barrier Island).......................................................... 78
   A.3          Tier 2: Hunua Ranges .............................................................................. 79
   A.4          Tier 2: Waitākere Ranges ........................................................................ 79
   A.5          Tier 2: Awhitu (Landcare Trust) ............................................................... 81
   A.6          Tier 2: Kaipara (Landcare Trust) .............................................................. 81
   A.7          Tier 2: Tapora (Landcare Trust) ............................................................... 81

Ecological integrity of forests in Tāmaki Makaurau / Auckland 2009-2019                                                        3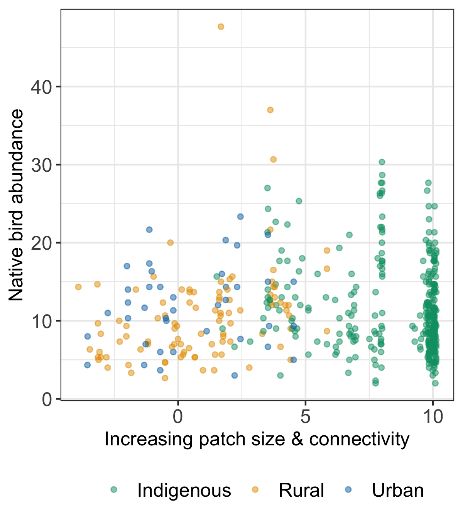
A.8 Tier 2: Tamahunga (Department of Conservation) .................................. 81
A.9 Tier 2: Urban forests ................................................................................ 81
A.10 Tier 3: Te Hauturu-o-Toi .......................................................................... 82
A.11 Tier 3: Kōkako Management Area, Hunuas ............................................. 82
A.12 Tier 3: Ark in the Park, Waitākeres .......................................................... 83
A.13 Tier 3: Shakespear Regional Park ........................................................... 84
A.14 Tier 3: Tāwharanui Regional Park ........................................................... 84
A.15 Tier 3: Inner Gulf Islands ......................................................................... 85
A.16 Tier 3: Glenfern Sanctuary, Aotea ........................................................... 86
A.17 Tier 3: Windy Hill private sanctuary, Aotea .............................................. 87
Appendix B List of species in the text ........................................................................ 88
B1. Native plant species................................................................................. 88
B2. Weed species .......................................................................................... 89
B3. Plant pathogen species ........................................................................... 89
B4. Pest animal species ................................................................................. 90
B5. Insect species .......................................................................................... 90
B6. Reptile species ........................................................................................ 90
B7. Native bird species .................................................................................. 91
B8. Introduced bird species............................................................................ 91
Table of figures
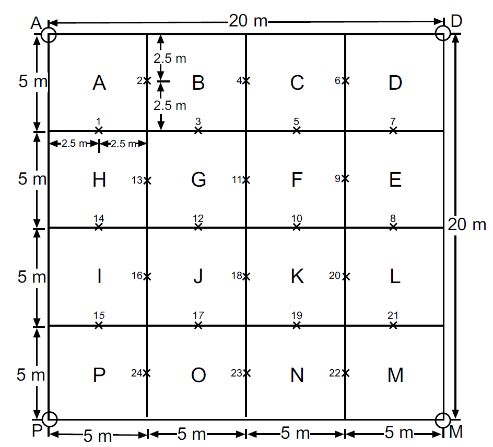
Figure 1: Permanent forest plot layout, showing subplots (A - P) and understorey
plots (1 - 24). ..................................................................................................... 20
Figure 2: The relationship between forest patch size and connectivity (the proportion
of indigenous habitat within a 1000m radius of the plot centre) for all TBMP
forest plots. ........................................................................................................ 23
Figure 3: Distribution of forest patch sizes for each dominant land-use for forest plots
within the TBMP. ............................................................................................... 24
Figure 4: Species accumulation curves against sampling effort (number of plots) for
Regional Tier 1 and targeted monitoring areas in Tiers 2 and 3. ....................... 26
Figure 5: Forest patch-size (ha), connectivity (proportion of indigenous forest in
1000m radius) and proportion of each land-use (indigenous, rural, urban) per
plot for regional Tier 1 and targeted Tier 2 and 3 monitoring areas. For land-use,
proportions do not add to 1 because ‘mixed’ land-use areas were omitted. ...... 33
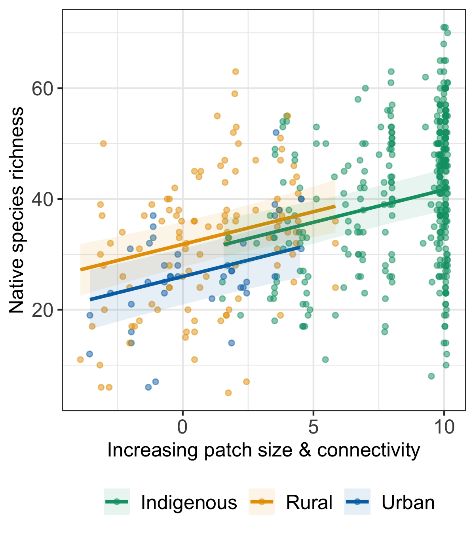
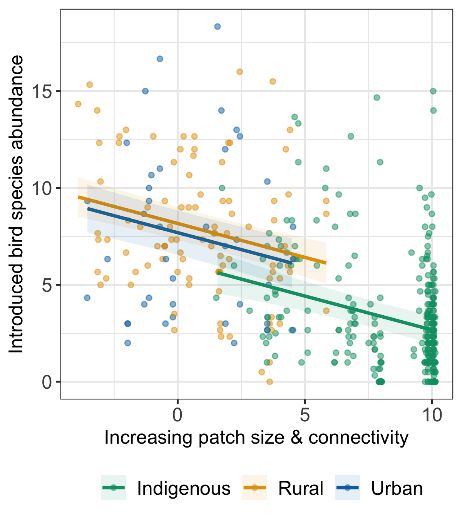
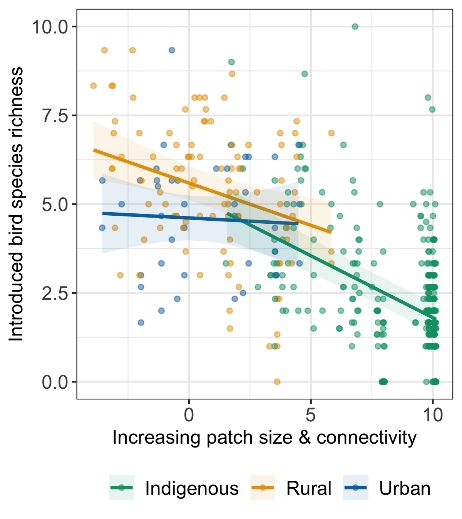
Figure 6: Relationship between the native species richness of forest plots with forest
patch-size, connectivity and dominant land-use type. LMER native species
richness; patch size and connectivity χ2 = 21.0, df=6,9, P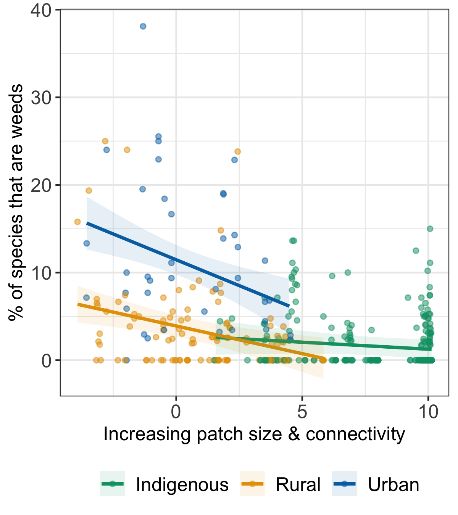
connectivity χ2 = 18.6, df=7,8, P
List of tables

Table 1: Description of the measures calculated using geospatial data and the TBMP
    forest plot network to describe ecosystem representation, native species
    occupancy, and indigenous species dominance of Auckland’s forests. The
    acronyms LAWA and LCDB are defined in the following section 2.2. ............... 14
Table 2: The number of plots from each rotation and in total for Tier 1 regional
    forests, and Tiers 2 and 3 targeted monitoring areas. ....................................... 19
Table 3: Plant, bird, pest measurements taken in fulfilment of forest plot protocol. .. 21
Table 4: The number of plots from each rotation and in total for Tier 1 regional
    forests, and Tiers 2 and 3 targeted monitoring areas. ....................................... 25
Table 5: Area (ha and %) of LAWA Medium Landcover classes in the Auckland
    region. ............................................................................................................... 28
Table 6: Area (ha) of indigenous forest and scrub lost and gained between LAWA
    Medium Landcover classes between 1996 and 2018. ....................................... 29
Table 7: Extent (ha) of historic and current forest and scrub ecosystem types and per
    cent of each historic ecosystem remaining (Singers et al 2017). ....................... 32
Table 8: Alpha (α), beta (β) and gamma (γ) diversity for native plant species richness
    at a (a) monitoring unit scale, and (b) regional scale. Alpha diversity refers to
    mean species richness per plot (α1) or mean species richness per monitoring
    unit (α2). Beta diversity refers to turnover in species richness between plots (β1)
    or between monitoring units (β2). Gamma diversity refers to the species pool or
    total species richness per monitoring unit (γ1) or for Tiers 1 - 3 across the whole
    Auckland region (γ2). ......................................................................................... 41
Table 9: Density of understorey and sapling stems for tawa (Beilschmiedia tawa) and
    taraire (B. tarairi) in Tamahunga, the Kōkako Management Area (Hunuas:KMA)
    and Te Hauturu-o-Toi (Hauturu). ....................................................................... 47
Table 10: Fifteen most abundant sapling weed species recorded in Regional Tier 1
    plots. .................................................................................................................. 51
Table 11: Fifteen most abundant non-woody understorey weed species recorded in
    Regional Tier 1 plots.......................................................................................... 53
Table 12: Comparison of native bird species richness and abundance between plots
    sampled during Rotation 1 (2009-13) and Rotation 3 (2019-23) for the Kōkako
    Management Area (Hunuas:KMA) and Ark in the Park (Waitākeres:Ark).
    Comparison used Welch's t-test with unequal sample size. .............................. 56
Table 13: Alpha (α), beta (β) and gamma (γ) diversity for native and introduced bird
    species richness at a (a) monitoring unit scale, and (b) regional scale. ............ 58

Ecological integrity of forests in Tāmaki Makaurau / Auckland 2009-2019                                                       6
1.0 Introduction Forest in the Auckland / Tāmaki Makaurau region covers a wide diversity of ecosystems each with its own unique complement of indigenous species. These ecosystems support a rich variety of over 20,000 species of native plants and animals (Cameron et al 2001); most are unique to New Zealand and a few are found only in the Auckland region. One of the most intact indigenous forest communities in the Auckland region is found on the offshore island of Te Hauturu-o-Toi (Little Barrier Island), where bird populations continue to fulfil the ecosystem functions of pollination and seed dispersal that many indigenous forest species depend on (Pattemore & Anderson 2012; Anderson et al 2011). For such a large urban centre, the Auckland region is also unusual in retaining several large continuous tracts of indigenous forest in the Waitākere Ranges, Hunua Ranges and on Aotea (Great Barrier Island). These forested areas have been logged for kauri 1 and other timber trees and parts burned or cleared for farming, but there has been significant regeneration and consolidation of forested land since. These large, continuous forested areas now represent a complex and diverse mosaic of mature and successional forest vegetation (Denyer et al 1993). A large proportion of Auckland's forest habitat, however, is found in smaller and more isolated forest fragments, often surrounded by rural or urban land. Examples of unique forest remnants include patches of formerly widespread swamp forest at Omaha and Pakiri, enclaves of indigenous sand forest along the Awhitu and South Kaipara peninsulas, and fragments of lowland taraire forest, such as Kirk’s Bush. Even the Auckland urban area contains many examples of rare forest types. These include remnants of indigenous lava forest at Otuataua and Maungawhau (Mt. Eden), a nationally uncommon vegetation type; pockets of hard beech-kauri forest in the Birkenhead-Chatswood area; and the best example of gumland in the Auckland region at Waikumete Cemetery. The ecological integrity of Auckland’s forests is vulnerable to a range of pressures, the ongoing impacts of habitat loss and fragmentation, exotic weeds, pest and pathogens, and the more poorly understood impacts of climate change. 1.1 Habitat loss, fragmentation and degradation The current patchy distribution of forest and scrub cover reflects the processes of burning, logging, forest clearance, farming and urban development that have taken 1 The Latin binomial, Māori and paheka names of all species referred to in text are listed in Appendix B. The naming convention for flora and fauna in this report uses Māori names for indigenous species where possible, or a combination of Māori, pakeha and/or Latin binomials where necessary. Ecological integrity of forests in Tāmaki Makaurau / Auckland 2009-2019 7
place across the Auckland region since human colonisation, especially in lowland
areas. The destruction of forest habitat is responsible in large part for declines in native
biodiversity, with forest loss considered to have a greater impact on bird communities
than invasive mammals in areas of high deforestation such as lowland Auckland (Innes
et al 2009; Ruffell and Didham, 2017). As forest patches become smaller and more
isolated they are less able to provide the conditions and resources necessary for
indigenous forest species to persist, and are less likely to be recolonised by forest
species when they go locally extinct (Fahrig 2003). Smaller forest patches have a
greater edge to area ratio, and edge effects can be detrimental to forest communities
(Norton 2002; Ewers and Didham 2008), although these transition zones can also be
highly diverse. Adjacent land-uses vary in their ability to provide resources, support
movement of native species between forest patches or expose forest patches to further
pressures. It is increasingly recognised that forest conservation needs to take a
landscape approach (Dӧbert et al 2014); understanding the impact of landscape
structure and surrounding land-use on forest ecological integrity can help to inform
future biodiversity conservation decision-making. For example, the Northwest Wildlink
(www.northwestwildlink.org.nz) aims to connect pest-free or pest-suppressed Hauraki
Gulf islands, peninsulas and open sanctuaries (e.g. Te Hauturu-o-Toi, Tiritiri Matangi,
Tāwharanui, Shakespear) on Auckland’s north-east coast, with the Waitākere ranges
on Auckland’s west coast using a series of wildlife ‘corridors’ and ‘stepping stones’ of
smaller habitat patches.

1.2      Invasive weeds, pests and pathogens

Considerable degradation of Auckland's forests is driven by problematic non-native
species. Forests that are disturbed, fragmented and exposed to human activity
become both more exposed and more susceptible to weeds, pests and pathogens
(Hobbs 2000; Jeschke & Starzer 2018). Adjacent land-use will also vary in the extent
to which it supports reservoirs of weed, pest and pathogen species to colonise
indigenous habitat patches. There are more than twice as many naturalised non-native
plant species compared to native species in the Auckland region (Sullivan et al 2004),
with 226 designated as problematic and listed in Auckland Council's Regional Pest
Management Plan 2020-2030. These 226 weeds are considered capable of having
serious adverse effects on the environment or people. The number of problematic
weed species continues to grow as more invasive species arrive on our shores
(Williams and Cameron 2006; Hulme 2020). Invasive plants pose a threat to more than
half of New Zealand's critically endangered ecosystems and species (Wiser et al
2013). Weed plants can out-complete native species and displace them locally,
affecting the abundance, species richness and local distribution of native flora

Ecological integrity of forests in Tāmaki Makaurau / Auckland 2009-2019                   8
(McAlpine et al 2015). The naturalised flora contains more herbaceous and annual
species, and naturalised trees have a higher leaf nitrogen concentration compared to
the native flora, both of which could influence ecosystem processes such as
decomposition and nutrient cycling (Brandt et al 2021).
The plant pathogens causing kauri dieback and myrtle rust threaten some of the most
iconic tree species in the Auckland region, kauri trees and pōhutukawa respectively.
Myrtle rust threatens a wide range of other important species (Beresford et al 2019)
and many have been reclassified as nationally critical as a result, for example maire
tawake (swamp maire, Lange et al 2012). Potential impacts to forest ecological
integrity from myrtle rust are unknown and changing rapidly; as this report goes to
press, tree mortality caused by myrtle rust has been reported in East Cape, three years
after the pathogen was first detected there, and the first record of myrtle rust in the
Waitākeres has been confirmed. Furthermore, the invasiveness of many non-native
species will be exacerbated by climate change in the Auckland region (Sheppard et al
2016).
More than 80 non-native animals have become established in New Zealand (Craig et
al 2000). In the Auckland region, the severe impacts of rats, mustelids, cats, dogs, the
brush-tailed possum, deer, goats and pigs to native flora and fauna are well
documented. Predatory mammals kill the eggs, nestlings and adults of native birds,
and many predator-sensitive native species such as korimako (bellbird), hihi
(stitchbird), toutouwai (North Island robin), North Island kōkako, kākā and popokatea
(whitehead) can only exist in predator-free offshore or mainland islands (Ruffell and
Didham 2017). Lizards and large invertebrates are also highly vulnerable to predators
(St Clair 2011; Norbury et al 2014). Predatory mammals also impact forest ecosystem
functioning by disrupting bird-mediated pollination and seed dispersal (Pattemore &
Anderson 2012; Anderson et al 2011). Herbivorous mammals browse the young
shoots of native plants and may affect forest composition and regeneration dynamics
(Husheer 2007). As an omnivore, the brush-tailed possum does both (Brown et al
1993; Atkinson et al 1995; Bellingham et al 2016). Less well documented are the
impacts of invasive invertebrates such as wasps and paper wasps. Where these
species are abundant they are known to consume and seriously deplete invertebrate
fauna, particularly butterflies and moths (Beggs et al 2011; Lefort et al 2020a; Lefort et
al 2020b). For example, the disappearance of the forest ringlet butterfly from the
Auckland mainland since the 1990s has in part been attributed to predation by invasive
wasps (Wheatley 2017).

Ecological integrity of forests in Tāmaki Makaurau / Auckland 2009-2019                 9
1.3      Climate change

There is a paucity of knowledge on how changes in climate will impact the ecological
integrity of Auckland’s forests directly, but it is widely agreed the climate emergency
will exacerbate existing problems (Bishop et al 2018; Macinnis-Ng et al 2021). For
example, changes in climate will expand the range and impact of existing invasive
species and provide opportunities for new naturalisations, driving biodiversity losses
(Sheppard et al 2017; Bishop et al 2018; Macinnis-Ng et al 2021). Forest flora and
fauna that already have a reduced distribution and population size from habitat loss
and fragmentation will have limited resilience to changes in climate (McGlone and
Walker 2011). Predictions from NIWA for the Auckland region include increased
temperatures, including the number of hot days (>25°C) per year (Pearce et al 2018).
Changes in temperature can impact the phenology or timing of species and their
interactions, such as the timing and intensity of synchronised mast-seeding events
across multiple plant species (Schauber et al 2002). The length and intensity of both
droughts and extreme rainfall events is expected to increase. Elevated stress from
prolonged low soil moisture will impact native forest flora and fauna. There are few
predictive traits for drought-induced mortality; but small trees are considered more
susceptible than larger trees, and forest on steeper ridges and slopes are more
susceptible, which is where the least disturbed forest is more likely to be found
(Russo et al 2010; O’Brien et al 2017). In the Auckland region, species such as tawa
(Beilschmiedia tawa) and kanono (Coprosma autumnalis) are considered drought
sensitive (Knowles and Beveridge 1982), but there is little comprehensive research.
Droughts will increase wildfire hazard, impacting forest ecosystems that are already
highly fragmented (McGlone and Walker 2011), and potentially changing
successional trajectories to favour fire-adapted non-native taxa (Perry et al 2014).
Finally, sea-levels will continue to rise, with increased frequency and severity of
storm surges, resulting in increased coastal erosion and inundation. Erosion
sensitivity is expected to be higher for Auckland’s east coast, and greater sensitivity
to inundation near estuaries where tidal ranges will be amplified. Some iconic forest
ecosystems in the Auckland region, such as higher elevation kauri, tōwai, rātā,
montane podocarp forest (MF25, Singers et al 2017) and coastal pōhutukawa, pūriri,
broadleaf forest (WF4, Singers et al 2017), are exposed to multiple risk factors
(Bishop et al 2018).

Ecological integrity of forests in Tāmaki Makaurau / Auckland 2009-2019              10
1.4      Policy and monitoring

Auckland Council has made commitments to protect biodiversity, ecosystems and their
services through the Indigenous Biodiversity Strategy 2012 and the Auckland Plan
2050, and these are strongly supported by the proposed National Policy Statement on
Indigenous Biodiversity 2020 (Ministry for the Environment 2019). Key to protecting
indigenous biodiversity is knowledge, and the Indigenous Biodiversity Strategy
includes an objective to 'improve our knowledge and understanding of biodiversity in
the region in order to protect and manage it more effectively'. Auckland Council started
a Terrestrial Biodiversity Monitoring Programme (TBMP) in 2009 to monitor forests,
wetlands and dunes in the Auckland region as part of State of the Environment
monitoring requirements under Section 35 of the Resource Management Act 1991. In
2017 Auckland Council published a systematic classification of its terrestrial ecosystem
types, for which historic and current distributions across the Auckland region have
been mapped (Singers et al 2017). In this report, 10 years of data from the network of
permanent forest plots in the TBMP, together with historic and current distributions of
ecosystem types and geospatial data, are analysed to examine forest ecological
integrity across the region and within targeted monitoring areas.

Ecological integrity of forests in Tāmaki Makaurau / Auckland 2009-2019              11
2.0      Methods

2.1    Measures of forest ecological integrity

Ecological integrity is the key concept underpinning conservation in New Zealand,
defined as the full potential of indigenous biotic and abiotic features and natural
processes, functioning in sustainable communities, habitats and landscapes (Lee et al
2005). The term can be measured at multiple spatial scales, from ecosystems, to
regions, to a national level. Defining ‘full potential’ is somewhat subjective
(Schallenberg et al 2011) and is often determined by comparison to a reference state,
which may be historic or a pristine or near-pristine extant ecosystem (Wurtzebach &
Schultz 2016). Neither are perfect; knowledge of an historic state is complicated by
many factors including climate change, disturbance, ecological memory or shifting
baselines, where returning to historic conditions is no longer feasible. Using pristine or
near-pristine extant ecosystems allows these changes to be accounted for, but the
omnipresence of pest animals and their ecological impacts means that even where
primary forest undisturbed by clearance or logging exists, forest ecological integrity is
likely to be impaired. For much of the Auckland region there is a good understanding
of the historic distribution of the common and dominant flora and fauna. The Singers
et al (2017) historic ecosystem type geospatial layer provides a more detailed and
spatially explicit reference point for what ecosystems should exist in the absence of
human activity.
In defining ecological integrity, Lee et al (2005) state, ‘at its simplest, ecosystems have
ecological integrity when all the indigenous plants and animals typical of a region are
present, together with the key major ecosystem processes that sustain functional
relationships between all these components. At larger scales, ecological integrity is
achieved when ecosystems occupy their full environmental range’. McGlone et al
(2020) state that ‘all that is necessary for good ecological integrity at small scales is
that the indigenous biota typical of a region dominates, at larger spatial scales, the
more important absences become. Ecological integrity at a regional level must be
regarded as impaired if species that should be present are sparse or totally absent’.
The term ecological integrity is now widely used in policy and legislation and is a
reporting requirement in the New Zealand Environmental Reporting Act 2015.

Ecological integrity of forests in Tāmaki Makaurau / Auckland 2009-2019                 12
Three core elements define ecological integrity, which if satisfied, provide the best
guarantee that ecological integrity is being achieved (Lee et al 2005):
1.    Ecosystem representation – are the full range of ecosystems in the region being
maintained and how are they structured within the landscape?
2.     Species occupancy – are the species present that should be there?
3.    Indigenous dominance – are the key natural ecological processes being
maintained by native biota?
This report will address these three core elements of ecological integrity using a series
of measures derived from current and historic ecosystem maps, geospatial data and
10 years of the TBMP forest plot network (Table 1). These measures are aligned with
indicators developed for the Department of Conservation (Lee and Allen 2011; the
Department of Conservation Outcome Monitoring Framework, www.doc.govt.nz/omf)
and regional councils (Bellingham et al 2016).

Ecological integrity of forests in Tāmaki Makaurau / Auckland 2009-2019               13
Table 1: Description of the measures calculated using geospatial data and the TBMP
forest plot network to describe ecosystem representation, native species occupancy,
and indigenous species dominance of Auckland’s forests. The acronyms LAWA and
LCDB are defined in the following section 2.2.

Ecological integrity of forests in Tāmaki Makaurau / Auckland 2009-2019           14
2.2      Ecosystem representation and landscape structure

Information on ecosystem representation is obtained from the Landcover Database
(LCDB v5.0 2020) and the classification of New Zealand’s terrestrial ecosystems
(Singers & Rogers 2014; Singers et al 2017). The LCDB uses analysis of satellite
imagery to differentiate Auckland’s landscape into 29 different types of land cover (33
across New Zealand) and provides spatial distribution and changes over time. Version
5 of the Database, contains the latest land cover data from late 2018, and previous
land cover data from summertime 1996/97, 2001/02, 2008/09 and 2012/13. Land, Air
and Water Aotearoa (LAWA) have grouped detailed land cover types into 11 medium
cover classes, as defined in the LAWA data portal classification hierarchy
(www.lawa.org.nz). In this report we examine and compare changes in landcover
between 1996 and 2018 for the LAWA Medium Landcover classes using data
accessed on 30/01/2020.
The classification of New Zealand’s terrestrial ecosystems identifies 36 terrestrial and
wetland ecosystems in the Auckland region (Singers & Rogers 2014; Singers et al
2017). The historical (predicted pre-human) and current distribution of all 36 terrestrial
and wetland ecosystems have been mapped and published as geospatial layers by
Auckland Council (www.aucklandcouncil.govt.nz/geospatial/geomaps). The historic
distribution is based on a wide range of data sources described in Singers et al 2017.
Knowledge of the current extent is based on ecological surveys of 2000 sites and
previous surveys by Auckland Council, Department of Conservation, Crown Institutes
and academics. Auckland Council continues to refine maps of current extent as new
data becomes available. Historic and current ecosystem types do not include the built
environment. We examined changes in extent for forest and scrub ecosystem types
between the historic and current ecosystem geospatial layers.
Ecological integrity arising from ecosystem representation is defined not just by its
extent, but also how it is structured in the landscape. Measures of landscape structure
(patch-size, connectivity, dominant land-use) were calculated for each permanent
forest plot within Auckland Council's TBMP forest plot network using LCDB data from
2018 2. The patch size (ha) of the habitat in which a plot is located was based on the
total area of continuous vegetation represented by classified polygons (regardless of
indigenous or exotic origin). Of the 29 land cover classes found in Auckland, nine
classes were used to define habitat patches (broadleaved indigenous hardwoods,

2
 The TBMP, established in 2009, was not designed to sample ecosystem types defined by Singers et
al in 2017 and does not represent a balanced or complete coverage of Auckland's forest and scrub
ecosystem types. The TBMP plot network covers 25 ecosystem types, including 16 that are forest and
scrub.

Ecological integrity of forests in Tāmaki Makaurau / Auckland 2009-2019                         15
fenland, flaxland, herbaceous freshwater vegetation, herbaceous saline vegetation,
indigenous forest, mangrove, manuka and/or kanuka, matagouri or greyscrub). The
habitat patch size was calculated by merging contiguous polygons of the specified
classes and retrieving the sum area of the final polygon for each plot, in some cases
multiple plots are located in the same habitat patch. The proportion of indigenous land
within a 1000m radius of the plot centre was used as an area-based proxy for
connectivity. This measure has been shown to perform better than several other
measures including distance to nearest neighbour (Bender et al 2003). Finally, a
categorical variable describing the dominant land-use (rural, urban, indigenous or
mixed) was devised based on the dominant land-use within a 1000m radius of the plot
centre (a land-use was dominant when it covered ≥0.5 of the landcover by proportion,
Ruffell & Didham 2017).

2.3      Terrestrial Biodiversity Monitoring Programme: Forest plot
         network

The TBMP forest plot network uses a grid-based systematic sampling approach
centred around permanent 20 x 20m vegetation plots. The 20 x 20m vegetation plot
has a long history in New Zealand. From the 1950s to 1980s they were used to monitor
harvestable forest resources and other pressures (Wiser et al 2001). In the latter part
of the 20th century the focus changed and permanent 20 x 20m plots formed the basis
of biodiversity and carbon monitoring and reporting nationally (McGlone et al 2020).
The national New Zealand Carbon Monitoring System was based on >1000 permanent
plots on an 8-km-grid across New Zealand’s indigenous forest and scrub (Payton et al
2004). An 8 x 8km grid was chosen to achieve a sample size sufficient to produce a
national estimate of carbon storage in indigenous forest and shrubland with a statistical
precision of 5% around the mean (Bellingham et al 2020).
In the Auckland region, the TBMP network of plots is designed around nested spatial
scales ranging from regional plots (Tiers 0 and 1), targeted monitoring areas (Tiers 2
and 3) to localised, site-specific studies (Tier 4). Tier 0 and Tier 4 plots are omitted
from this report; Tier 0 is a nationally implemented plot network designed to measure
any vegetation type within a grid square, not just forest, while Tier 4 plots were
established to address specific research questions. To generate a sufficient regional
(Tier 1) sample size the national 8 x 8km grid was split into four quarters, and plots
allocated to alternate 4 x 4km grid squares. Plots were located in the nearest suitable
patch of forest closest to the centroid of each selected square. For each plot, a
randomly selected plot corner had to be at least 20m from any edge, this limited the

Ecological integrity of forests in Tāmaki Makaurau / Auckland 2009-2019               16
minimum patch size suitable for sampling to around one hectare. Where forest patches occurred on public land, permission to establish a permanent plot was typically granted. Permission to establish a permanent vegetation plot on private land could not always be obtained. If this was the case, the next nearest suitable forest patch for which permission could be obtained was used. On occasion, no other suitable patches of forest occurred in that square or no permission was granted, in which case no plots could be established in that square. In total 134 permanent forest plots have been established forming the Auckland region Tier 1 monitoring network, designed to monitor and report on the state and trends in the region’s forest and scrub (Map 1). Ecological integrity of forests in Tāmaki Makaurau / Auckland 2009-2019 17
Map 1: The network of Tier 0 - 4 permanent forest plots in the Terrestrial Biodiversity
Monitoring Programme.

The alternate 4 x 4km grid scale generates sufficient plots to report regionally, but
insufficient plots to calculate estimates of forest ecological integrity within more
localised areas. In addition to the state and trend Tier 1 plots, further permanent forest
plots have been established at greater spatial resolution within targeted monitoring

Ecological integrity of forests in Tāmaki Makaurau / Auckland 2009-2019                   18
areas to better describe the ecological integrity of these forests. These Tier 2 and Tier
3 plots differ only in the spatial scale at which they were established. Tier 2 plots were
established using a 2km grid to measure ecological integrity in large tracts of
indigenous forest on Aotea (Great Barrier Island), in the Hunua and Waitākere Ranges;
at high conservation value sites at Tapora, Kaipara, Awhitu and Tamahunga; and in
urban areas (inside the Metropolitan Urban Limit) where indigenous biodiversity is
considered to be under high pressure from external threats (e.g. high habitat loss,
fragmentation and degradation resulting from urban development, Map 1). Tier 3 plots
were established on a variable grid scale always
2.4      Forest plot protocol

At each permanent plot, a standardised protocol is followed based on the ‘standard’
20m x 20m permanent plot protocol (Hurst & Allen 2007), but with some adaptation.
Using this standard method ensures our forest monitoring is best practice and makes
Auckland data comparable with information from across New Zealand. The aim of the
protocol is to capture as complete a snapshot of the forest structure, composition and
life stages as is feasible, given limited resources. At each location, the 20 x 20m
permanent plot is marked out, and sub-divided into 16 5 x 5m subplots (labelled A - P)
using measuring tapes and 24 1m2 understorey plots (labelled 1 - 24, Figure 1).

Figure 1: Permanent forest plot layout, showing subplots (A - P) and understorey plots
(1 - 24).
Once the 20 x 20m permanent plots are laid out, plants are measured in standardised
ways as described in Table 3. Birds are monitored at each plot using three 10 minute
bird counts with a detection probability and a distance sampling component (Landers
et al 2021). At a subset of TBMP forest plots, possum, rat and mice populations are
monitored using chew cards. Deployment of chew cards ceased in 2016 due to funding
cuts; a review of pest monitoring as part of the TBMP is planned in 2021. Full details
of the forest plot protocol for Tiers 1 to 4, and Tier 0 are available (Forest Monitoring
Protocol SOE Version 5.08).

Ecological integrity of forests in Tāmaki Makaurau / Auckland 2009-2019               20
Over the years, small changes in the protocol have been made to address gaps in data
collection. For example, unlike the NVS plot protocol, in 2009 when the TBMP was first
established trees within plots were not tagged. This decision was revisited in 2016
once sufficient data had been collected, and tree tagging on all existing and new plots
was introduced.
Table 3: Plant, bird and pest measurements taken in fulfilment of forest plot protocol.
Measures Description
Meta-data such as is colleceted for RECCE plots in the NVS (Hurst & Allen 2007), e.g.
Meta-data aspect, altitude, ground cover, canopy height, canopy cover, ground cover, history,
evidence of clearing/logging, etc.
A number of condition scores are collected based on the plot interior and immediate
surrounding forest. Conditions measured include canopy dieback, understorey
Forest condition
vegetation, weeds, fencing or stock access, mammal pests and whether the plot is
representative of the surrounding forest.
The species and diameter (at 1.35m height) of individual trees is measured per subplot,
for tree ≥1.35m tall and ≥2.5 cm diameter. All trees meeting these criteria are now
Tree diameter
tagged. This measure gives both the diameter and number of trees per subplot. Tree
diameter is used to calculate tree basal area per plot.
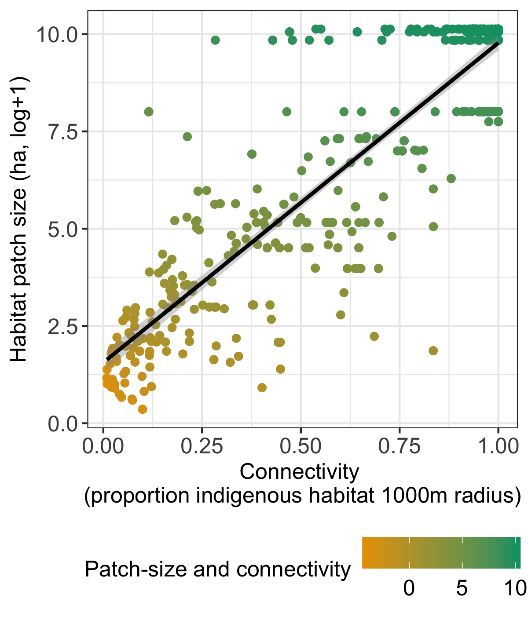
For saplings ≥1.35m tall and2.5 Analyses Summary statistics are used to describe patterns and changes in LCDB data using LAWA Medium landcover classes, historic and current ecosystem extent. Measures of ecological integrity (e.g. native plant species richness) were modelled against measures of landscape structure (e.g. patch-size, connectivity and dominant land-use) using linear mixed-effects models (Gelman & Hill 2006). All samples of all plots from all tiers were used in the analysis to maximise the sample size. Since the data were not designed to test these variables in a balanced way, a number of factors need to be controlled or accounted for as random effects that will introduce natural variation in ecological integrity measures. Random effects included a factor describing plot identity to account for temporal autocorrelation between resamples, year sampled to account for natural variation between years and ecosystem type due to natural variation between forest and scrub ecosystem types. Mixed-effects models were used to partition the variance between random effects (plot, year and ecosystem type) and our fixed effects of patch-size, connectivity and dominant land-use. Significance of fixed effects and their interactions was tested using likelihood ratio tests using the chi- squared distribution. Analyses were performed using R 4.0.2 and the mixed effects package lme4 (Bates et al 2015). 'Mixed’ land-use plots (those plots with a 1000m radius without >0.5 indigenous, rural or urban land-use) were dropped from the analyses as they performed in direct relation to their proportion of different land-uses and did not add further to our understanding of land-use impacts on ecological integrity. Patch size and the proportion of indigenous habitat within a 1000m radius were found to be strongly, positively correlated (Pearson's = 0.88, t=42.9, df=561, P
Figure 2: The relationship between forest patch size and connectivity (the proportion
of indigenous habitat within a 1000m radius of the plot centre) for all TBMP forest
plots.

As expected, patch-size also varied with land-use, with smallest patch-sizes in rural
and urban landscapes, and larger forest patches in more indigenous landscapes
(Figure 3). Mean forest patch size was 14,619 (± 565) ha in indigenous landscapes,
120 (± 42) ha in rural landscapes and 57 (± 14) ha in urban landscapes.

Ecological integrity of forests in Tāmaki Makaurau / Auckland 2009-2019             23
Figure 3: Distribution of forest patch sizes for each dominant land-use for forest plots
within the TBMP.

Summary statistics (mean ± 1 standard error) were used to compare patterns in
measures of ecological integrity across regional Tier 1 and targeted monitoring areas
in Tiers 2 and 3. Comparisons used the most recent sample of each plot in Tiers 1 - 3
from 10 years of TBMP forest plot network data (Table 4). The regional Tier 1 data
provides an overview of regional forest ecological integrity across a wide range of
environmental contexts (e.g. ecosystem types, history, management, patch size, etc).
Areas in Tiers 2 include large continuous forest, areas of high conservation value, and
urban forest. Areas in Tier 3 have considerable conservation management
intervention, including pest suppression or eradication, weed control, replanting and/or
bird translocations.
Formal hypothesis testing to compare sites was not used because the magnitude of
differences that occur between regional and targeted monitoring areas precludes any
single hypothesis. For example, areas are sampled from different parts of the region
and with different geographical extents, from forests that vary in their history of logging
or disturbance, past and present management, soil and ecosystem type, local climate,
age, proximity to indigenous forest, exposure to invasive species, surrounding land-
use, etc. All these variables will contribute to current ecological integrity in ways that
may be confounding or hard to unpick (Lee et al 2005). When examining patterns
amongst regional and targeted monitoring areas, there were insufficient degrees of
freedom to formally account for variation in sampling, climate, soils or ecosystem types.

Ecological integrity of forests in Tāmaki Makaurau / Auckland 2009-2019                 24
Table 4: The number of plots from each rotation and in total for Tier 1 regional forests,
and Tiers 2 and 3 targeted monitoring areas.

Three components of species diversity or richness can be measured using the TBMP
plot network, alpha (α), beta (β) and gamma (γ) diversity. These three components can
be additively partitioned (gamma = mean(alpha) + beta, Lande 1996) at different
spatial extents (Crist et al 2003). Alpha(α), beta (β) and gamma (γ) diversity are
additively partitioned at two spatial extents, within monitoring units and across the
Auckland region, using the TBMP indigenous plant and native bird composition data.
Measurements within monitoring units are mean native species richness per plot (α1),
turnover in species between plots (β1) and total native species richness for each
monitoring unit (γ1). Measurements across the region are mean native species richness
per monitoring unit (α2), species turnover between monitoring units (β2) and how they
contribute to the Auckland region species pool (γ2).

Ecological integrity of forests in Tāmaki Makaurau / Auckland 2009-2019                25
Measurements of species richness, especially γ diversity are in part a function of the
sampling effort, in this case the number of plots. To assess whether the sampling effort
was adequate to report on γ diversity, native plant species accumulation plots were
constructed to assess how much of the native plant species pool is recorded given the
sampling effort (number of permanent plots sampled). When a species pool is fully
sampled, the number of new species recorded with each new plot diminishes and the
species accumulation curve flattens out. Species accumulation curves indicate that for
all monitoring units, the full species pool has not been recorded and new species
continue to be recorded with each new plot (Figure 4). For most monitoring units
however, the species accumulation curves are starting to level out. This gives some
certainty that monitoring captures a reasonable and similar proportion of the full plant
species composition for most Tier 1-3 monitoring units. The exception to this is Awhitu
(the shortest curve on the plot), with only 4 plots the species accumulation curve shows
no sign of levelling out, and estimates of α, β and γ diversity do not adequately
represent this targeted monitoring area. The regional Tier 1 species accumulation
curve is based on the full complement of 134 plots; fewer native plants would be
sampled by the 56 Tier 1 plots currently included in regular remeasures.

Figure 4: Species accumulation curves against sampling effort (number of plots) for
Regional Tier 1 and targeted monitoring areas in Tiers 2 and 3.

Ecological integrity of forests in Tāmaki Makaurau / Auckland 2009-2019               26
Native tree size-class distributions based on stem diameter (DBH, or diameter at breast
height (1.35m)), were calculated for each monitoring unit. All DBH measurements were
standardised between the minimum stem diameter of 2.5cm and the 99.9th percentile
and divided into 20 equal-sized bins. The frequency of stems per bin were expressed
as a percentage relative to the total for each monitoring unit. All analyses were
performed using R software version 4.0.2.

Ecological integrity of forests in Tāmaki Makaurau / Auckland 2009-2019             27
3.0      Results and Discussion

3.1    Ecosystem representation

The most recent measure of landcover data (LCDB 2018) shows indigenous forest and
scrub habitat covers 26% of the Auckland region. The largest landcover category was
exotic grassland at 45%, while urban areas cover 11% and exotic forest 10% (Table
5).
Table 5: Area (ha and %) of LAWA Medium Landcover classes in the Auckland region.
                LAWA Medium Landcover classes                 ha    % of total
                Exotic grassland                          233,244        45.4
                Indigenous forest                          88,595        17.3
                Urban area                                 57,312        11.2
                Exotic Forest                              51,759        10.1
                Indigenous scrub/shrubland                 44,188         8.6
                Water bodies                               14,675         2.9
                Cropping/horticulture                      12,147         2.4
                Natural bare/lightly-vegetated surfaces     4,063         0.8
                Other herbaceous vegetation                 3,394         0.7
                Exotic scrub/shrubland                      2,208         0.4
                Artificial bare surfaces                    1,750         0.3

Although there has been minimal net change in indigenous forest cover since 1996,
this masks an equivalent gain and loss of approximately 700ha. Table 6 shows the
breakdown in the area (ha) lost and gained to indigenous forest and scrub landcover
classes. Existing indigenous forest and scrub was removed to make way for exotic
forest, exotic grassland and urban development. Newly created indigenous forest and
scrub came from land that had previously been exotic forest or grassland. Loss of
indigenous forest and scrub is relevant since mature ecosystems will typically support
greater biodiversity, including more specialised species unable to survive elsewhere.

Ecological integrity of forests in Tāmaki Makaurau / Auckland 2009-2019            28
Table 6: Area (ha) of indigenous forest and scrub lost and gained between LAWA
Medium Landcover classes between 1996 and 2018.
Losses and gains (ha) between 1996 and 2018
LAWA Medium Landcover classes Losses from Gains to Losses from Gains to
indigenous indigenous indigenous indigenous
forest forest scrub scrub
Artificial bare surfaces 71 29 4
Cropping/horticulture 1 6
Exotic Forest 233 324 130 187
Exotic grassland 116 388 121 632
Exotic scrub/shrubland 14 6
Indigenous forest 3 15
Indigenous scrub/shrubland 15 3 24
Natural bare/lightly-vegetated surfaces 3 17 1
Other herbaceous vegetation 57
Urban area 122 10
Water bodies 2 13
Total 619 752 325 851
Net gain 133 526
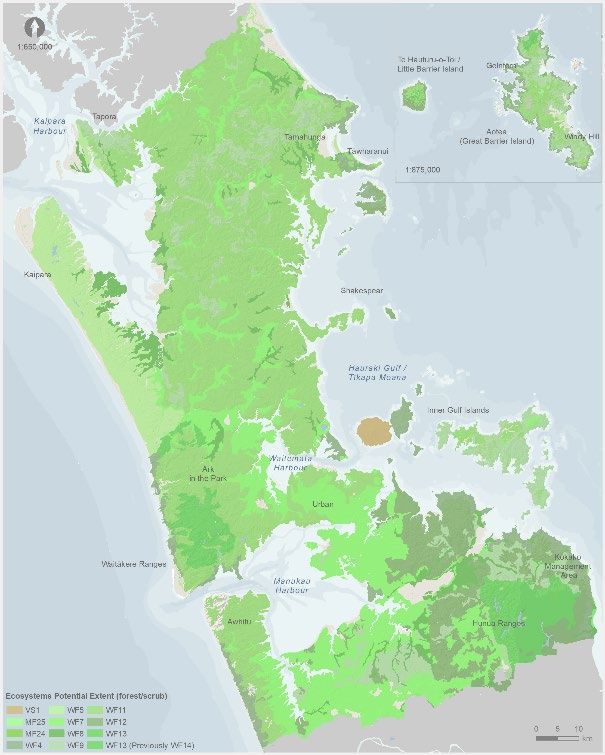
Map 2 shows the historic dominance of forest ecosystem types across the Auckland
region. Map 3 shows the current distribution of forest and scrub ecosystem types for
the Auckland region. Indigenous forest and scrub continue to be the most widespread
indigenous ecosystem types but have been reduced to 23% of their original extent.
This represents a massive loss of habitat for forest dwelling flora and fauna.
For remaining forest and scrub, there have been distinct changes in ecosystem
composition. There has been a massive reduction in the extent of previously dominant
forest ecosystem, especially those typical of lowland areas. Indigenous forest types
that lost more than 80% of their original cover include pūriri (WF7), kahikatea, pukatea
(WF8), tōtara, kānuka, broadleaf (WF5), kauri, podocarp, broadleaf, beech (WF12),
kauri, podocarp, broadleaf (WF11), taraire, tawa, podocarp (WF9) and pōhutukawa,
pūriri, broadleaf (WF4, Table 7). Pūriri (WF7) forest has been reduced to 0.3% of its
original extent, kahikatea, pukatea (WF8) to 2% of its original extent. In addition, for
the remaining forest and scrub, 37% of it has been disturbed and degraded to such an
extent it has been reclassified as regenerating forest and scrub ecosystem types that
did not previously occur in the Auckland region. The one exception to this is the
representation of pōhutukawa scrub/forest (VS1) which is essentially unchanged and
found predominately on Rangitoto island. There has been a massive increase in
kānuka (VS2), mānuka/kānuka (VS3) and broadleaved species (VS5). Finally, a further
14% of it has been converted to anthropogenic or novel forest and scrub ecosystems
such as exotic forest and scrub, planted forest/scrub, treeland and anthropogenic
Ecological integrity of forests in Tāmaki Makaurau / Auckland 2009-2019 29You can also read