ECOLOGICAL RELATIONSHIPS AT A NEAR-NATURAL TREELINE, ROLWALING VALLEY, NEPAL HIMALAYA: IMPLICATIONS FOR THE SENSITIVITY TO CLIMATE CHANGE - erdkunde
←
→
Page content transcription
If your browser does not render page correctly, please read the page content below
2020                                                                                                     Vol. 74 · No. 1 · 15–44

             ECOLOGICAL RELATIONSHIPS AT A NEAR-NATURAL TREELINE,
              ROLWALING VALLEY, NEPAL HIMALAYA: IMPLICATIONS FOR
                      THE SENSITIVITY TO CLIMATE CHANGE

                    Niels Schwab, K arolina Janecka, Ryszard J. K aczka, Jürgen Böhner,
                       R am Prasad Chaudhary, Thomas Scholten and Udo Schickhoff
                                      With 11 figures, 1 table, 1 appendix and 1 supplement
                                      Received 15 October 2019 · Accepted 2 March 2020

Summary: At a global scale, heat deficits during the growing season result in growth limitations, which determine the eleva-
tion of natural alpine treelines. Thus, the expected response to global warming is a treeline advance to higher elevations. How-
ever, empirical studies of diverse mountain ranges have yielded evidence of both advancing alpine treelines as well as rather
insignificant responses. Based on an extensive collection of field data, we analysed population structures and regeneration
patterns, investigated population density-environment relationships and correlated tree growth with climate in order to assess
the sensitivity to climate warming of a near-natural treeline ecotone in east-central Nepal. The presence of an elevational zone
dominated by a gnarled growth form of Rhododendron campanulatum physiognomically classifies the treeline as a krummholz
treeline. The fraction of juvenile tree individuals reflects prolific regeneration and stand densification. The species-specific
variation in adult and juvenile stand density along the treeline ecotone depends not only on temperature but also on soil,
topographic, and other microclimatic conditions. Rhododendron campanulatum shows highest competitiveness in the krummholz
belt under a constellation of site conditions influenced by this species itself. By contrast, Abies spectabilis (Himalayan Silver Fir)
and Betula utilis (Himalayan Birch) have gained predominance under warmer and more nutrient-rich habitat conditions in the
closed forest below. The dense krummholz belt effectively controls the potential upslope migration of subalpine forest tree
species. Abies spectabilis growth-climate correlations show changing growth limitations in the course of the 20th century, most
likely due to intensified climate warming in recent decades, when decreasing moisture availability during the pre-monsoon sea-
son has affected Abies spectabilis' radial growth. It is evident from our results that to date the treeline has responded to climate
warming in terms of stand densities, seed-based regeneration and growth patterns of trees, the treeline position, however, is
rather stable. A treeline shift is to be expected in the mid- to long-term only.

Zusammenfassung: Global betrachtet führt Wärmemangel während der Vegetationsperiode zu Wachstumsbeschränkun-
gen, die die Höhenlage der natürlichen alpinen Waldgrenze bestimmen. Es wird generell angenommen, dass sich alpine Wald-
grenzen infolge des Klimawandels in höhere Lagen verschieben. Empirische Untersuchungen in verschiedenen Gebirgszügen
haben jedoch Hinweise sowohl auf einen Anstieg alpiner Waldgrenzen als auch auf die Persistenz dieser Höhengrenzen
ergeben. Basierend auf umfangreichem Datenmaterial zu Vegetations- und Umweltvariablen konnten Populationsstrukturen
und Verjüngungsmuster erfasst, Zusammenhänge zwischen Populationsdichten und Standortfaktoren untersucht und Korre-
lationen zwischen Baumwachstum und Klima ermittelt werden, um die Empfindlichkeit eines naturnahen Waldgrenzökotons
im östlichen Zentral-Nepal gegenüber der Klimaerwärmung zu beurteilen. Aufgrund der Ausbildung einer Höhenstufe, die
von Rhododendron campanulatum mit einer krummholzartigen Wuchsform dominiert wird, lässt sich das Ökoton physiogno-
misch einer Waldgrenze mit einem vorgelagerten Krummholzgürtel zuordnen. Der Jungwuchs aller Arten zeigt eine intensive
Verjüngung und Verdichtung der Bestände. Die Variation der Bestandesdichte adulter und juveniler Populations-Kohorten
entlang des Höhengradienten hängt in artspezifisch unterschiedlichem Ausmaß nicht nur von der Temperatur, sondern auch
von Bodeneigenschaften, topographischen und anderen mikroklimatischen Bedingungen ab. Rhododendron campanulatum weist
aufgrund von Standortbedingungen, die von dieser Art selbst stark beeinflusst werden, die höchste Konkurrenzfähigkeit im
Krummholzgürtel auf. Auf wärmeren und nährstoffreicheren Standorten des unterhalb gelegenen geschlossenen Waldes
dominieren dagegen Abies spectabilis (Himalaya-Tanne) und Betula utilis (Himalaya-Birke). Der dichte Krummholzgürtel ver-
hindert weitgehend die zu erwartende hangaufwärtsgerichtete Wanderung von subalpinen Baumarten. Wachstums-Klima-
Korrelationen von Abies spectabilis zeigen im 20. Jahrhundert einen Wechsel der das Wachstum limitierenden klimatischen
Einflüsse, was höchstwahrscheinlich auf eine verstärkte Klimaerwärmung in den vergangenen Dekaden zurückzuführen ist.
In diesem Zeitraum hat die zunehmende Trockenheit während der Vormonsunsaison das radiale Wachstum von Abies spectabi-
lis begrenzt. Die Ergebnisse zeigen insgesamt, dass die Waldgrenze auf die Klimaerwärmung im Hinblick auf Bestandsdichte,
generativer Verjüngung und Zuwachsmuster der Bäume reagiert, dass die Höhenlage der Waldgrenze jedoch relativ stabil ist.
Ein Vorrücken der Waldgrenze ist erst in mittel- bis langfristigen Zeiträumen zu erwarten.

Keywords: feedback, krummholz, Nepal, regeneration, species-environment relationships, tree growth-climate correlation,
treeline dynamics, vegetation geography
https://doi.org/10.3112/erdkunde.2020.01.02              ISSN 0014-0015                      http://www.erdkunde.uni-bonn.de
16                                                                                                       Vol. 74 · No. 1

1    Introduction                                                and sometimes exceed the influence of climate. In
                                                                 addition, positive feedbacks may decouple spatial
1.1 Treeline dynamics                                            patterns and processes within treeline ecotones
                                                                 from basic environmental parameters (K im and L ee
     Mountain ecosystems are considered as highly                2015). Seedling establishment is crucial for tree-
sensitive to global change, including alterations                line expansion, and likewise influenced by multiple
of climate (Beniston 2003; L öffler et al. 2011;                 factors (Holtmeier 2009; L ett and Dorrepaal
Schickhoff 2011; Palomo 2017; Steinbauer et al.                  2018). In addition, land use and land use changes
2018; I mmerzeel et al. 2020). The elevational distri-           have modified the spatial patterns at treelines in
bution of mountain plant communities is sensitive                all historically populated mountains in many ways.
to climate change with a potential species loss un-              Generally, anthropogenic influence lowered tree-
der accelerated warming (Steinbauer et al. 2018).                line elevations. Therefore, a clear signal of climate
Associated with upward shifting treeline ecotones                change can only be detected at near-natural, i.e.
(H arsch et al. 2009), alpine vegetation habitats                climatic treelines (e.g., M iehe and M iehe 2000;
might shift upslope as well, or shrink. Shrinking                Dirnböck et al. 2003; Bolli et al. 2007; Gehrig -
results in potential habitat loss of plant and animal            Fasel et al. 2007; Rössler et al. 2008; Schickhoff
species, amongst them endangered ones like the                   2011; P enniston and Lundberg 2014; Durak et al.
snow leopard (G ottfried et al. 2012; Forrest et                 2015). To this end, complex research approaches to
al. 2012; Chhetri et al. 2018). In general, the upper            natural treelines at local and landscape scales are
limit of tree life depends on the heat balance. At a             needed (e.g., M alanson et al. 2011; Holtmeier and
global scale, low air and soil temperatures during               Broll 2017; Brodersen et al. 2019).
growing season determine the position of natural                      Treeline dynamics in the Himalaya are the result
alpine treelines1) (e.g., Troll 1973; Stevens and                of interrelationships between human impact and cli-
Fox 1991; M iehe and M iehe 2000; Körner 2007;                   matic changes during recent centuries (cf. Beug and
Holtmeier 2009; Körner 2012). In consequence,                    M iehe 1999; Schlütz and Zech 2004; Schickhoff
treelines fluctuated repeatedly because of climate               et al. 2016a). Above-average warming rates have trig-
changes during the Holocene (cf. Schickhoff                      gered multiple vegetation responses, such as chang-
et al. 2016a) and climate warming is expected to                 es in phenology, productivity, species composition
cause treelines to advance to higher elevations (e.g.,           of communities, structure and elevational ranges of
Körner 2012; L amsal et al. 2017; Holtmeier and                  species (Shrestha et al. 2012; Telwala et al. 2013;
Broll 2020). However, H arsch et al. (2009) have                 Zhang et al. 2013; Salick et al. 2014). Recent eleva-
analysed data from 166 globally distributed tree-                tional shifts of Himalayan alpine treelines and tree
lines whose dynamics were monitored since AD                     growth-climate relationships have received much
1900. Forty-seven per cent of the treelines were                 attention (e.g., R ana et al. 2017; Yadava et al. 2017;
persistent, while 52  % advanced to higher eleva-                Sigdel et al. 2018; Tiwari and Jha 2018; Mohapatra
tions, and only 1  % showed recession. Likewise,                 et al. 2019). Climatic changes will inevitably affect
recent empirical studies in diverse mountain ranges              growth patterns, seedling survival and seedling per-
detected both currently advancing alpine treelines               formance, albeit to a regionally differentiated and
as well as rather insignificant responses (Baker and             largely unknown extent (Schickhoff et al. 2015;
Moseley 2007; Hofgaard et al. 2009; Wieser et al.                Schickhoff et al. 2016a; Bürzle et al. 2018).
2009; Grigor’ev et al. 2013; Chhetri and Cairns
2015; Schickhoff et al. 2015; Shrestha et al. 2015),
which is not sufficiently understood. Besides eleva-             1.2 Climate change in the Himalaya
tional upshift, alpine treelines show responses to
climate change by tree densification. Different driv-                 In line with global warming trends in moun-
ers can control both spatial dynamics (Feuillet et               tain regions, several studies have observed above-
al. 2019). Apart from limitation of tree growth by               average current warming trends for the Himalayan
growing season temperature, regional and local fac-              region. Warming trends of the annual mean surface
tors and species-specific traits determine treeline              air temperature of up to 1.5 °C were detected over
positions and dynamics. The latter factors interact              the Tibetan Plateau and the Himalaya during the pe-
                                                                 riod 1991–2012 (ca. 0.75 °C per decade), with a ris-
   1)
      We employ the terms ‘treeline’ and ‘treeline ecotone’ as   ing trend in extreme values ( IPCC 2014; Mountain
synonyms for the transition zone.                                Research Initiative EDW Working Group 2015;
2020     N. Schwab et al.: Ecological relationships at a near-natural treeline, Rolwaling Valley, Nepal Himalaya ...   17

Schickhoff et al. 2016b; K rishnan et al. 2019).                   elevational shifts, Himalayan krummholz treelines
Maximum values were found for the high eleva-                      have shown rather low responsiveness to climate
tions and during winter and pre-monsoon seasons                    warming over recent decades. However, short- to
(Shrestha et al. 1999; L iu and Chen 2000). For the                medium-term responses are expected in terms of
Rolwaling Valley in east-central Nepal, the target                 tree growth and seedling recruitment (Schickhoff
area of this paper, monthly mean surface air tem-                  et al. 2016a).
perature trends in the order of 0.7 °C per decade                       Apart from treeline type and treeline form,
were assessed in winter and pre-monsoon seasons                    tree species composition, population structures,
(Gerlitz et al. 2014). During monsoon, no statis-                  regeneration patterns, and stand structural param-
tically significant temperature trends were identi-                eters such as tree density, diameter and height dis-
fied. Trend analyses of precipitation amounts in the               tributions can be indicators of treeline sensitivity
Himalaya do not exhibit a consistent pattern. Some                 to climate change. These parameters provide in-
studies, however, detected negative trends of winter               formation about the establishment of recruits and
and pre-monsoon precipitation over the western and                 their performance, which is crucial for any treeline
central Himalaya (Duan et al. 2006; Bhutiyani et al.               advance (Germino et al. 2002; Holtmeier 2009;
2010; Jain et al. 2013). Wang et al. (2013) reported               Körner 2012; Zurbriggen et al. 2013; Schickhoff
an enhanced frequency of winter and pre-monsoon                    et al. 2015).
drought events for western Nepal. Additionally,                         To date, few studies have examined tree-
K arki et al. (2017b) found rising precipitation ex-               line seedlings in the Himalaya, and tree recruit-
tremes across Nepal.                                               ment in treeline ecotones is not well understood
                                                                   (Schickhoff 2005; Shi and Wu 2013; Dutta et
                                                                   al. 2014; Schickhoff et al. 2015; Schickhoff et al.
1.3 Sensitivity indicators and research deficits                   2016a; Bürzle et al. 2018). Most of the available
                                                                   studies investigated treeline ecotones with deviat-
    Key sensitivity indicators to assess current                   ing species compositions and population structures
treeline dynamics include treeline type, treeline                  and have generally investigated ecotones which have
form, seed-based regeneration, and growth pat-                     been disturbed by land-use effects (Shrestha et al.
terns (Schickhoff et al. 2015). Amongst different                  2007; Gaire et al. 2011; Chhetri and Cairns 2015;
treeline types, climatic treelines are considered to               Shrestha et al. 2015; Singh et al. 2018). Thus, their
show a rather high sensitivity to climate change,                  results can hardly be transferred to near-natural
notwithstanding the fact that local-scale abiotic                  treeline ecotones.
and biotic site factors and their interactions modify                   Extensive research deficits persist in terms
the direct influence of climate warming in com-                    of the interactions of landscape-scale and local-
plex ways. Orographic and edaphic treelines are                    scale abiotic and biotic factors and processes and
considered less responsive. Anthropogenic tree-                    their relation to region-wide climate warming in-
lines do show distinct directional changes, which                  puts (S chickhoff et al. 2016a; Singh et al. 2019).
have often been attributed to climate warming;                     The accumulated knowledge of treeline tree spe-
however, in the majority of cases, these changes                   cies ecology in the Himalaya remains very limited
most likely resulted from reduced land-use impacts                 (M iehe and M iehe 2000; S chickhoff 2005; M iehe
(Schickhoff et al. 2016a).                                         et al. 2015), narrowing the present understanding
    According to a worldwide meta-analysis on the                  of climate warming-induced non-linear treeline
responsiveness of different treeline forms (H arsch                ecotone responses to local-scale modulators and
and Bader 2011), diffuse treelines, which are formed               their interactions. Near-natural treeline ecotones
and maintained primarily by growth limitation, ex-                 can contain co-dominant tree species that re-
hibit a strong response signal. The same study re-                 spond differently to climate change (Trant and
ports abrupt, island and krummholz treelines to be                 H ermanutz 2014). Most treeline studies in Nepal
controlled by seedling mortality and dieback, and                  and the Himalaya focussed on single treeline-
they are comparatively less responsive to climate                  forming tree species (e.g., Shrestha et al. 2007;
changes. The majority of Himalayan near-natural                    Lv and Z hang 2012; Sujakhu et al. 2013; Gaire et
treelines can be categorised as krummholz treelines,               al. 2014) rather than addressing co-occurring tree
characterized by a dispersed or contiguous band of                 species and their specific responses. Thus, there is
gnarled and multi-stemmed trees above the subal-                   an urgent need for multispecies and multifactorial
pine forest (Schickhoff et al. 2016a). With regard to              approaches to treeline dynamics to capture suf-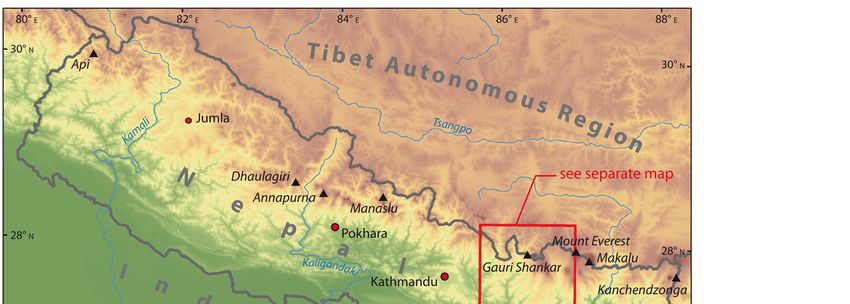
18                                                                                                Vol. 74 · No. 1

ficiently the sensitivity of the ecotone to climate       1) We detect elevational patterns of tree species
change (S chwab et al. 2016; L ett and Dorrepaal             distributions in order to analyse species-specific
2018; Tiwari and Jha 2018).                                  patterns and abruptness of transitions of tree as
     To date, various treeline tree species have been        well as recruit densities and growth parameters
analysed to explore tree growth-climate relation-            along the elevational gradient.
ships in Himalayan sub-regions (e.g., Chaudhary           2) We analyse the relations of Abies spectabilis radial
et al. 1999; Cook et al. 2003; A hmed et al. 2011;           growth to climate in order to evaluate the sensi-
Yadav et al. 2011; Thapa et al. 2017). A frequently          tivity of tree growth to climate change, and in-
studied species is the widely distributed Himalayan          vestigate the temporal stability of tree growth-
Silver Fir, Abies spectabilis. Some Abies spectabilis        climate relationships.
studies found a positive correlation between radi-        3) We analyse the relationships of adult and juve-
al tree growth and the temperature of the current            nile population densities of tree species with
and previous growing seasons (e.g., Shrestha et al.          environmental conditions in order to identify
2015; Shrestha et al. 2017). Others inferred a limi-         crucial site factors for the high competitiveness
tation of tree growth by winter temperature (e.g.,           of Rhododendron campanulatum, forming a dense
Chhetri and Cairns 2016; R ayback et al. 2017) or            krummholz belt above the treeline, and assess
by available moisture in dry pre-monsoon seasons             the susceptibility of these variables to climate
(e.g., Gaire et al. 2011; K haral et al. 2017; Gaire et      change.
al. 2017a). In view of the generally sparse and par-      4) We discuss and summarize results from a sys-
tially inconsistent results, even in study areas close       tem perspective with focus on the treeline mi-
to each other (e.g., Gaire et al. 2017b), additional         gration potential, showing potential feedback
studies are needed to generate denser tree-ring net-         processes and equilibrium states under climate
works of various treeline tree and shrub species and         change related temperature forcing.
to distinguish tree growth-climate relationships of
sites with differing environmental and especially
climatic conditions.                                      2   Research design and methodology
     The majority of central Himalayan tree-ring
studies investigated growth-climate relationships              To examine the treeline ecology and its sensitiv-
over rather short periods because of the lack of long     ity to climate change from an interdisciplinary per-
instrumental records of climate data. Some recent         spective we applied extensive acquisition of tree spe-
studies employed gridded climate data that cover          cies density, tree-ring, soil, topography and climate
longer periods. Most studies analysed static correla-     data across the treeline ecotone. Supplement I: D
tions that represent the whole data period without        shows the respective comprehensive research
investigating the temporal pattern of correlations        design.
and addressing its temporal stability (e.g., Thapa et
al. 2015). Few recent studies mentioned unstable
correlations of Abies spectabilis tree growth with cli-   2.1 Study area
mate variables (Shrestha et al. 2015; Sohar et al.
2017; Gaire et al. 2020). To date, hardly any study            We conducted the studies on the north-facing
investigated temporal stability and the so-called ‘di-    slope of the Rolwaling Valley (27°52’ N; 86°25’ E),
vergence phenomena’ in the Himalaya, pointing to          located in Dolakha District (Province 3), east-central
an immense need for further research.                     Nepal, adjacent to the border of Tibet Autonomous
                                                          Region (Supplement I: A, B). The Rolwaling Valley is
                                                          part of the Gaurishankar Conservation Area, estab-
1.4 Objectives                                            lished in 2010 (Bhusal 2012).
                                                               The climate of this area is monsoonal, and has a
     To reduce the aforementioned research deficits,      continental character, with dry and cold winter con-
we aim at assessing sensitivity and response of the       ditions, while the pre-monsoon season is dry and hot.
treeline in the Rolwaling Valley by a series of con-      The seasons are usually defined as winter (December
secutive and complementary analyses of sensitivity        to February), pre-monsoon/spring (March to May),
indicators, based on data and results of previous in-     monsoon (June to September) and post-monsoon
terdisciplinary studies (Supplement I: D) (Schwab         (October to November) (K arki et al. 2017b).
et al. 2016; Schwab et al. 2017; Schwab et al. 2018):     Precipitation during monsoon season accounts for
2020     N. Schwab et al.: Ecological relationships at a near-natural treeline, Rolwaling Valley, Nepal Himalaya ...    19

approximately 80 % of the total annual precipita-                  2.2 Data collection
tion. The pre-monsoon season is a dry period with
high solar insolation, maximum temperatures, little                2.2.1 Vegetation
precipitation and low available soil water capacity
(Supplement I: C) (Müller et al. 2016a; K arki et al.                   We stratified the slopes according to the ele-
2017a). At the local scale, the climate shows distinct             vational zonation of tree species composition and
spatial variability of temperature and precipitation               stand structure in elevational zones A (lower sec-
(Böhner et al. 2015; Weidinger et al. 2018). The cli-              tion of upper subalpine closed forests) to D (alpine
mate of the study site is considered temperate, with a             dwarf shrub heaths, cf. Supplement I: B, E, F). In
dry winter and a warm summer (K arki et al. 2016).                 total, 50 square plots of 20 m × 20 m were random-
The warming trend of the study area corresponds                    ly selected and sampled. Sampling took place from
to general Himalayan trends (Gerlitz et al. 2014;                  April to September 2013 and in August 2014. We
Schwab et al. 2018). Müller et al. (2016a) classified              determined tree species based on P ress et al. (2000)
soils in the treeline ecotone as podzols.                          and Watson et al. (2011). We measured the diam-
     The Rolwaling Himal (mountain) treeline at the                eter at breast height (dbh) at 130 cm above ground
north-facing slope exhibits a near-natural state and               level as well as the height of all vital tree species
represents a climatic treeline. The study area has a               individuals with dbh ≥ 7 cm in accordance with
remote location, which lacks a connection to the                   standard forest inventory procedures (Van L aar
road network. To reach the study site, three days of               and A kça 2007). We identified and counted indi-
trekking is required. The Rolwaling Valley contains a              viduals of tree species with dbh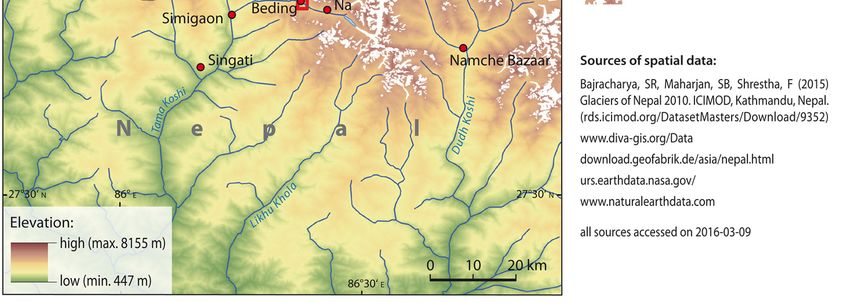
20                                                                                             Vol. 74 · No. 1

drought indices of the one-month and three-month        ables (Appendix I), which were further reduced by
Standardised Precipitation-Evapotranspiration Index     the RDA backward elimination process. We used
(SPEI ) (Vicente-Serrano et al. 2010), which were       functions of the R-packages ‘PCNM ’ (L egendre
based on CRU data.                                      et al. 2013), ‘pgirmess’ (Giraudoux 2015), ‘plyr’
                                                        (Wickham 2011), ‘psych’ (R evelle 2015), ‘rgdal’,
                                                        ‘sp’ (Bivand et al. 2013; Bivand et al. 2015), ‘vegan’
2.3 Data analyses                                       (Oksanen et al. 2015), ‘xlsx’ (Dragulescu 2014).
                                                             Missing values in variables (mostly soil temper-
    Unless stated otherwise, all computations and       ature and soil moisture) would have restricted the
figure plotting were carried out through the func-      multivariate analyses to a minor part of the entire
tions of packages (see below) in the most recent        dataset. Hence, we applied multivariate imputation
versions of the program R (R Core Team 2018).           by chained equations ( MICE; Van Buuren 2012)
                                                        based on a random forest classification (Doove et
                                                        al. 2014) to estimate the missing values based on
2.3.1 Population structures, regeneration pat-          the relationships between the variables (cf. Schwab
    terns and abruptness of transitions                 et al. 2016).

     We calculated stem numbers and stand den-
sities per hectare. To visualise population struc-      2.3.3 Tree growth-climate relationships
tures and species compositions, we created bar
graphs. To describe and analyse variation in stand           The cross-dating of the Abies spectabilis tree-
structures and characterise abrupt or smooth and        ring width ( TRW ) chronology, removal of age-
gradual transition patterns along the ecotone, the      related growth trends and assessment of chro-
abruptness of transitions between elevational sub-      nology quality followed standard methods and
sequent zones was calculated as the difference          used inter alia the programs CooRecorder and
between the scaled values of successive zones           CDendro (L arsson 2016), COFECHA (Holmes
(Wiegand et al. 2006; Batllori and Gutiérrez            1983) and ARSTAN (Cook 1985). To analyse the
2008; cf. S chwab et al. 2016). We determined           relationships between the standardised TRW chro-
abruptness species-wise for the density of trees.       nologies and the climate variables, we calculated
In order to compare to abruptness patterns of tree      Pearson’s correlation coefficients and confidence
species, we calculated the abruptness of annual         intervals through a stationary bootstrapped cor-
and seasonal soil temperatures. We applied func-        relation function with optimal block-length se-
tions of the R-packages ‘plyr’ (Wickham 2011) and       lection (Politis and Romano 1994; Politis and
‘vegan’ (Oksanen et al. 2015).                          White 2004) at a level of significance of p < 0.05.
                                                        The correlations were calculated for the period of
                                                        climate data availability, namely 1901–2012. We
2.3.2 Population density-environment relationships      computed static correlations of TRW with mean,
                                                        mean minimum and mean maximum temperatures
    We analysed population density-environment          as well as precipitation sums and SPEI for single
relationships through redundancy analyses ( RDA)        months and seasons of the present year and the
with backward elimination of explanatory vari-          year before ring formation. To examine the stabili-
ables as well as through variation partitioning         ty of correlations for the analysed period, we calcu-
(L egendre and L egendre 2012). To preselect            lated 31-year moving window correlations (Biondi
important variables and apply variation partition-      and Waikul 2004) with a one-year offset between
ing, the explanatory dataset was split into three       consecutive windows. Whilst moving windows are
groups: soil, topography and climate variables,         suitable for detecting the presence of stable periods
which Schwab et al. (2016) presented in detail. To      over a range of time, evolutionary interval correla-
avoid high multicollinearity, we removed within-        tions reveal the lengths of specific periods (Biondi
group correlations of |r|> 0.7 (Spearman, p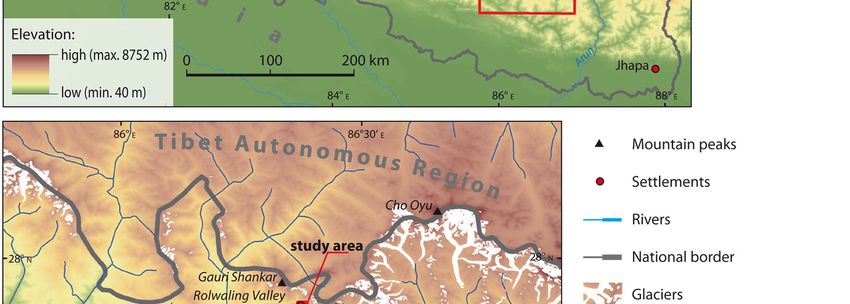
2020      N. Schwab et al.: Ecological relationships at a near-natural treeline, Rolwaling Valley, Nepal Himalaya ...    21

3   Results                                                               The recruit density pattern (Fig. 2) mostly re-
                                                                    sembles that of individuals with dbh ≥7 cm. The
3.1 Elevational boundaries of tree species distri-                  occurrence of Juniperus recurva, a species that can
    butions and regeneration                                        grow to tree size, remarkably differed between
                                                                    recruits and adults. We found no individual with
      In general, the upper subalpine forests under in-             dbh ≥ 7 cm (adults) whilst Juniperus recurva recruits
vestigation were primarily composed of Betula utilis                were existent in the subalpine forest and the krum-
and Abies spectabilis, with Rhododendron campanulatum               mholz belt. Rhododendron campanulatum and Sorbus
and Sorbus microphylla forming a second tree layer. Acer            microphylla seedlings occurred in rather high abun-
caudatum and Prunus rufa occasionally occurred as com-              dance in the alpine dwarf shrub heath; however, no
panions. Please refer to Supplement I: E and F for de-              tree-sized individual of these species was detected
tailed impressions of the elevational vegetation zones.             there.
The lower elevational section (zone A; Supplement I:                      The krummholz belt contained the uppermost
F xiii - xvi) of the upper subalpine forest transitions             stunted individuals of Abies spectabilis and Betula uti-
into its upper section (zone B; Supplement I: F ix -                lis with dbh ≥ 7 cm (adults). The uppermost trees
xii) at 3820 m a.s.l. at the NW slope and at 3900 m                 with true tree habitus (upright stem with crown)
a.s.l. at NE slopes. The tree species composition dif-              grew in the upper section of the upper subalpine
fered between these sections. Specifically, the density             forest (zone B). Thus, the treeline coincided with
of Abies spectabilis trees in zone B was smaller than               the transition from subalpine forest to krummholz
in zone A, whilst the density of Betula utilis increased            belt, as only a few outpost-treeline trees occurred
with elevation. The most distinct difference between                in the krummholz belt (in this instance, the term
the subalpine forest zones was the distinctly higher                ‘treeline’ does not refer to the entire transition
proportion of Rhododendron campanulatum individuals                 zone). In addition, we identified several tree species
in zone B compared to zone A (Fig. 1, Supplement                    lines inside the ecotone (cf. Schwab et al. 2016).
I: F x – xii, xv). Closed forests gave way to a dense                     In general, certain values of stand parameters,
and nearly impenetrable Rhododendron campanulatum                   such as dbh, tree height and tree density, decreased
krummholz belt (zone C; Supplement I: F v - viii) at                with elevation. The pattern of tree density differed
approximately 3910 m a.s.l. (NW slope) and 4010 m                   between single species. The density of Betula uti-
a.s.l. (NE slopes). There, Rhododendron campanulatum                lis, Sorbus microphylla and, to a certain extent, Abies
dominated the tree species composition and was ac-                  spectabilis trees decreased abruptly at the transition
companied by few Sorbus microphylla individuals. The                from forest to krummholz belt (B-C), whilst the
Rhododendron belt turned into alpine Rhododendron sp.               density of Rhododendron campanulatum increased in-
dwarf shrub heaths (zone D; Supplement I: F i - iv) at              termediately from forest to krummholz belt (B-C)
approximately 4080 m a.s.l. (NW slope) and 4120 m                   and dropped abruptly from the maximum to the
a.s.l (NE slopes). These heaths were mainly composed                smallest density at the transition from krummholz
of Rhododendron anthopogon, Rhododendron lepidotum, and             to alpine dwarf shrub heath (C-D) (Fig. 3). Annual
Rhododendron setosum (Schwab et al. 2016).                          and all seasons’ mean soil temperatures dropped

Fig. 1: Tree species population density of adult individuals (≥ 7 cm dbh) across the elevational gradient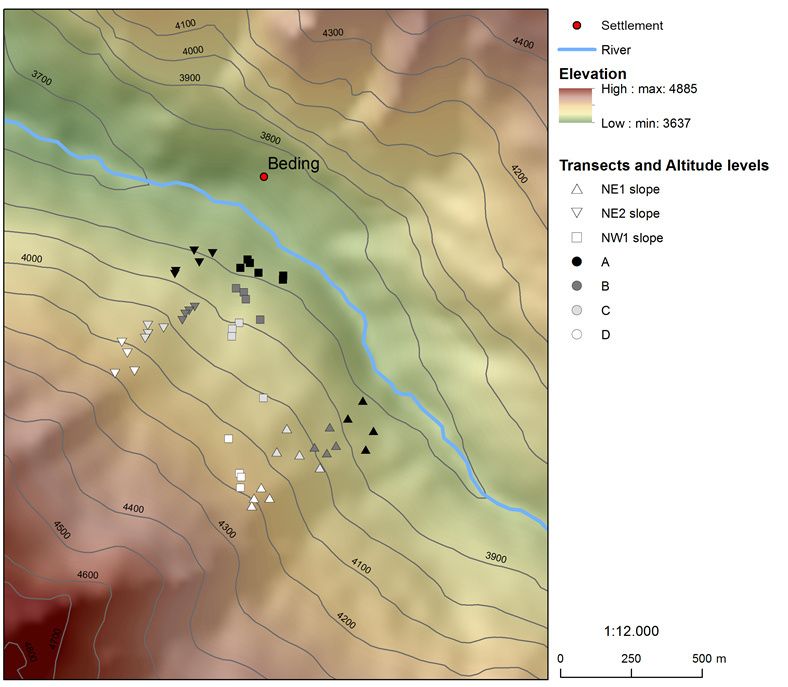
22                                                                                                                 Vol. 74 · No. 1

Fig. 2: Tree species population density of juvenile individuals (< 7 cm dbh, ‘recruits’) across the elevational gradient

most abruptly at the transition from closed forest               per subalpine forest (zone A) with a higher number of
to krummholz belt (B-C) (Fig. 3) (Schwab et al.                  tree species exhibited variation along the second axis
2016).                                                           (Schwab et al. 2017).
                                                                      Most environmental variables were correlated
                                                                 with RDA axis one rather than with axis two (Fig. 4).
3.2 Population density-environment relationships                 These variables form a complex gradient along the
                                                                 first axis, which can be divided roughly into three
     Both ordinations for adult and juvenile trees sup-          non-hierarchical groups. The first group refers
port Rhododendron campanulatum to be the dominant                to differences in microtopographic groundcover,
tree species at topographically finely structured and
colder habitats with reduced nitrogen availability. This
combination of site properties in the krummholz belt                          C-D
and alpine dwarf shrub heath has resulted in a high
competitiveness of Rhododendron campanulatum, which
considerably decreases in more nutrient-rich and
warmer sites of the upper subalpine forest where other
                                                                 transition

tree species have gained predominance.
                                                                              B-C

3.2.1 Adult trees

    Seventeen selected environmental variables ex-
plained a total of 77 % of the variation in adult tree                        A-B
species density (cf. Tab. 1 for all selected variables).
The first RDA axis accounted for 58 % of the vari-                                  -1                  0                   1
ance, and the first and second axes together explained                                              abruptness
68 % of the variance. The ordination reflects a clear                          Abies spectabilis            Rhododendron camp.
separation between plots of the Rhododendron cam-                              Betula utilis                Soil temperature
panulatum krummholz belt (zone C), a mixed zone of                             Sorbus microphylla
A and B groups (sections of upper subalpine forest)              Fig. 3: Species-wise tree density and annual mean soil tem-
and a pure zone of the A group (Fig. 4). These three             perature: abruptness of transitions from lower to upper part
groups were arranged mainly along the first RDA axis.            of subalpine forest (A-B), from upper part of subalpine for-
                                                                 est to krummholz belt (B-C) and from krummholz belt to al-
In general, the plots spread only slightly along the sec-        pine dwarf shrub heath (C-D). Population densities and soil
ond RDA axis. Plots of the krummholz belt especially             temperature were generalized across all investigated slopes.
formed a tight cluster due to the strong dominance               A positive abruptness indicates a transition of decreasing
                                                                 values with elevation as it is generally expected in a treeline
of Rhododendron campanulatum. In contrast, the group             ecotone, whilst a negative abruptness conveys an increasing
that contained plots of the lower section of the up-             value with elevation.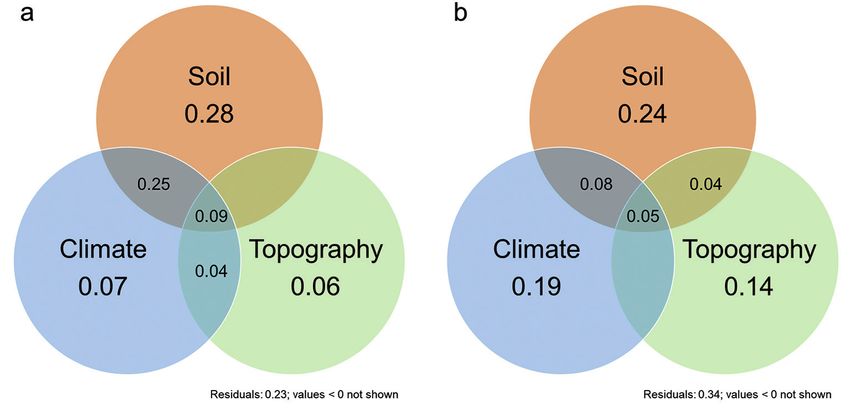
2020      N. Schwab et al.: Ecological relationships at a near-natural treeline, Rolwaling Valley, Nepal Himalaya ...   23

Tab. 1: Explanatory variables and biplot scores of RDA axes 1 and 2 of adult and juvenile tree density RDAs indicating im-
portance of environmental variables and abbreviations used in Figures 4 & 5.
                                                     Adult tree density RDA
                                Variable name             Abbreviation      RDA axis 1            RDA axis 2
                     Air temperature DJF                   Temp DJF                     -0.746           -0.181
                     C/N Ah-horizon                        CN Ah                        0.688            0.036
                     Bulk density Of-horizon               BD Of                        -0.645           0.154
                     C/N Ae-horizon                        CN Ae                        0.489            -0.343
                     Soil temperature MAM                  Soil temp MAM                -0.477           -0.170
                     Medium size stone cover               Med stone                    0.414            0.103
                     Large stone cover                                                  0.361            0.219
                     Mn concentration Ah-horizon           Mn Ah                        -0.354           0.555
                     Sand content Ae-horizon               Sand                         0.348            0.279
                     Min. air temperature JJAS             Min temp JJAS                0.320            0.368
                     Coarse soil cover                     Coarse soil                  0.316            0.067
                     Large rock cover                                                   -0.296           0.067
                     Surface structure dissimilarity                                    -0.212           -0.142
                     Fine soil cover                                                    -0.154           -0.230
                     Small rock cover                                                   -0.148           0.155
                     Medium rock cover                                                  -0.017           -0.002
                     Litter cover                                                       0.009            -0.138

                                                      Juvenile density RDA
                                Variable name             Abbreviation     RDA axis 1             RDA axis 2
                     C/N Ah-horizon                        CN Ah                        0.707            -0.049
                     Air temperature DJF                   Temp DJF                     -0.625           -0.433
                     C/N Ae-horizon                        CN Ae                        0.468            -0.358
                     Mn concentration Ah-horizon           Mn Ah                        -0.391           -0.319
                     Bare ground cover                     Bare ground                  0.334            0.142
                     Ground cover dissimilarity            Ground diss                  0.333            0.295
                     Medium size stone cover               Med stone                    0.328            0.056
                     Ca concentration Ae-horizon                                        0.186            0.024
                     Terraced surface structure                                         0.169            -0.074
                     Bulk density Ah                                                    -0.152           0.185
                     Rugged surface structure              Rugged                       -0.095           0.320
                     Eastness                                                           -0.050           0.157
                     Min. air temperature JJAS                                          -0.040           -0.102
                     pHH2O                                                              0.038            -0.145
                     Note: variables sorted by absolute values of RDA axes 1.

namely the size and shape of rocks. Rhododendron                     that was expressed in lower soil and air temperatures
campanulatum was associated with plots that contain                  in plots with a high density of Rhododendron campanu-
coarse soil cover and large stones, i.e. with a more                 latum and higher temperatures at other plots. The
finely structured microtopography, compared to                       third group relates to differences in soil texture and
sites dominated by other tree species. The second                    soil fertility as indicated by manganese content and
group of variables reflects a temperature gradient                   carbon-to-nitrogen (C:N) ratios of Ah and Ae hori-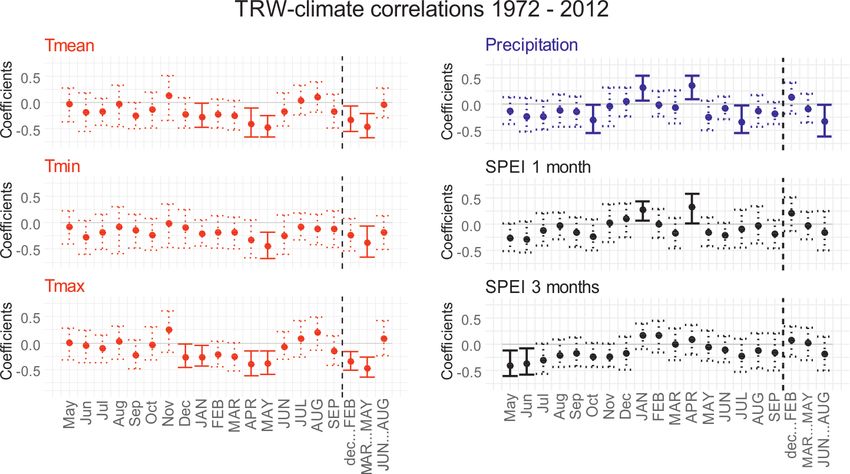
24                                                                                                                                            Vol. 74 · No. 1

                                                                      RDA1 species scores
                                        -0.5                                   0.0                                  0.5

                         0.6                           A cer caudatum
                                                       Acer  caudatum                                                      A          NE1
                                                                                                                           B          NE2
                                                                      Mn Ah                                                C          NW
                         0.4

                                                                                     Min temp JJAS
                                                                                                                     Finer structured
                                                                                             Sand

                                                                                                                                                RDA2 sspecies scores
                                   Sorbus m
                                   Sorbus microphylla
                                           icrophylla                                                                microtopography
                         0.2
      RDA2 site scores

                                               BD Of                                           Med
                                                                                               M ed sstone
                                                                                                      tone
                                                                       P runus rrufa
                                                                       Prunus    ufa           Coarse soil
                         0.0

                                                                                                         CN
                                                                                                         C  Ah
                                                                                                           NA h

                                                                                                                                                        0
                                       Temp. DJF                                                                          R hododendron c
                                                                                                                          Rhododendron  c..
                                                                                                          Less fertile
                                          Soil
                                          Soil temp.
                                               temp. MAM
                                                     MA M
                         -0.2

                                                                                                             soil
                                                     Betula u
                                                     Betula utilis
                                                              tilis
                                                                                               CN Ae
                         -0.4

                                          Higher
                                       temperatures
                         -0.6
                         -0.8

                                                 Abies spectabilis

                                -1.0                   -0.5                   0.0                   0.5                   1.0
                                                                       RDA1 site scores
     Fig. 4: Ordination diagram of RDA analysis for adult tree density: Vector directions show relation to environ-
     mental variables, vector lengths show their importance (for explanation of abbreviations and values see Table 1).
     Only the most important environmental variables with a biplot score (axis one, axis two or both) ≥ 0.3 are depict-
     ed. The first two constrained RDA axes here explain 68 % of the variation in adult tree species density. Dashed
     arrows signify the appropriate direction of the summarised main gradients, with the length not true to scale.

zons. Despite the strong gradient in the ordination,                                      of the variation, and the first and second axes ex-
there were no significant disparities in manganese                                        plained a total of 60 % of the variance. The ordina-
content between the elevational zones. However,                                           tion of juvenile individuals revealed a clear separa-
the C:N ratios of elevational zones A (closed forest)                                     tion into a group of plots from elevational zone A
and C (krummholz belt) were significantly differ-                                         (lower section of upper subalpine forest), a group
ent. Sites of the krummholz belt and Rhododendron                                         from zone B (upper section of upper subalpine for-
campanulatum were associated with less nitrogen                                           est) and a mixed group of plots from the krum-
mineralisation and increased nitrogen immobilisa-                                         mholz belt and alpine dwarf shrub heath (zones C
tion relative to other sites and species. Furthermore,                                    and D) (Fig. 5). The groups were separated from
they contained fewer nutrient-fixing clay and silt                                        each other along the first RDA axis. Compared to
particles. This trend generally indicated less fertile                                    the adult tree ordination (Fig. 5), the sites were
soil conditions at krummholz belt plots, which were                                       distributed along the second RDA axis to a higher
dominated by adult Rhododendron campanulatum trees                                        degree. Plots from slope NE1 tended to separate
as well as more fertile conditions at plots of the up-                                    from the plots of other slopes, especially in case of
per subalpine forest, in which other tree species                                         those from the krummholz belt and alpine dwarf
were more abundant (Schwab et al. 2017).                                                  shrub heath, because of differences in juvenile tree
                                                                                          species composition between the slopes (Schwab
                                                                                          et al. 2017).
3.2.2 Recruits                                                                                The differentiations in groups of krummholz
                                                                                          belt and alpine heath sites versus other sites and
    Fourteen selected environmental variables                                             of Rhododendron campanulatum versus other species
explained a total of 66 % of the variation in juve-                                       relate to differences in nitrogen availability (C:N
nile tree species density (cf. Table 1 for all selected                                   ratios of the Ah and Ae horizons), the manganese
variables). The first RDA axis accounted for 51 %                                         content of the Ah horizon, the calcium content of
2020 N. Schwab et al.: Ecological relationships at a near-natural treeline, Rolwaling Valley, Nepal Himalaya ... 25
RDA1 species scores
0.0
Sorbus m
Sorbus microphylla
icrophylla
A NE1
0.8
B NE2
C NW
0.6
D
Rugged
0.4
Ground diss Finer structured
microtopography
RDA2 sspecies scores
0.2
B are g
Bare round
ground
RDA2 site scores
A
Acer
cer caudatum
caudatum Juniperus
J ecurva Med stone
uniperus rrecurva
0.0
Prunus rrufa
Prunus ufa
0
CN Ah
-0.2
R hododendron c
Rhododendron c..
Higher A bies s
Abies spectabilis
pectabilis
temperatures Less fertile
-0.4
Mn Ah soil
CN Ae
Betula u
Betula tilis temp DJF
utilis
-1.0 -0.5 0.0 0.5 1.0
RDA1 site scores
Fig. 5: Ordination diagram of RDA analysis for juvenile tree species density: Vector directions show relation
to environmental variables, vector lengths show their importance (for explanation of abbreviations and values
see Table 1). Only the most important environmental variables with a biplot score (axis one, axis two or both)
≥ 0.3 are depicted. The first two constrained RDA axes included here explain 55 % of the variation in juvenile
tree species density. Dashed arrows signify the appropriate direction of the summarised main gradients, with
the length not true to scale.
the Ae horizon, the dissimilarity of surface struc- important independent predictor of species distri-
ture within and between plots, and differences in bution (28 % explained variability), whilst climatic
mean and minimum air temperatures. Rhododendron and topographic variation were of secondary (7 %)
campanulatum and Sorbus microphylla had comparable and tertiary importance (6 %; Fig. 6a), respectively.
conditions in terms of temperature, manganese The analyses revealed that 25 % of the shared vari-
content and within-plot microrelief dissimilarity. ation of adult tree density was explained by soil
In contrast to the adult tree ordination, sites variables, climate variables or both (Fig. 6a).
and species were scattered to a higher degree in the As in adult tree density, the soil group of vari-
ordination of juvenile individuals. Compared to ables in the case of juvenile tree density was the
adult tree ordination, the juvenile ordination was key independent predictor of species distribution
influenced by more complex combinations of vari- (24 % explained variability), whilst climatic and
ables to gradients. However, the main factors were topographic variation were of secondary (19 %)
likewise related to nutrient availability, tempera- and tertiary importance (14 %; Fig. 6b), respec-
ture and microtopography (Schwab et al. 2017). tively. The analyses highlighted that soil, climate
or topographic variables, or any combination of
these, accounted for small amounts of the shared
3.2.3 Variance partitioning results variation of juvenile tree density. In comparison
to the partitioning of variation of the adult tree
By means of variation partitioning, the ex- density, the partitioning of juvenile stand density
plained variability was separated into amounts variation revealed a more balanced distribution of
which were accounted for exclusively by soil, topo- explained variance per variable group (cf. Fig. 6).
graphic or climatic explanatory data sets as well as Although topography was of minor importance
into amounts that were explained jointly by two or for adult trees, its share in accounting for the total
three of these explanatory data sets. In the case of variation of juvenile density is substantial (Schwab
adult trees, the soil group of variables was the most et al. 2017).26 Vol. 74 · No. 1
Fig. 6: Variation partitioning of (a) adult tree density using the matrices of soil variables, climate vari-
ables and topographic variables and (b) juvenile density using the matrices of soil variables, climate
variables and topographic variables. The numbers indicate the percentage of total explained variabil-
ity, explained exclusively or jointly by the variable matrices.
3.3 Tree growth-climate relationships mer temperature (Fig. 9) (Schwab et al. 2018).
For recent decades, the correlation analyses
The collection and subsequent processing of identified a significantly negative relationship be-
TRW measurements yielded a chronology that rep- tween the radial growth and the mean, minimum
resents the radial growth of Abies spectablilis back to and maximum temperatures for the current year’s
1748 (Fig. 7). The results of the analyses of Abies pre-monsoon season (March-May). Moreover, they
spectabilis tree growth-climate relationships give evi- detected significant negative correlations of mean
dence of a significantly unstable dendroclimatic sig- and maximum temperatures during winter prior to
nal over time. Climate warming-induced moisture the current growing season (December-February)
deficits during pre-monsoon seasons have become (Fig. 8). Precipitation sums and TRW reflected a
a major limiting factor for radial tree growth in re- significantly positive correlation during the current
cent decades (Fig. 8). Previously, the dendroclimatic January and April. The current monsoon season
signal was weaker, which predominantly reflected a ( June-August) exhibited a significant negative corre-
positive relationship between tree growth and sum- lation between radial growth and precipitation sum
1.5
Analysed period
80
Number of samples
Ring width index
1.0
40
0.5
0
1750 1800 1850 1900 1950 2000
Year
Fig. 7: Tree-ring width standard chronology (black curve) and sample depth (red curve); darker section represents the part
of the chronology that was used for tree growth-climate analyses.2020 N. Schwab et al.: Ecological relationships at a near-natural treeline, Rolwaling Valley, Nepal Himalaya ... 27
Fig. 8: Static correlations (1972–2012) of the TRW chronology with temperature, precipitation
and drought indices (SPEI) for current and previous year’s months and current year seasons;
solid bars indicate significant correlations (p < 0.05).
(Fig. 8). Significantly positive correlations of TRW Species-specific and age-specific transition pat-
to one-month SPEI variables (Fig. 8) emphasise pre- terns, i.e. varying degrees of abruptness of struc-
monsoon moisture sensitivity, which is in line with tural parameters such as diameter at breast height,
the relations of TRW to temperature and precipita- height and densities, occurred across the treeline
tion (Schwab et al. 2018). ecotone, which resulted in a complex stand structure
During the investigated period, i.e. the entire (cf. Schwab et al. 2016). High standard deviations
20th century, the interdependence of TRW and cli- from mean values of growth and density variables
mate variables alternated at least once from a posi- indicated heterogeneous patterns, which differed ac-
tive to a negative correlation, or vice versa. Phases cording to slope, species and elevational zone. Sorbus
with significant correlations without these alterna- microphylla occurred with high continuity, and its den-
tions did not exceed approximately 50 years, and sity-diameter distribution indicates an established
most of the periods were distinctly shorter (cf. population in the krummholz belt (zone C), which
Fig. 9). In summary, both TRW-temperature and co-exists alongside the Rhododendron campanulatum
TRW-precipitation moving windows exhibit a frag- population. The transition from the uppermost part
mented pattern of significant tree growth-climate of the subalpine forest (zone B) to the krummholz
relationships with long insignificant phases (Schwab belt (zone C) is characterized by the most abrupt
et al. 2018). change in Abies spectabilis, Betula utilis and Sorbus mi-
crophylla tree densities along the elevational gradient
(Fig. 3). This abrupt change in species composition
4 Discussion coincided with the most abrupt changes in annual,
winter and spring mean soil temperature at that tran-
4.1 Elevational patterns of tree species distribu- sition. Abrupt microenvironmental changes have
tions and regeneration been associated with abrupt treelines of the southern
hemisphere (H arsch and Bader 2011; Cieraad and
In general, the tree species composition and el- McGlone 2014). Actually, the abruptness pattern of
evational position of the Rolwaling Himal treeline the Rolwaling Himal treeline at the transition from
ecotone coincides with previous findings for north- tall-growing trees to krummholz resembles that of
facing slopes in central and east Nepal (M iehe 1984; typically abrupt treeline forms to some extent. The
Schickhoff 2005; M iehe et al. 2015). Changes in latter, however, lack a krummholz belt.
tree species composition along the elevational gra- The results of our regeneration studies yielded
dient are reflected also in several phytosociological reverse J-shaped density-diameter distributions and
communities of the study slopes that were differenti- indicate intense, sustainable regeneration and, thus,
ated in detail by Bürzle et al. (2017). a considerable potential for upward migrations.28 Vol. 74 · No. 1
Fig. 9: Moving window correlations of the TRW chronology with mean temperatures and precipitation sums: 31-year win-
dows were shifted in one-year steps throughout the entire period of climate data availability (1901 – 2012); periods with
asterisks indicate significant (p < 0.05) correlations.
Results of recruit height distributions and regenera- across the ecotone. Increasing foliar C:N and C:P
tion indices (Schwab et al. 2016) support this finding ratios with elevation suggest decreasing nutrient
and show that Abies spectabilis and Betula utilis have availability at more elevated sites, i.e. zones C and
the potential to become established (beyond seed- D (Müller et al. 2017). Low temperature and poor
ling stage) within the krummholz belt and above. nutrient availability characterise in particular the
Established recruit populations of Rhododendron cam- ecological niche that Rhododendron campanulatum oc-
panulatum and Sorbus microphylla in the alpine dwarf cupies. Low temperature decelerates decomposi-
shrub heath indicate their potential to sprout and tion and reduces nutrient availability in this niche.
survive in the upper treeline ecotone at least their In addition, Rhododendron litter diminishes nutrient
early life stages. Such findings are in line with other availability as well (see below). Plant physiologi-
studies of treelines in Nepal (Ghimire and Lekhak cal characteristics associated with evergreenness
2007; Shrestha et al. 2007; Gaire et al. 2010; such as nutrient storage and earlier photosynthetic
Ghimire et al. 2010; Gaire et al. 2011; Sujakhu et activity might increase Rhododendron’s competi-
al. 2013; Gaire et al. 2014; R ana et al. 2016; Bürzle tive strength under cool and nutrient poor condi-
et al. 2018). However, results are hardly comparable tions in the krummholz belt. The dense, evergreen
since most of these studies were conducted at an- Rhododendron canopy reduces insulation in compari-
thropogenic treelines, which have been depressed son to the mixed forest below and results in the
and modified by long-lasting human impact. abrupt soil temperature decrease at the transition
from closed mixed forest to Rhododendron campanu-
latum krummholz belt. Variation partitioning indi-
4.2 Population density-environment relationships cated that apart from thermal limitations soil vari-
ables, and nutrient variables in particular, signifi-
The results support that species-specific vari- cantly contributed to the total explained variation
ation in adult and juvenile stand density along the of adult tree density.
treeline ecotone depends, to varying extents, on Juvenile population density shows a stronger
soil, climatic and topographic variables. Variables dependence on the climatic variable of temperature
with a strong influence on the ordinations reflect in comparison to adults. In addition, differences
significant differences in mean values between in microrelief, surface structure and within-plot
zones with differing densities of Rhododendron cam- ground cover influence the occurrence of juvenile
panulatum. Low soil pH limits nutrient availability individuals to a larger extent compared to adult tree2020 N. Schwab et al.: Ecological relationships at a near-natural treeline, Rolwaling Valley, Nepal Himalaya ... 29
density, which supports previous assumptions of These results are consistent with several previous
differences between juvenile and adult tree growth studies on Abies spectabilis growth patterns (Cook et
(e.g., Smith et al. 2003; Wieser et al. 2014). Likewise, al. 2003; Sano et al. 2005; Gaire et al. 2011; Lv and
not merely soil temperature, but also nitrogen sup- Zhang 2012; K haral et al. 2014; Sohar et al. 2017;
ply and availability, and soil moisture differentiated K haral et al. 2017; Tiwari et al. 2017; Gaire et al.
the species composition of phytosociological com- 2017a) and other coniferous species from sites in the
munities throughout the Rolwaling Himal treeline Himalaya and the Tibetan Plateau (Bräuning and
ecotone (Bürzle et al. 2017). In addition, Bürzle Griessinger 2006; Fan et al. 2008; Borgaonkar et
et al. (2018) found species-specific microhabitat al. 2011; Thapa et al. 2015; Li et al. 2017; Panthi et
preferences for the establishment of seedlings and al. 2017; Gaire et al. 2019). As in our study, the tree
reported that Abies spectabilis seedlings are more as- growth-climate correlation coefficient values were
sociated with a ground cover of litter, whilst Betula mostly in a similar, rather low range. To conclude,
utilis and Rhododendron campanulatum establish pref- a relatively wide spectrum of various radial growth-
erably on bryophyte mats. Further studies of, inter climate relationships exists at regional and local
alia, snowmelt timing, seedling survival facilitating scales within the Himalayan region of Nepal.
microsite parameters and seedling ecophysiology, With regard to spring moisture sensitivity, our
focusing on youngest life stages, are badly needed results largely match the findings of earlier stud-
to increase the understanding of response pro- ies on sites in Nepal and other Himalayan regions.
cesses at the study site and in treeline ecotones in However, certain published results, including those
general (Bader et al. 2018; Brodersen et al. 2019). from study sites not far from our site, showed dis-
Spatial pattern analyses of the population densities parate relations of tree growth to temperatures
revealed that environmental variables could not ac- and precipitation in the winter prior to the grow-
count for some of the variance of spatial patterns ing season. The general east-west moisture gradi-
(Schwab et al. 2017). This finding as well as gen- ent in the Himalaya and Nepal (A nders et al. 2006;
eral model-based results (Dullinger et al. 2004; Talchabhadel et al. 2019) explains variations in tree
Holtmeier and Broll 2010; Nathan et al. 2011; growth-climate relations to only a limited extent.
M artínez et al. 2012; Johnson et al. 2017) suggest From several previous studies (Shrestha et al. 2015;
that species-specific migration potentials, seed-dis- Thapa et al. 2015; Elliott and Cowell 2015; Sohar
persal strategies and ecological drift might contrib- et al. 2017; Chhetri and Cairns 2016; K haral et
ute to this yet-unexplained variance. In summary, al. 2017; R ayback et al. 2017; Shrestha et al. 2017;
the role of temperature for treeline tree population Singh et al. 2018), it can be assumed that deviations
density and species distributions has to be relativ- in results were due to local variations in the het-
ized in favour of topographic and nutrient budget erogeneous environment. Sparse (and rather short)
related factors in accordance with the results of records of climate data from high elevation sites or
Weiss et al. (2015), Müller et al. (2016a; 2016b), derived gridded data might not capture these vari-
L ett and Dorrepaal (2018) and others. ations. Moreover, spatially differing characteristics
of climate factors at local and regional scales require
consideration in order to develop generalised con-
4.3 Tree growth-climate relationships clusions. For instance, the date of monsoon onset
affects the radial increment in varying intensities at
4.3.1 Moisture deficit during recent decades dry and wet sites (Shrestha et al. 2015). Finally, soil
conditions, micro-topography, light conditions, land
Results for the period with most stable correla- use and other site factors might account for differ-
tions, namely 1972–2012, suggest that Abies spectabi- ences in tree growth-climate relationships.
lis tree growth was sensitive to temperature-induced
moisture deficits during the pre-monsoon season.
A negative relationship between radial tree growth 4.3.2 Changing long-term tree growth-climate
and spring temperature was apparent. It indicates relationships
a negative relation of growth to temperature-en-
hanced evapotranspiration. In addition, the positive The static correlation of the whole CRU data pe-
correlation between TRW and April precipitation riod from 1901 onwards yields rather low correlation
implies moisture sensitivity during the springtime coefficients. This finding is in line with previous stud-
(Fritts 1976). ies on the Himalaya (e.g., Gaire et al. 2017b; K haral30 Vol. 74 · No. 1
et al. 2017; Tiwari et al. 2017) and other regions (St. 4.4 Control of upslope migration by feedback
George 2014; K aczka et al. 2016). A closer exami- processes
nation of tree growth-climate relationships through
moving windows correlations revealed unstable cor- The responsiveness of the Rolwaling Himal tree-
relations throughout the entire period under analysis. line to climate warming is currently rather low in
According to the results of the moving correla- terms of a treeline shift (Fig. 10), as assumed for near-
tions, Abies trees presumably became more sensitive natural Himalayan treelines and krummholz treelines
to climate during the reinforced climate-warming pe- in general (Harsch and Bader 2011; Chhetri and
riod that began in the 1970s. Similar to the alterations Cairns 2015; Schickhoff et al. 2016a; Chhetri and
of radial tree growth-climate correlations and signal Cairns 2018; Pandey et al. 2018). Aforementioned re-
strengths, the climate changed non-linearly, with a sults contribute to a simplified system perspective to
temperature increase in the early-20th century, a stable estimate the upward migration potential of tree spe-
phase during the mid-20th century and a pronounced cies qualitatively and to advance towards an approach
warming during the late-20th century and early-21st to model the complex system. Elevational patterns
century (cf. Schwab et al. 2018). The period of stable of tree species distributions and regeneration, pop-
climate conditions (mid-20th century) coincided with a ulation density-environment relationships and tree
positive relationship of TRW to summer temperature growth-climate correlations point to a Rhododendron
and a negative relationship of TRW to March precipi- campanulatum based positive feedback process, which
tation, which implies sufficient moisture availability contributes to the currently low responsiveness of the
in spring, and growth limitation mostly due to low treeline position to climate change.
summer temperatures. During the climate-warming The system approach and the theory of multiple
phase that occurred earlier in the century, the nega- stable ecosystem states include feedback loops with
tive relation of tree growth and the May temperature positive and negative couplings resulting in dynamic
indicated moisture sensitivity. This signal was less alternative stable states. Each negative coupling in a
significant than it was during the last 40 years of the feedback loop reverses the effect of a positive cou-
investigated period but already apparent. The climate pling. Thus, the effect an element exerts on itself will
warming-induced increase in evapotranspiration and be positive in any loop with an even number of nega-
the consequently intensified moisture stress might tive couplings (Thomas 1981; Thomas and D’ A ri
have triggered a shift from the summer tempera- 1990; Kump et al. 2004). An external environmen-
ture-limited to the spring moisture-limited growth tal forcing factor such as soil temperature can push
response, and the stabilisation of the correlations to- the positive feedback system to transient, so-called
wards the end of the investigated period. In contrast, ‘unstable’ equilibrium states. Such an unstable equi-
moisture availability did not stress Abies spectabilis at librium state separates two or multiple stable states
a treeline in western Himalaya, most likely in conse- (also called alternative stable states). The system oc-
quence of distinctly higher precipitation and soil mois- cupies briefly an unstable equilibrium state before
ture in comparison to our site, contrary to the general either returning to the previous stable state or to
east-west moisture gradient (cf. Gerlitz et al. 2016; an alternative stable state. In opposite to gradual or
Müller et al 2016; Tewari et al. 2018). Our assump- abrupt phase shifts with two opposing, exclusive sta-
tion is consistent with the change in temperature and ble states, the conditions for alternative stable states
SPEI trends of the study area as well as the intensi- are not mutually exclusive. They can exist next to
fied spring droughts in the central Himalaya in recent each other at different spatial locations of the system
decades (Panthi et al. 2017). Thus, increased drought and all alternative states are possible within a range
might have led to divergence in growth-climate rela- of environmental conditions. In summary, positive
tionships, as other studies have observed (R ita et al. feedback loops result in differential regulation and
2014; Galván et al. 2015; Jiao et al. 2015; Gaire et can permit the choice between two or more stable
al. 2020), with Abies spectabilis trees exhibiting growth steady states (Thomas and D’ A ri 1990; Scheffer et
plasticity in adaptation to the changing environment al. 2001; Kump et al. 2004; Schröder et al. 2005; K im
similarly to other coniferous species (e.g., Zhang and and Lee 2015; Moffett et al. 2015). The outline of
Wilmking 2010; Zhang et al. 2011; Natalini et al. the potential positive feedback processes that main-
2016; M artin-Benito et al. 2017). This adaptation af- tain the competitiveness of Rhododendron campanula-
fects the competitiveness of Abies spectabilis and, in a tum contains an even number of negative couplings
wider sense, also the sensitivity and responsiveness of (two), that result in a positive feedback loop (Fig. 11).
the Rolwaling Himal treeline to climate change. Thus, a forcing such as increasing soil temperatureYou can also read