Ecology and conservation of the African Lion
←
→
Page content transcription
If your browser does not render page correctly, please read the page content below
Master Project submitted to obtain the degree of Master in Biology, specialisation Biodivers
                            ity: conservation and restoration.
    Ecology and conservation of the African Lion
  (Panthera leo) in and around Meru National Park,
                        Kenya
                                Kennedy Kariuki (s0180677)
              University of Antwerp, Faculty of Science, Department of Biology
                                Evolutionary Ecology Group
                                  Kenya Wildlife Service
                                        Supervisors:
                                  Prof.dr.ir. H.H. de Iongh
                                        Kevin Groen
                                        Luka Narisha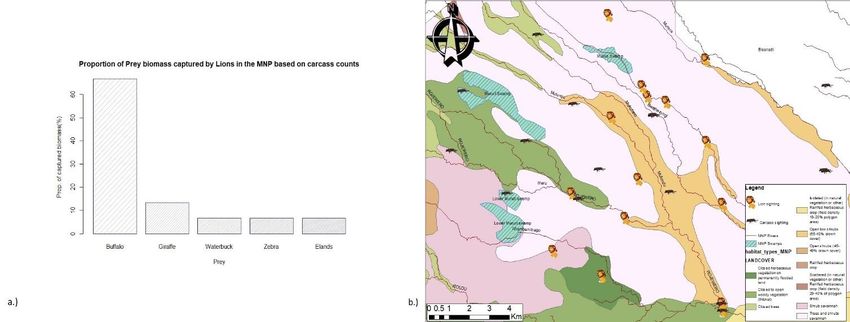
DECLARATION
This thesis is developed within a framework of collaboration between the University of Antwerp,
Institute of Environmental Sciences of the Leiden University in the Netherlands (CML), Kenya
Wildlife Service (KWS), The Born Free foundation Kenya and the Leo Foundation, Netherlands.

                                                                                                  I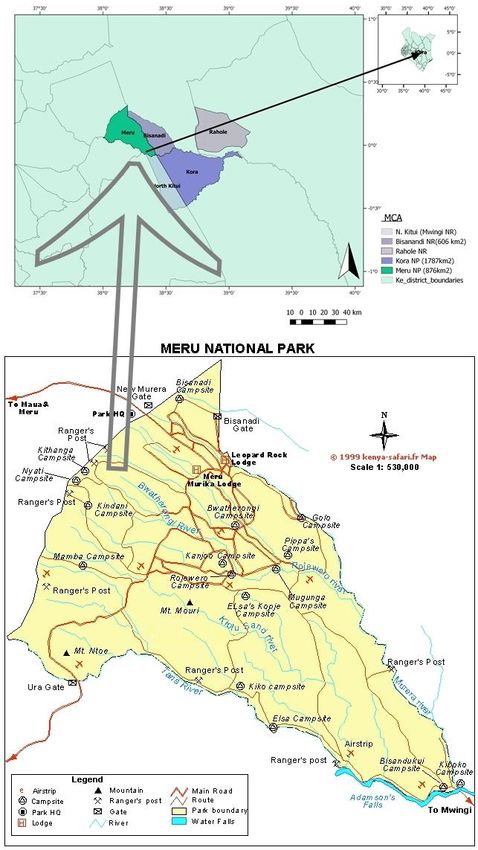
LIST OF ABBREVIATIONS AND ACRONYMS
AUC – Area Under Curve

BNR – Bisanadi National Reserve

CAP 376, WCMA –Wildlife Conservation and Management Act, Chapter 376 of the Kenya constitution
which was enacted in 2013.

FMD – Foot and Mouth Disease

IUCN – International Union for the Conservation of Nature

KEBS – Kenya Bureau of Standards

KNP – Kora National Park

KWS – Kenya Wildlife Service

LBL - Lewa Borana Landscape

MCA – Meru Conservation Area

MNP – Meru National Park

MNR – Mwingi National Reserve

PCF – Predator Compensation Fund

PSL – Project Snow Leopard

RNR – Rahole National Reserve

ROR – Relative Occurrence Rate

SDM – Species Distribution Model

TLU – Tropical Livestock Unit

UNESCO - The United Nations Educational, Scientific and Cultural Organization.

                                                                                                 II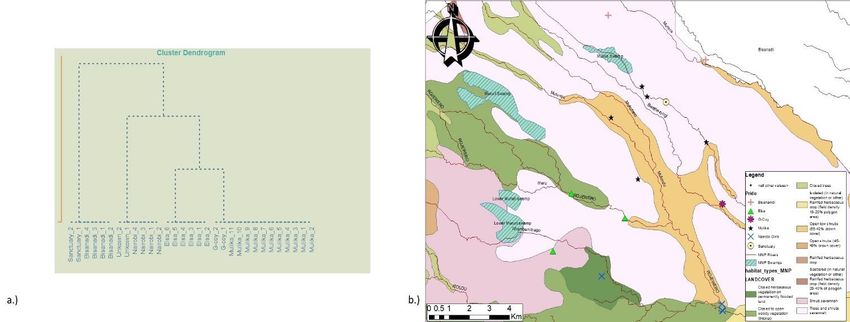
ABSTRACT
My research project covered a study on lion population size, pride structure, reproductive success,
foraging success, distribution and factors influencing human-lion interactions in the MNP. Data on lion
presence were collected during transect counts and through direct opportunistic searches and
observations, while data on human-lion interactions were collected through a questionnaire survey that
was administered in nine villages (sub-locations) around the park. Results show a lion density of 6.8
lions/km2 and an estimated lion population size of 31 individuals. I identified four lion prides in the park.
The pride structure seems to be influenced by prey availability and seasonal fluctuations of water and prey
in and around the MNP. Attitudes towards carnivores are predominantly influenced by livestock ownership
and level of education. Livestock husbandry practices, particularly the height of the boma fence and the
type of livestock enclosure (boma) also influence livestock loss and mortality.

The questionnaire survey showed that human-lion conflicts mainly occur near the north-eastern boundary
of the MCA, which is unfenced. The frequency of reported lion conflict incidences in the area peaks around
August which is also the driest month of the year in the MCA and the month with the least number of lion
observation sightings inside the park. Livestock raiding behaviour therefore seems to be mainly influenced
by lion distribution in and around the park, the presence of livestock and livestock husbandry practices
such as the type and height of the boma fence as well as the influence of seasonality. Other livestock
husbandry practices (such as the use of flashlights, adult herders/guards and guard dogs) also reduce
livestock depredation, although habituation to flashlights reduces the effectiveness of the flashlights and
the Muslim pastoralists in the area (who also own the majority of livestock lost to carnivores) do not use
guard dogs due to religious beliefs.

                                                                                                                III
SUMMARY

The aim of this research is to study lion population size, pride structure, reproductive success, foraging
success, lion distribution and factors influencing human-lion interactions of the African lion in and around
Meru National Park in Kenya. Insights on the lion distribution range can help in indicating conflict hotspots
and to warn and inform local people. Conflicts between humans and wildlife in Africa have increased
during the last decades. Borders of National Parks become more and more densely inhabited by humans
as a result of expanding human populations, which has led to the increase in conflicts between wildlife
and humans. Meru National Park experiences low rainfall and is bordered by different ethnic groups which
increases the complexity of the conflict. Consequently, there is human pressure on the borders of the park,
thereby increasing conflicts between humans and wildlife. Only the western part of the park is fenced for
70 kms, enabling herbivore migration only from other non-fenced parts of the park boundary. This also
makes it possible for lions and other carnivores to go outside of the park borders and to come in close
contact with livestock, especially at watering points during the dry season. This increases the chances of
human-lion conflict. The killings have a severe economic impact because most local farmers are financially
dependent on their livestock for their livelihoods. In recent years, several lions have therefore already
been killed in retaliation by the local population, to protect their own lives and their economically
significant livestock, most of which go unreported. This research contributes to the PhD thesis of Luka
Narisha and Kevin Groen and is supervised by the University of Antwerp, the University of Leiden and the
Kenya Wildlife Service.

                                                                                                                IV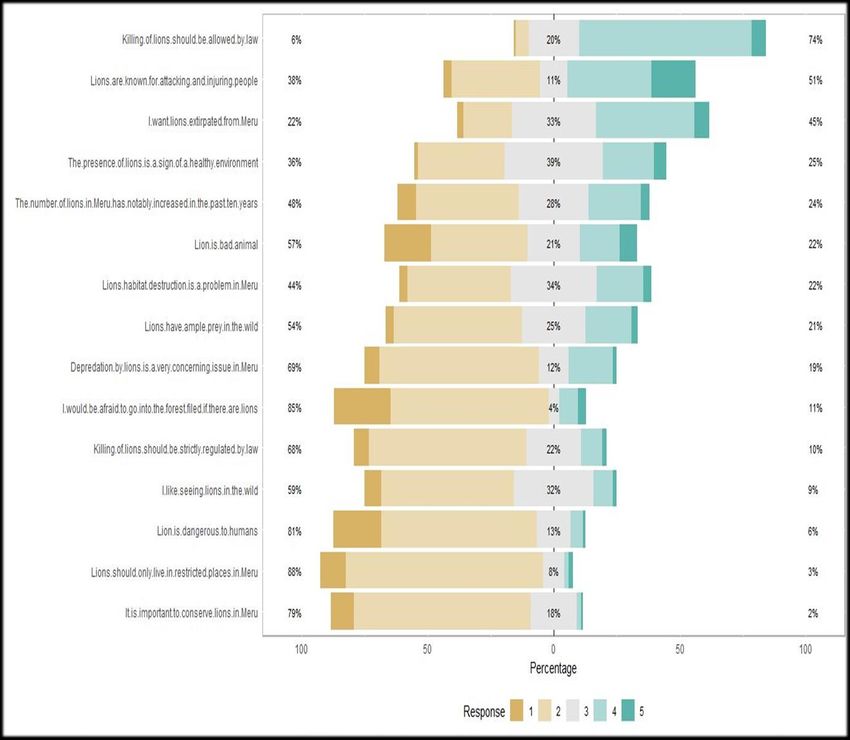
TABLE OF CONTENTS
DECLARATION ......................................................................................................................................................... I
LIST OF ABBREVIATIONS AND ACRONYMS ............................................................................................................. II
ABSTRACT ............................................................................................................................................................. III
SUMMARY ............................................................................................................................................................ IV
CHAPTER ONE .................................................................................................................................................... - 8 -
   1.0 INTRODUCTION ............................................................................................................................................... - 8 -
      1.0.1 Lion population size, pride structure, reproductive success, foraging success and distribution ........... - 8 -
      1.0.2 Human dimensions of carnivore conservation ..................................................................................... - 10 -
           1.0.2.1 Attitudes towards carnivores .......................................................................................................................... - 11 -
           1.0.2.2 Livestock husbandry techniques ...................................................................................................................... - 12 -
           1.0.2.3 Human-carnivore conflict intervention ........................................................................................................... - 12 -
   1.1 RESEARCH OBJECTIVES .................................................................................................................................. - 14 -
CHAPTER TWO ................................................................................................................................................. - 15 -
   2.0 METHODOLOGY............................................................................................................................................. - 15 -
      2.0.1 Study area .............................................................................................................................................. - 15 -
   2.1 DATA COLLECTION ......................................................................................................................................... - 19 -
      2.1.1 Lion population size, pride structure, reproductive success, foraging success and distribution ......... - 19 -
      2.1.2 Human dimensions of carnivore conservation ..................................................................................... - 20 -
   2.2 DATA ANALYSIS AND STATISTICS .................................................................................................................. - 22 -
      2.2.1 Lion population size, pride structure, reproductive success, foraging success and distribution ......... - 22 -
      2.2.2 Human dimensions of carnivore conservation ..................................................................................... - 24 -
CHAPTER THREE ............................................................................................................................................... - 25 -
   3.0 RESULTS ......................................................................................................................................................... - 25 -
      3.0.1 Lion population size, pride structure, reproductive success, foraging success and distribution ......... - 25 -
      3.0.2 Human dimensions of carnivore conservation ..................................................................................... - 30 -
           3.0.2.1 Carnivore knowledge and attitude towards carnivores .................................................................................. - 30 -
           3.0.2.2 Livestock loss and husbandry techniques ....................................................................................................... - 32 -
           3.0.2.3 Human-carnivore conflict intervention ........................................................................................................... - 35 -

CHAPTER FOUR ................................................................................................................................................ - 36 -
       4.0 DISCUSSION ............................................................................................................................................... - 36 -
       4.0.1 Lion population size, pride structure, reproductive success, foraging success and distribution ......... - 36 -
       4.0.2 Human dimensions of carnivore conservation ..................................................................................... - 38 -
           4.0.2.1 Carnivore knowledge and Attitudes towards carnivores ................................................................................ - 39 -
           4.0.2.2 Livestock loss and husbandry techniques ....................................................................................................... - 40 -
           4.0.2.3: Human – carnivore conflict intervention ....................................................................................................... - 41 -

CHAPTER FIVE .................................................................................................................................................. - 42 -
   5.0 CONCLUSION ................................................................................................................................................. - 42 -
ACKNOWLEDGEMENTS .................................................................................................................................... - 43 -
REFERENCES ..................................................................................................................................................... - 44 -
APPENDICES ......................................................................................................................................................... 56
   APPENDIX 1: DATA SHEET FOR OBSERVATION WITH VOCALISATION ...................................................................................... 56
   APPENDIX 2 : DATA SHEET FOR OBSERVATION WITHOUT VOCALISATION ................................................................................ 58

                                                                                                                                                                                    V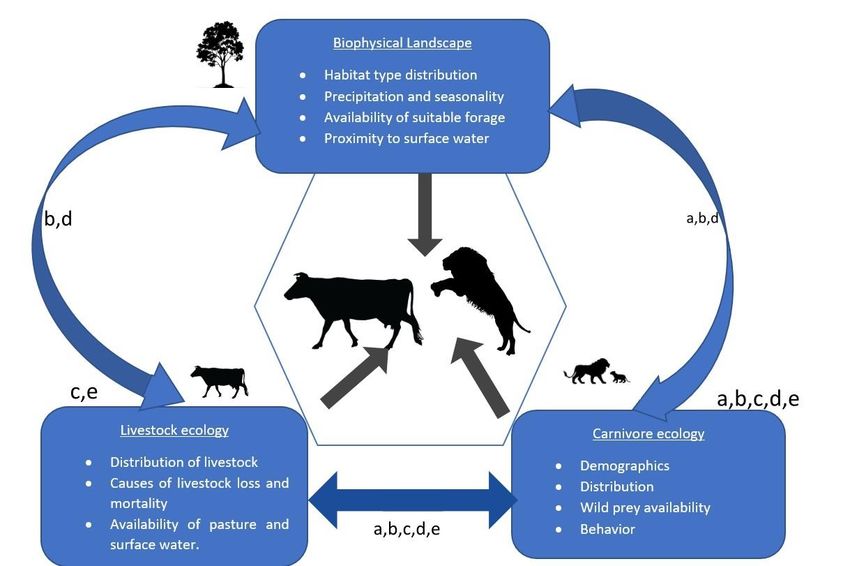
APPENDIX 3: DATA SHEET FOR QUESTIONNAIRE SURVEY TO THE LOCAL COMMUNITY ............................................................... 60
        Socio-economic characteristics of the respondent ..........................................................................................................60
        Economic level of the household ......................................................................................................................................60
        Lion management, knowledge and perception ................................................................................................................61
        Carnivore knowledge ........................................................................................................................................................62
        Livestock depredation .......................................................................................................................................................62
APPENDIX 4: TABLE SHOWING THE MODEL EVALUATION OF LION DISTRIBUTION MAXENT MODELS .............................................. 66
APPENDIX 5: CORRELATION GRAPH FOR PREDICTOR VARIABLES USED IN THE LION DISTRIBUTION MAXENT MODEL ......................... 67
APPENDIX 6: GRAPH OUTPUT SHOWING SOCIO-ECONOMIC DESCRIPTIONS OF THE QUESTIONNAIRE SURVEY RESPONDENTS ............. 68
APPENDIX 7: GRAPH OUTPUT SHOWING DESCRIPTIONS OF CARNIVORE KNOWLEDGE AND ATTITUDES TOWARDS CARNIVORES BY THE
QUESTIONNAIRE SURVEY RESPONDENTS............................................................................................................................ 69
APPENDIX 8: GRAPH OUTPUT SHOWING RESULTS FROM THE LIKERT SCALE USED TEST ATTITUDE LEVELS OF THE QUESTIONNAIRE SURVEY
RESPONDENTS.............................................................................................................................................................. 70
APPENDIX 9: GRAPH OUTPUT SHOWING CORRELATION STRUCTURE OF FACTORS INFLUENCING ATTITUDES TOWARDS CARNIVORES
BASED ON RESPONSES FROM THE QUESTIONNAIRE SURVEY. ................................................................................................. 71
APPENDIX 10: GRAPH OUTPUT SHOWING DATA DISTRIBUTION OF FACTORS INFLUENCING ATTITUDES TOWARDS CARNIVORES BASED
ON RESPONSES FROM THE QUESTIONNAIRE SURVEY. ........................................................................................................... 72
................................................................................................................................................................................. 72
APPENDIX 11: GRAPH SHOWING FACTORS INFLUENCING LIVESTOCK DEPREDATION AROUND THE MCA BASED ON RESPONSES FROM
THE QUESTIONNAIRE SURVEY. ......................................................................................................................................... 73
APPENDIX 12: TABLE SUMMARIZING THE ECOLOGY AND CONSERVATION OF LIONS IN THE MNP WITH SUGGESTIONS OF POSSIBLE
CONFLICT INTERVENTION MEASURES. ............................................................................................................................... 74

                                                                                                                                                                                          VI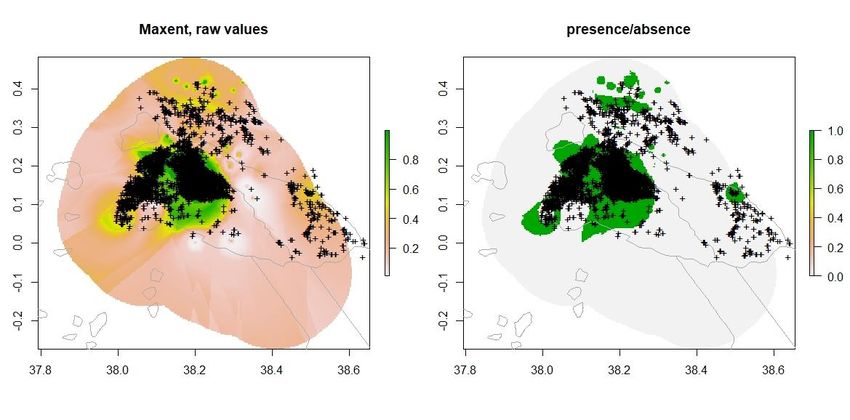
LIST OF FIGURES

FIGURE 1: MAP SHOWING THE POSITION OF MERU NATIONAL PARK WITHIN THE MERU CONSERVATION AREA AND KENYA (KWS 2014). ................... - 18 -
FIGURE 2: MAP SHOWING THE CORE SURVEY AREA FOR LION OBSERVATION. .................................................................................................... - 19 -
FIGURE 3: MAP OF AREAS AROUND THE MNP WHERE THE QUESTIONNAIRE SURVEY WAS ADMINISTERED. .............................................................. - 21 -
FIGURE 4: DETAILED AGE STRUCTURE CLASSIFICATION OF LIONS OBSERVED IN THE MNP FROM 7TH FEBRUARY,2019 TO 17TH APRIL, 2019. ................. - 25 -
FIGURE 5: FREQUENCY OF OBSERVED GROUP SIZES OF ADULT LIONS IN THE MERU NATIONAL PARK FROM 7TH FEBRUARY, 2019 TO 17TH APRIL, 2019. ... - 26 -
FIGURE 6: A.) A CLUSTER DENDROGRAM SHOWING LION PRIDE STRUCTURE IN THE MERU NATIONAL PARK. B.) MAP SHOWING POSITION OF DIFFERENT LION
      PRIDES AND COALITIONS IN THE PARK. ........................................................................................................................................... - 26 -
FIGURE 7: A). LINE PLOT SHOWING PREFERRED PRIDE SIZES BY FEMALE LIONS IN THE MNP IN RELATION TO REPRODUCTIVE SUCCESS. B). LOCAL REGRESSION
      EXAMINING THE EFFECT OF REPRODUCTIVE SUCCESS ON PROPORTION OF FEMALES IN THE MNP LION PRIDES. ................................................ - 27 -
FIGURE 8:A.) COMPOSITION OF KILLS BY LIONS IN THE MNP BASED ON CARCASS SIGHTINGS DATA COLLECTED DURING THE FIELDWORK PERIOD SHOWS THAT
      LIONS IN THE PARK HAVE THE HIGHEST PREFERENCE FOR THE CAPE BUFFALO. B.) POSITION OF RECORDED LION AND CARCASS SIGHTINGS IN RELATION TO
      RIVERS AND SWAMPS IN THE PARK. ................................................................................................................................................ - 27 -
FIGURE 9: GRAPHS SHOWING A.) MEAN MONTHLY RAINFALL IN THE MCA FROM 2008-2018; B.) MEAN MONTHLY RIVER LEVELS OF RIVER MURERA,
      ROJEWERO AND MUTUNDU FROM 2008 – 2018; C.) MEAN MONTHLY CONFLICT REPORTS IN THE MCA BY LIONS, HYENAS AND BUFFALOS; AND D.)
      MEAN GROUP SIZES SIGHTED PER MONTH BASED ON THE BORN FREE LION MONITORING DATA (2016 – 2019)............................................. - 28 -
FIGURE 10:: PLOT SHOWING THE RELATIVE CONTRIBUTION OF EACH OF THE VARIABLES TO THE SPECIES DISTRIBUTION MODEL . .................................... - 29 -
FIGURE 11: OUTPUT MAPS FROM THE RAW MAXENT MODEL SHOWING POTENTIAL DISTRIBUTION OF LIONS IN THE MNP. .......................................... - 29 -
FIGURE 12: BUBBLE PLOT SHOWING THE EFFECT OF LIVESTOCK PREDATION ON ATTITUDES TOWARDS CARNIVORES . ................................................... - 31 -
FIGURE 13: PLOT OUTPUT OF THE LOGISTIC MIXED MODEL. ......................................................................................................................... - 32 -
FIGURE 14: GRAPH OUTPUT FROM THE PCA SHOWING THE VARIATION EXPLAINED BY THE DIFFERENT PRINCIPAL COMPONENTS (PCS) IN OUR DATASET. .. - 33 -
FIGURE 15: BIPLOT OF THE PCA OUTPUT SHOWING SIMILARITIES IN HUSBANDRY PRACTICES AND CAUSES OF LIVESTOCK LOSS AMONG THE DIFFERENT SUB -
      LOCATIONS. ............................................................................................................................................................................ - 34 -
FIGURE 16: LDA OUTPUTS SHOWING THE DIFFERENCES BETWEEN THE TWO MAIN SOURCES OF LIVELIHOOD IN THE AREA............................................ - 34 -
FIGURE 17: GRAPH SHOWING A.) WHETHER DEPREDATION CAN BE AVOIDED; B.) THE MOST EFFECTIVE METHODS OF MITIGATING AGAINST LIVESTOCK
      DEPREDATION AND B.) THE WILLINGNESS OF RESPONDENTS TO SEEK COMPENSATION; AND D.) THE REASON WHY LIONS ATTACK LIVESTOCK BASED ON
      QUESTIONNAIRE RESPONSES. ....................................................................................................................................................... - 35 -
FIGURE 18: SCHEME SHOWING ECOLOGICAL INTERACTIONS BETWEEN ASPECTS OF THE BIOPHYSICAL LANDSCAPE, CARNIVORE ECOLOGY, AND LIVESTOCK
      ECOLOGY THAT INFLUENCE LIVESTOCK PREDATION EVENTS IN THE MCA: (A) DENSITY-MEDIATED TROPHIC CASCADES; (B) LANDSCAPE OF FEAR FOR
      CARNIVORES AND BEHAVIOURALLY MEDIATED TROPHIC CASCADES ; (C) OPTIMAL FORAGING THEORY (AS APPLIES TO CARNIVORE–LIVESTOCK
      INTERACTIONS), WHICH INCLUDES THE REAL OR PERCEIVED COST OF HUNTING LIVESTOCK ; (D) INTER AND INTRA-SPECIES INTERACTIONS; AND (E)
      PREDATOR–PREY SHELL GAMES AND RESPONSE RACES INCLUDING HUMANS SERVING AS THE RESPONSE ON BEHALF OF THE LIVESTOCK PREY . .......... - 41 -
FIGURE 19: PAIRS PLOT OUTPUT SHOWING COLLINEARITY OF THE VARIABLES USED IN THE MAXENT MODEL. ................................................................67
FIGURE 20: STACKED BAR GRAPHS SUMMARISING THE SOCIO-ECONOMIC CHARACTERISTICS OF THE RESPONDENTS. ......................................................68
FIGURE 21: STACKED BAR GRAPH SHOWING CARNIVORE KNOWLEDGE AND ATTITUDE TOWARDS CARNIVORE IN THE AREA . ..............................................69
FIGURE 22: GRAPH SHOWING OUTPUTS FROM THE LIKERT SCALE QUESTIONS THAT MEASURED ATTITUDE. TO DO THIS, WE ASSIGNED VALUES TO RESPONSES (1:
      STRONGLY AGREE, 2: AGREE, 3: NEUTRAL, 4: DISAGREE, 5: STRONGLY DISAGREE) AND MULTIPLIED THE COUNT OF RESPONDENTS FOR EACH QUESTION
      WITH ITS ASSIGNED VALUE, SUMMED THE VALUES, AND DIVIDED THE SUM BY THE TOTAL NUMBER OF RESPONDENTS . ........................................... 70
FIGURE 23: GRAPH SHOWING CORRELATION STRUCTURE OF THE MOST IMPORTANT PREDICTORS OF ATTITUDES TOWARDS CARNIVORES IN THE AREA. ...........71
FIGURE 24: VIOLIN PLOTS SHOWING HOW DISTANCE TO PARK, LIVESTOCK OWNERSHIP AND EDUCATION LEVEL INFLUENCE ATTITUDES TOWARDS CARNIVORES IN
      THE AREA.................................................................................................................................................................................... 72
FIGURE 25: GRAPH SHOWING A.) THE PROPORTIONS OF DIFFERENT CARNIVORES RESPONSIBLE FOR DEPREDATION OF DIFFERENT LIVESTOCK TYPES; B.)
      PROPORTIONS OF DEPREDATION INCIDENCES OCCURRING INSIDE THE BOMA OR AWAY FROM THE BOMA ; C.) LIVESTOCK LOST THROUGH DIFFERENT
      CAUSES; D.) DISTANCE WALKED WHILE HERDING LIVESTOCK DURING WET AND DRY SEASONS ; E.) RESPONSES ON WHETHER LIONS ATTACK PEOPLE; AND
      THE TRENDS OF LIVESTOCK ATTACKS IN THE AREA FOR THE LAST FIVE YEARS BASED ON RESPONSES FROM THE QUESTIONNAIRE SURVEY . ..................... 73

                                                                                                                                                                                                        VII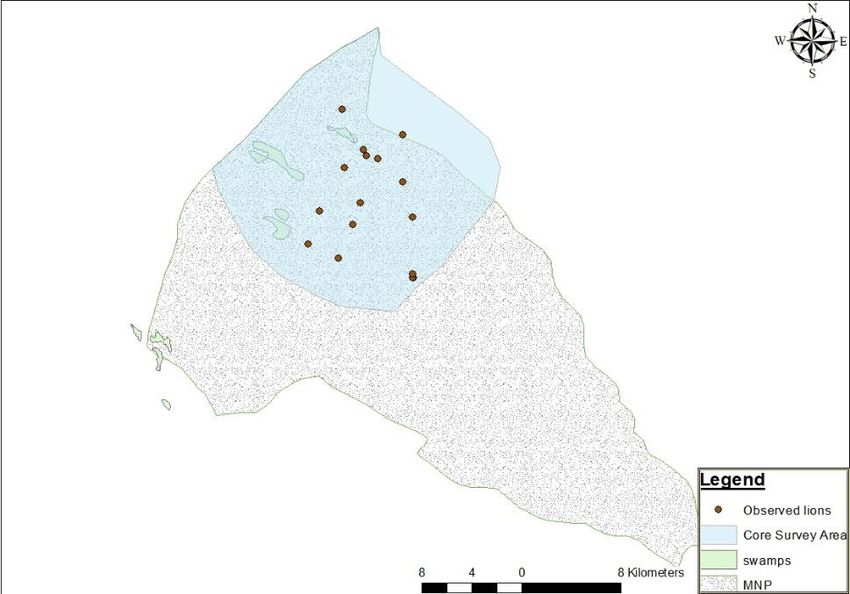
CHAPTER ONE
1.0 INTRODUCTION
1.0.1 Lion population size, pride structure, reproductive success, foraging success and distribution
Large carnivores are keystone species in the African savannah ecosystem despite their relatively low densities
(Kissui 2008; Croes et al., 2011). They consist of carnivores larger than 20 kg such as the lion (Panthera leo),
leopard (Panthera pardus), cheetah (Acinonyx jubatus), spotted hyena (Crocuta crocuta), brown hyena (Hyena
brunea), striped hyena (Hyaena hyaena) and African wild dog (Lycaon pictus) (Mills, 1991). Removal of these
predators may result in cascading effects on the ecosystem such as a surge in meso-predators and the
overabundance of certain herbivore species (Ripple et al, 2013; Terborgh et al., 2010). Furthermore, top
predators are keystone species which interact with populations of herbivores and smaller carnivores at the lower
trophic levels (Mills, 1991; Noss et al., 1996). Generally, large carnivore populations are regulated by the
availability of prey animals and not the other way around (Sinclair et. al., 2010). However, large carnivores can
also influence the abundance of certain vulnerable prey species (Caughley and Sinclair 1994, Ng’weno et al 2017)
Competitive interactions between conspecifics as well as different carnivore species also exist when resources
are limited, since a unit of food consumed by one individual cannot be consumed by another individual (Linnell
and Strand, 2000). Predators can also have interspecific interactions and competition, even with an abundance
of resources (Linnell and Strand, 2000). There is a relationship between predator size and prey size whereby the
smaller a predator is, the smaller its preferred prey (Carbone et al 1999; Sinclair et al., 2003; Owen-Smith and
Mills, 2008). As a result of those different types of interactions in an ecosystem, it is submitted that large
carnivores play significant roles in maintaining the balance and ecological functioning in an ecosystem (Terborgh,
1988; Ripple et al. 2014).

The habitat range of large carnivores in Africa is mainly savannah landscapes, which includes ecosystems that
cover mosaics of grasslands, wetlands and dry woodlands (Kingdon, 1997; Riggio et al., 2013). The size of these
landscapes has however declined by 71% (from ~11.9 million km2 in 1960 to ~3.5 million km2 in 2012) (Riggio et
al., 2013). Lions survive in only 25% of the remaining savannah habitat in Africa (Riggio et al., 2013). Populations
of large carnivores have also declined rapidly with lion population estimates ranging between ~22,000 to
~38,000 in 2013, from ~200,000 in the beginning of the century (Chardonnet 2002; Bauer and Van Der Merwe
2004; Riggio et al., 2013; Yirga et al. 2014). A major driver for this decline is the increasing level of human
interference caused by an almost four-fold human population growth in the Sub-Saharan Africa since 1950 until
2000 which also plays a significant role in influencing large carnivore populations (Riggio et al., 2013). The loss
of savannah habitat due to human interference is one of the main reasons why populations of large carnivores
are decreasing and becoming threatened (Yirga et al., 2014; IUCN Red List, 2019). Large carnivores are vulnerable
mainly because of their low abundance and large home ranges compared to prey species such as gazelles or
zebras (Noss et al., 1996).This often increases their interactions with humans which highlights the need for
landscape-based approaches aimed at promoting coexistence between people and wildlife beyond protected
areas and within socio-ecological systems (Tyrrell et al, 2020).

There has been a sharp decline in lion populations globally, more so in the East, West and Central African regions
(Bauer et al., 2015). Recent taxonomic revision of Felidae describes the Asian lion sub-population as being
closely related to the lion subspecies in the northern, western and central regions of Africa (Panthera leo leo)
which is Regionally Critically Endangered on the global IUCN Red List while the southern and eastern African
lions (Panthera leo melanochaita) which are Regionally Endangered have been classified as a distinct subspecies
(Kitchener et al. 2017). In Kenya, the southern sub-species of the lion (Panthera leo melanochaita; Hamilton
Smith (1842)) is listed as a protected animal in the Wildlife Conservation and Management Act .CAP376 (WCMA

                                                                                                                       -8-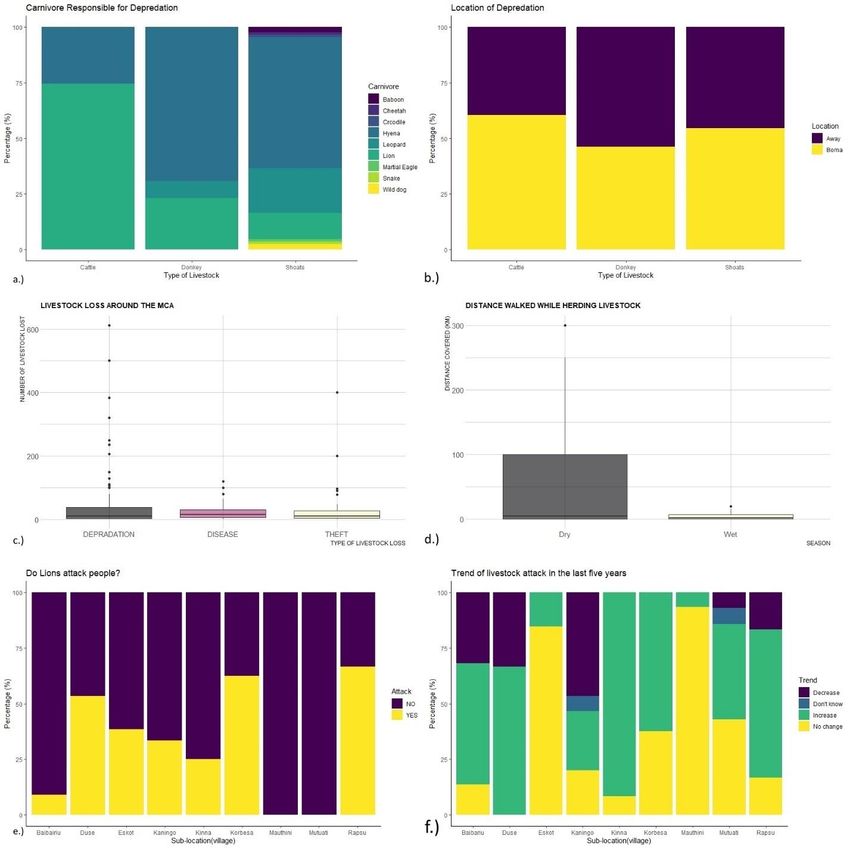
2013). The lion population in Kenya has declined from 2700 individuals in 2000 to 2000 individuals in 2010 (KWS
2014). The current known permanent lion range in Kenya is 18% of the total land surface area of the country,
with large populations being documented in the Maasai Mara and Tsavo complex protected areas (KWS 2008).
In addition, there are important lion populations outside protected areas in Laikipia and Maasailand. Their status
elsewhere is poorly known (KWS 2008).

This decline of lion populations during the past decades has been attributed to the loss of habitat due to human
encroachment, decline of prey populations and human-lion conflict; leading to deliberate as well as retaliatory
killing by livestock owners (Sillero-Zubiri & Laurenson 2001; Thirgood et al., 2005). Substantial human-lion
conflict cases have been shown to result from prey depletion and the fact that lion home ranges are often larger
than the surface area of national parks which often results in an overlap with human dominated landscapes
(Woodroffe 2000; Winterbach et al., 2013). Local traditions and negative attitudes towards lions have also been
noted to contribute to deliberate lion killing (Tuqa et al., 2015; Hazzah et al., 2017; Lesilau, 2019). Some studies
suggest that the main factors influencing livestock predation patterns include the number of livestock in the
village, distance to the park boundary from the village, seasonality, and the behaviour of individual lions (Van
Bommel et al., 2007; Tuqa et al., 2015). Despite the highly complex nature of human-carnivore conflicts;
perceived costs and damages may lead to lion persecution and retaliatory killing (Dickman 2010; Hazzah et al.,
2014). Lions are particularly vulnerable to retaliatory killing due to the ease of finding and approaching them
compared to other predators (Tuqa et al., 2015). Also, the prestige of killing a lion in some societies, like the
Maasai and Samburu in Kenya, and the tendency of lions to return to a kill the following night contributes to
increased mortality (Hazzah et al., 2009).

Schaller (1972) grouped lions into four age classes for ease of studying their population and social structure
which include small cubs (0-1 year), large cubs (1-2 years), sub-adults (2 – 4 years) and adults (4 years and above).
Studies submit that the age of male lions can be estimated on the basis of mane size, mane colour and nose
pigmentation, although these phenotypes have been shown to vary greatly across geographic range (West and
Packer 2002). Whitman et al. 2004 found the extent of dark pigmentation in the tip of the nose to be the most
efficient index in estimating the ages of both male and female lions in Serengeti and Ngorongoro conservation
areas. The rhinarium of the lion becomes increasingly freckled with age (Whitman et al. 2004). Lions live in
fission-fusion social units (prides) that allow pride members to form subgroups of differing sizes. These units are
useful for group foraging as well as protection of young ones and long-term territories (Schaller 1972; Packer et
al., 1990). A pride of lions consists of 2-35 individuals, with 2-18 related adult females and 1-7 adult males, either
related or unrelated, and their offspring (Rudnai 1973). There are indications that the larger prides encountered
in some areas could be an adaptation to the presence of kleptoparasites such as spotted hyaenas, which occur
in clans of large sizes (Rudnai 1973). Smaller prides take longer to consume a given prey animal and have less
defence force thereby increasing their vulnerability to molestation by spotted hyaenas. In competition for a
carcass, superiority depends on the relative number of lions to spotted hyaenas (Schaller, 1972). Spotted
hyaenas in large clans have been identified as successful in driving lions off their kill on several occasions (Rudnai
1973).

Lions spend most of their time within a defined area usually known as the lion’s 'home range'. A lion’s home
range is defined as “the area covered by an individual in its normal activities of foraging, mating and caring for
the young” (Burt, 1943). This is different from the lion’s ‘territory’, which implies an area that is kept free of all,
or a certain class of, conspecifics (Burt 1943). An animal's territory may include all of its home range, or, in most
cases, constitute only a certain, part of it that it defends. Home range sizes vary in space and time, from 20km 2
to more than 1000km2 (MCP 100%), as influenced by social interaction, seasonality, prey and resource

                                                                                                                          -9-
availability (Schaller, 1972; Whitman et al. 2004; Sogbohossou et al. 2014). Home range size is generally related
to pride size, individual age and sex; with home range size increasing relative to increase in group size (Packer et
al.2005; Loveridge et al., 2009; Tuqa et al.2014). Drought causes prey species to disperse, resulting in a
temporary increase of lion home range sizes, which reduces with increased water supply and an influx of prey
species (Bauer & de Iongh, 2005; Loveridge et al., 2009). This is usually not always the case in parks such as
Amboseli National park where there is a large permanent water body inside the park that causes wildlife to
return to the park during the dry season and disperse during the wet season (Tuqa 2015). Measuring an animal’s
home-range dynamics is important for most ecological studies, particularly those concerned with the
distribution of resources, habitat utilization by individuals and their interactions (Harris et al. 2010). Large
carnivores living in human-dominated landscapes often exist in ‘Landscapes of Fear’ whereby they are faced
with the challenge of spatio-temporally adapting their activity patterns in strategic ways that enhance their
survival, while minimising the risk of human caused mortality (Oriol-Cotterill et al., 2015; Lesilau et. al., 2018).
This has led to the ‘Landscapes of Coexistence’ concept whereby the availability of valuable resources such as
availability of pasture (which attracts prey), livestock (which is easy prey), and water resources during drought
periods in human-dominated landscapes often introduce complexities which mean that the avoidance of these
landscapes results in substantial foraging costs for large carnivores (Oriol-Cotterill et al., 2015; Lesilau et. al.,
2018).
1.0.2 Human dimensions of carnivore conservation
Due to the precarious conservation status of many felid species, there is a crucial need to develop effective
human-felid conflict management strategies that aim to address the highly complex nature of the conflicts as
well as reconcile human needs with those of felid populations (Inskip & Zimmermann, 2009; Ogada 2015). This
will require the development of tailor-made solutions such as local revenue from photographic or trophy hunting
based tourism for lions living in the periphery of protected areas (Nelson et al., 2013) to fencing in order to keep
lions inside protected areas (Packer et al. 2013; Pekor et al. 2019). Local communities living near protected areas
often bear the costs of co-existing with large carnivores, which depend highly on prey living in human dominated
landscapes (Dickman et. al.2011). Large carnivores are however valued highly by people living farther from these
local areas; both for their intrinsic and touristic value (Dickman et al. 2011). Carnivore depredations on livestock
can induce high costs to farmers as can be exemplified by data from Ruaha National Park in Tanzania (Dickman
et. al.2011). A study in this protected area showed that livestock depredation by carnivores’ costs farmers ~18%
of their total annual income (Dickman et. al.2011). Villagers normally receive little to no benefits at all for living
with carnivores to offset their losses, despite the presence of carnivores being a significant tourism revenue
generator at the national level (Inskip & Zimmermann, 2009; Lindsey et al. 2012).
Economic loss due to carnivore depredation has been cited as the most common cause of human-lion conflict
(Inskip & Zimmermann, 2009). Local communities often argue that they experience fewer personal benefits from
living near protected areas relative to the costs incurred from wildlife roaming freely into their lands (Sillero-
Zubiri and Laurenson, 2001). Antagonism towards the parks and park personnel often translates to conflict with
wildlife as the locals feel as if their needs are being neglected in contrast to outsiders’ needs (Naughton-Treves
and Treves, 2005). Deep-rooted cultural and religious beliefs can also play a big role in influencing conflict
(Hazzah, 2011; Kolipaka et al. 2018). This can be exacerbated by inter-tribal tension in areas with more than one
ethnic group living close together such as the Meru Conservation Area (MCA) (Otuoma 2004). In such areas,
depredation incidences can ignite conflicts in cases where neighbouring tribes accuse each other of using magical
powers to control predators into causing damage on the opposite tribe (West, 2001; Dickman 2010). These
- 10 -beliefs bring about a human-human dimension of carnivore conflicts where for example a witch doctor could be
targeted as a result of carnivore related conflict when an affected ethnic group believes that he/she is controlling
the predators causing the damage (Redpath et al., 2015). Emerging non-discriminatory methods of retaliatory
killings on carnivores such as poisoning through the lacing of livestock carcasses with toxic pesticides like
carbofuran have also been identified as significant factors leading to lion decline in Africa in recent times (Ogada
2014). KWS developed a wildlife poisoning incident protocol in 2018 to control poisoning incidences in the
country in response to reported cases across the country (KWS 2018). There are indications however that much
of this killing happens without government oversight (KWS 2018). Some suggestions for enhancing human-
carnivore coexistence include consolation schemes, utilisation of bottom-up approaches in working with
villagers to protect livestock from attacks, increasing positive interaction of locals with park personnel, as well
as encouraging open inter-tribal discussion on carnivores (Bauer et al. 2015; Dickman, 2015; Redpath et al.,
2015; Tuqa, 2015).
1.0.2.1 Attitudes towards carnivores
Studies suggest that significant conflicts are still experienced even after the successful control of damage that is
directly caused by wildlife (Dickman 2010; Marchini et al., 2012). This highlights the importance of addressing
underlying human–human conflicts, either between authorities and local people, or between people of different
cultural backgrounds (Treves and Karanth 2003; Dickman 2010; Kolipaka et al., 2015; Hazzah et al. 2017).
Understanding the factors that influence the level of willingness by local farmers to tolerate carnivore presence
helps to inform the development of effective human-carnivore conflict mitigation strategies (Mkonyi et al. 2017).
People’s attitudes towards wildlife are complex and often influenced by socio-economic and ecological factors
as diverse as religious or political affiliation, ethnicity and cultural beliefs, access to natural resources, amount
of livestock lost due to depredation, level of wealth/livestock owned, carnivore knowledge and education level,
as well as distance from park boundary; all of which play a significant role in shaping the intensity of the conflict
(Dickman 2010; Dickman et al. 2013; Kolipaka et al., 2017; Gebresenbet et al. 2018a). Indigenous pastoralist
groups generally adhere to many cultural norms and taboos that guide their behaviour towards the natural world
and the wildlife in these areas (Dickman 2010; Kolipaka et al., 2017). Moreover, large carnivores also trigger fear
within people in some instances which often leads people to retaliate on carnivores and promoters of carnivore
conservation programs (Chapron et al. 2014; Kolipaka et al., 2017). This could potentially lead to human-induced
mortality of large carnivores, indifference to their poaching or limited support to the efforts to conserve them
which are all factors linked to large carnivore decline at the global scale (Inskip et al. 2013). However, there is
also significant evidence showing that local people can coexist with large carnivores despite the threats posed
to human interests by the carnivores which highlights the need for conservation planners to address the
underlying factors that enable human-carnivore coexistence for more sustainable solutions (Kolipaka et al.,
2017). Developing a broader awareness of conflict drivers will improve understanding of the underlying factors
that influence this critical conservation issue (Dickman 2010).
Studies show evidence that the lack of lion-related benefits for local people amplifies the notion that lions are
conserved at the cost of the safety and economic subsistence of local communities (Bruner et al, 2001;
Gebresenbet et. al. 2018b). For example, Romañach et al, (2007) reported during a study in Central Kenya that
local people claimed they would be more tolerant of depredations if they benefited from carnivore conservation
actions, and members of the community who received an income from tourism had positive attitudes towards
predators. Hazzah et al (2014), also provided evidence that lion killing can be reduced by working within the
cultural context of the Maasai. They argued that participatory approaches which engage locals from planning to
- 11 -implementation of conservation actions, promote legitimacy of proposed solutions to human-wildlife conflicts.
However, if locals are passive participants, the participatory approach remains nominal and lacks power-sharing
and partnership (Twyman 2000). Arnstein (1969) proposes that community participation and collaboration can
become effective if guided through levels of participation ranging from a non-participatory stage (in which local
populations are only be educated on the importance of carnivores) to a citizen empowerment stage (where
individuals actively participate in the conservation process as well as hold governance and managerial positions).
My study looks at how different factors influence farmers’ attitudes towards carnivores in the MCA, and explores
possibilities of incorporating increasingly innovative and interdisciplinary mitigation approaches that
successfully facilitate the shift from conflict to coexistence in the MCA.
1.0.2.2 Livestock husbandry techniques
Livestock husbandry techniques influence the likelihood of conflict with carnivores whereby studies suggest that
seasonality in cattle herding practices influences the vulnerability of cattle to depredation (Mishra, 1997, Ogada
et al., 2003, Wang and Macdonald, 2006, Tumenta et al., 2013). Wang and Macdonald (2006) reported that
herdsmen in Bhutan, who grazed their livestock closer to villages, suffered fewer losses to predators than those
who grazed their animals in distant pastures. Other studies have also found that livestock which graze further
away from villages (Mishra, 1997) and closer to protected/forested areas (Conforti and de Azevedo, 2003,
Hemson et al., 2009) are more vulnerable to predation by large carnivores (Kolipaka et al. 2017). Livestock
depredation by lions and leopards has been reported to be higher in farmlands closer to the boundaries of their
respective PAs than farther away in the Chirisa Safari Area in Zimbabwe and Khutse Game Reserve in Botswana
(Butler, 2000, Schiess-Meier et al., 2007). Wang and Macdonald (2006) also reported that traditional enclosures
with sparse branches and the absence of enclosures in most cases increase predation prevalence in Benin’s
Pendjari National Reserve. Improved fences and walls are expensive but they are the most commonly used
method to reduce predation frequency (Ogada et al., 2003; Treves and Karanth 2003; Packer et al. 2013). Lesilau
et al (2018) observed that lions take livestock during the day time when the opportunity to get them at night
becomes difficult as a result of the installation of deterrent flashlights in bomas during a study at the Nairobi
National Park in Kenya. This confirms the opportunistic adaptation of lion behaviour. In Botswana, livestock are
frequently not herded and are often left to wander outside enclosures at night which results in increased
predation (Hemson, 2003). While people did complain that lions raided their enclosures, the majority of livestock
kills recorded were far away from the enclosures, indeed data from GPS collared cattle and interviews suggested
that between 13-20% of livestock were wandering around untended at night, making depredation almost
inevitable (Hemson, 2003).
1.0.2.3 Human-carnivore conflict intervention
Some notable initiatives that work to promote human-carnivore coexistence include the Lion Guardians model
that empowers local communities by making use of local cultural values and carnivore knowledge with the aim
of promoting human-lion coexistence and monitoring local lion populations (Hazzah et al 2014). Compensation
or consolation schemes such as the Predator Conservation Fund (PCF) have been used for the purposes of better
balancing the distribution of costs and benefits related to conserving large carnivores although their
implementation is faced with a lot of challenges in comparison to insurance schemes (Hussain 2000; Naughton-
Treves et al. 2003; Hazzah et al 2014). The PCF model involves incident verification, compensation payments,
and penalties to ensure program rules are not violated; although such privately funded compensation programs
- 12 -still face challenges regarding their long-term financial sustainability and ability to potentially induce ethical
conundrums such as reduced livestock guarding efforts or payments claimed for livestock lost through other
causes (Hazzah et al 2014). The Project Snow Leopard (PSL) based in Baltistan, Pakistan provides a good example
of the insurance scheme model. The project supports local farmers in ensuring every head of livestock owned is
covered by the insurance scheme, and any financial balances are provided for by profits from trekking
expeditions that focus on the snow leopard (Hussain 2000). The insurance scheme is jointly managed by a village
management committee and PSL staff and is structured in such a way that villagers can monitor each other
thereby creating incentives to avoid cheating the system. Insurance schemes therefore have a better potential
of reducing costs by individual livestock farmers whereby, they encourage local farmers to set aside a collective
pool of money or livestock equal to the value of the annual average depredation rate if designed appropriately
(Hussain 2000).
- 13 -1.1 RESEARCH OBJECTIVES
This master project contributes to the PhD research of Luka Narisha and Kevin Groen from the Institute of
Environmental Sciences (CML) in the University of Leiden. The main aim of this study is to analyse how different
environmental and anthropogenic factors influence lion ecology and status around the MNP in a spatio-temporal
context. My study focusses on understanding lion population size, pride structure, reproductive success,
foraging success, lion distribution in and around the MNP and factors that influence human-lion interactions in
the area. Data used has been collected from lion populations and observed prey carcasses within the MNP as
well as local farmers and other stakeholders who live around the MNP.
I hypothesise that lion distribution in the area is influenced by habitat characteristics and precipitation; as well
as the distribution of households and livestock across the different villages (sub-locations) surrounding the MCA.
I further hypothesise that variations in attitudes towards lions among the different villages (sub-locations)
surrounding the MCA are influenced by distance to park boundary, cultural background, livestock ownership, as
well as literacy and carnivore knowledge levels. Finally, I hypothesise that the amount of livestock depredated
influences a farmer’s willingness to seek compensation. The results obtained from my study may assist in
informing strategies aimed at managing lion populations as well as human-carnivore interactions in the area in
the future.
The research questions for the study include:
1. Lion population size, pride structure, reproductive success, foraging success and distribution:
1.1. What is the current lion population size and density in the MNP?
1.2. What is the male: female ratio?
1.3. What is the adult: juvenile ratio?
1.4. What is the influence of reproductive success on pride structure in the MNP?
1.5. What is the frequency and location of feeding events by lions in the MNP based on observed carcasses?
1.6. How does reproductive success and foraging success influence lion pride structure in the MNP?
1.7. What is the potential distribution of lions in and around Meru National Park?
1.8. Which environmental and anthropogenic factors influence lion distribution in and around MNP?
2. Carnivore knowledge and attitudes towards lions by different local stakeholders:
2.1. What is the general knowledge on different carnivore species and their tracks by the different
stakeholders?
2.2. What is the general attitude towards lions and other carnivores in the area?
2.3. What are the main factors influencing respondents’ attitudes towards lions and other carnivores in the
area?
3. Factors influencing livestock depredation patterns by lions in the area:
3.1. What is the intensity of depredation incidences relative to livestock type and carnivore type?
3.2. Where do majority of livestock depredation incidences occur?
3.3. What is the frequency of carnivore attacks on humans in the area?
3.4. What is the influence of different livestock husbandry practices on livestock survival rate in the area?
3.5. What is the influence of livestock depredation on willingness by farmers to seek compensation?
- 14 -CHAPTER TWO
2.0 METHODOLOGY
2.0.1 Study area
The Meru Conservation Area (MCA) is situated in the Somali-Maasai regional centre of endemism. It is the
second largest conservation area in Kenya and is one of the remaining true wilderness areas in Kenya. It was
made a UNESCO World Heritage Site in 2010 and hosts the lion (Panthera leo), leopard (Panthera pardus),
cheetah (Acinonyx jubatus), spotted hyaena (Crocouta crocuta), and herbivores like Grevy’s Zebra (Equus
Grevyi), Black Rhinoceros (Diceros Biconis), and introduced southern White Rhinoceros (Ceratotherium simum).
The MCA covers an area of ~4,000km2 which includes (Figure 1):
I. Meru National Park (MNP) – Located in Meru North District, covering an area of 884km2. Gazetted
in 1967 and is one of the oldest parks in Kenya.
II. Kora National Park (KNP) – Covers an area of 1,787 km2 making it the largest protected area in the
MCA. Gazetted as a natural reserve in 1973, and as a park in 1990.
III. Bisanadi National Reserve (BNR) – Located North East of MNP, covering an area of 606km2. It is an
important dispersal area for many wildlife
IV. North Kitui/Mwingi National Reserve (MNR) – Located south of MNP and covers an area of 745km2.
V. North Rahole Reserve (NRR) – Located north of KNP and covers an area of 1231km2.
The four PAs have a high degree of ecological interdependence, especially with regards to large mammal
movements. There are also significant synergistic benefits to be achieved by managing the area holistically, in
particular regarding the promotion of human-carnivore conflict mitigation and security operations, and in the
promotion and development of the MCA as a single visitor destination. For these reasons, the MCA has in recent
years been managed by KWS as a single management unit, with a Headquarters at Murera in the north-west
corner of Meru National Park. The MNP, established under legal notice 4756 of18/12/66, boundary plan number
204/37, covers an area of approximately 884 km2 (Sitienei et al., 2014). The MNP was established as a game
reserve in 1957 by Meru County Council and gazetted as a National Park in 1967 (Narisha 2018). It is located in
the Eastern Province, 0°20′∼0°10′S, 38°0′∼38°25′E (Fig. 1). It is situated between 300 m above sea level at the
Tana River southern boundary and 1000 m above sea level at the base of the Nyambene Hills in the north
(Sitienei, et.al, 2014). The MNP has been the main focus of tourism and management in the MCA, contains the
highest concentrations of wildlife in the MCA, and currently contains the majority of the Protected Area (PA)
infrastructure in the MCA such as roads and airstrips (Lala 2011). 70km of the protected area is fenced on the
western boundary of MNP to reduce Human Wildlife Conflict (HWC), and it is the only PA in the MCA that is not
seriously impacted by livestock incursions during the dry season (KWS 2006).
The rainfall regime in MNP is characterized by two rainy seasons. The long rains are experienced during the
months of March–May and the short rains starting in October–December annually. However, the park
experiences differential precipitation with strips around the north-western boundary receiving most
precipitation which correlates with the area’s elevation (Lala 2011). It is for this reason that the strips remain
green throughout with the lowlands receiving low rainfall as they are on the leeward side. The southern half of
the park, which lies on the equator, is dry. The annual rainfall can fluctuate considerably with wet years having
more than double the mean annual rainfall and dry years less than half or quarter of the mean annual rainfall.
Drought period in the park can last between 4 to 8 months (Meru National Park Annual Report, 2003–2004). The
geology of MNP is divided into the northern and southern sections. The northern part is formed of Pleistocene
lava flows from the Nyambene ridges and the Mount Kenya volcanic complex, while the southern part comprises
- 15 -of exposed pre-Cambrian rock basement (Lala 2011). The lava that flowed along pre-existing river valleys as a
result of Nyambene hills’ eruption diverted the watercourses thereby causing rivers that flowed along the edge
of tongue-shaped lava flows, with their confluence uniting at tongue points as can be seen at the Kindani-
Rojewero River confluence (Lala 2011). The olivine-basalt lava flows produce greyish brown soils on gentle slopes
toward the Nyambene Ridges and greyish-black soils in swampy and river valleys (Lala 2011). Other areas in MNP
have grey volcanic alluvial soils formed in pre-existing lakebeds from the Pleistocene Epoch. Fossiliferous
Limestone, formed as a result of river damming by the lava flows, occurs on the banks of Rojewero River towards
its confluence with the Murera River. Red sandy soil covers the basement rocks on the eastern park boundary
as well as the north eastern side of the Murera river and its northern confluence with Rojewero river (Lala 2011).
Metamorphic rocks occur in the south of Rojewero and Kiolu rivers while Pleistocene lava flows form ranges
between the rivers and cover biotite gneiss of the basement systems. There are volcanic alluvial soils and
exposed biotite gneiss covered by red soils on the Ura river at Ntoe Ndogo near the Ura gate (Lala 2011). The
highest hill in the park is called Mugwongo (also known as the Elsa’s Kopje) with a height of 660 feet, which is
used by visitors as a viewpoint. Other hills include Ntoe Kubwa, Ntoe Ndogo and Leopard Rock that are
composed of Precambrian rocks.
The Tana River, which marks the southern limit of the geomorphic area, is the largest river in Kenya and starts
north of Nairobi, 250 km from the park. Fourteen rivers cross MNP including the Tana, Rojewero, Kiolu, Ura,
Murera, Bisanadi, Bwatherongi, Mutundu, Makutano, Mulika, Njoru ya Kina, Kindani, Utambachago and
Kachoradu (Fig. 1). The swamps include Mulika, Bwatherongi, Leopard, Mururi and Mungwongo (Fig. 3). The
distribution of water resources is critical to understanding the MCA’s ecosystems as it is the key to the natural
plant life distribution and important to the habitats that attract the wild fauna in the area (Lala 2011). The
vegetation in the park exists in three broad types of Acacia species, which occupy much of the park from the
northern parts extending well past the central area. Combretum and Terminalia woodland dominate the western
region, whereas the southern is densely occupied by the Commiphora species. Common fauna includes African
elephants (Loxodonta africana africana) (Meru National Park Annual Report, 2003–2004).
The main ethnic communities inhabiting the areas around the MCA include Maasai, Borana, Somali, Meru,
Kikuyu and Turkana (Otuoma 2004; Affognon et al. 2017). The Maasai, Borana and Somali are mainly
transhumant pastoralists while the Turkana mainly practise nomadic pastoralism (Affognon et al. 2017). The
Meru and Kikuyu ethnic groups mainly practise agro-pastoralism (Otuoma 2004). A survey done by the Kenya
Central Bureau of Statistics in the six districts bordering the MCA demonstrated that ~70% of the households
occupying the buffer zones that surround the MCA belong to migrant communities who moved to the area
between 1980 and 2000 (Otuoma 2004). This led to an increase in human population density in the area from
50 people/km2 to 125 people/km2 in the southern Tharaka zone, and 126 people/km2 to >500 people/km2 in the
western buffer zones bordering Nyambene Ranges. Pure pastoralists that settled in the MCA between 1980 and
2000, who constitute 12.5% of the total households, were found to have migrated from Isiolo, Garrisa, Marsabit
and Mandera in northern Kenya (Otuoma 2004). 45% of the households in the area practise agro-pastoralism
which is the main land use in the area (Otuoma 2004). The pastoralist communities mainly occupy the northern
pastoral lands, although sometimes they are also spotted in the communal grazing lands and wildlife dispersal
areas of the western Meru National Park boundary as well as towards the southern Tharaka areas, particularly
in the dry season due to lack of formal boundaries in their grazing patterns (Otuoma 2004).
- 16 -The MCA was gazetted as a protected area mainly for the purpose of wildlife management (KWS 2006). Main
livestock species found in the area include cattle in the western boundary of the Meru National Park (MNP); and
cattle, goats and donkeys in the southern Tharaka area; as well as cattle, goats, sheep and camel in the northern
pastoral areas (KWS 1998; Otuoma 2004). Carnivore attacks on livestock have mostly been reported in the
northern buffer zones that are generally occupied by pastoralists, with cattle being the most affected livestock
species as well as occasional attacks on sheep and goats (Otuoma 2004). Human attacks by carnivores have also
been reported in the area; particularly in Murera and Kindani in the West and Kinna and Rapsu in the North
(Otuoma 2004). Reports indicate that attacks on humans and livestock have mainly been caused by lions and to
a lesser extent by leopards (KWS 1998; Otuoma 2004). Meru NP has received a large number of translocated
problem lions from other national parks over the past decades (Narisha 2018). To date, the fate of these
translocated problem lions is not known, and there are indications that these lions are pushed out of Meru NP
by resident lion populations in the area. This may lead to increased levels of conflict in the surrounding areas.
- 17 -You can also read