Economic costs of biological invasions in the United Kingdom - NeoBiota
←
→
Page content transcription
If your browser does not render page correctly, please read the page content below
A peer-reviewed open-access journal
NeoBiota 67: 299–328 (2021)
doi: 10.3897/neobiota.67.59743                           RESEARCH ARTICLE
                                                                                                                            NeoBiota
https://neobiota.pensoft.net                                                                         Advancing research on alien species and biological invasions

                      Economic costs of biological invasions
                            in the United Kingdom

 Ross N. Cuthbert1,2, Angela C. Bartlett3, Anna J. Turbelin4, Phillip J. Haubrock5,6,
   Christophe Diagne4, Zarah Pattison7, Franck Courchamp4, Jane A. Catford3,8

1 GEOMAR Helmholtz-Zentrum für Ozeanforschung Kiel, Kiel, Germany 2 School of Biological Sciences,
Queen’s University Belfast, Belfast, UK 3 Department of Geography, King’s College London, London, UK
4 Université Paris-Saclay, CNRS, AgroParisTech, Ecologie Systématique Evolution, Orsay, France 5 Sencken-
berg Research Institute and Natural History Museum Frankfurt, Department of River Ecology and Conserva-
tion, Gelnhausen, Germany 6 Faculty of Fisheries and Protection of Waters, South Bohemian Research Centre of
Aquaculture and Biodiversity of Hydrocenoses, University of South Bohemia, Vodňany, Czech Republic 7 School
of Natural and Environmental Sciences; Modelling, Evidence and Policy Group, Newcastle University, Newcas-
tle Upon Tyne, UK 8 School of BioSciences, University of Melbourne, Melbourne, Australia

Corresponding author: Ross N. Cuthbert (rossnoelcuthbert@gmail.com)

Academic editor: Sh. McDermott | Received 16 October 2020 | Accepted 15 December 2020 | Published 29 July 2021

Citation: Cuthbert RN, Bartlett AC, Turbelin AJ, Haubrock PJ, Diagne C, Pattison Z, Courchamp F, Catford JA
(2021) Economic costs of biological invasions in the United Kingdom. In: Zenni RD, McDermott S, García-Berthou
E, Essl F (Eds) The economic costs of biological invasions around the world. NeoBiota 67: 299–328. https://doi.
org/10.3897/neobiota.67.59743

Abstract
Although the high costs of invasion are frequently cited and are a key motivation for environmental
management and policy, synthesised data on invasion costs are scarce. Here, we quantify and examine the
monetary costs of biological invasions in the United Kingdom (UK) using a global synthesis of reported
invasion costs. Invasive alien species have cost the UK economy between US$6.9 billion and $17.6 bil-
lion (£5.4 – £13.7 billion) in reported losses and expenses since 1976. Most costs were reported for the
entire UK or Great Britain (97%); country-scale cost reporting for the UK's four constituent countries
was scarce. Reports of animal invasions were the costliest ($4.7 billion), then plant ($1.3 billion) and
fungal ($206.7 million) invasions. Reported damage costs (i.e. excluding management costs) were higher
in terrestrial ($4.8 billion) than aquatic or semi-aquatic environments ($29.8 million), and primarily im-
pacted agriculture ($4.2 billion). Invaders with earlier introduction years accrued significantly higher total
invasion costs. Invasion costs have been increasing rapidly since 1976, and have cost the UK economy
$157.1 million (£122.1 million) per annum, on average. Published information on specific economic
costs included only 42 of 520 invaders reported in the UK and was generally available only for the most

Copyright Ross N. Cuthbert et al. This is an open access article distributed under the terms of the Creative Commons Attribution License (CC
BY 4.0), which permits unrestricted use, distribution, and reproduction in any medium, provided the original author and source are credited.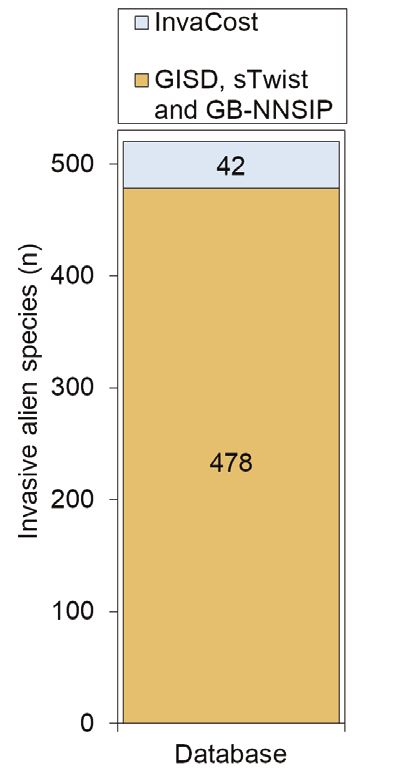
300                     Ross N. Cuthbert et al. / NeoBiota 67: 299–328 (2021)

intensively studied taxa, with just four species contributing 90% of species-specific costs. Given that many
of the invasive species lacking cost data are actively managed and have well-recognised impacts, this sug-
gests that cost information is incomplete and that totals presented here are vast underestimates owing to
knowledge gaps. Financial expenditure on managing invasions is a fraction (37%) of the costs incurred
through damage from invaders; greater investments in UK invasive species research and management are,
therefore, urgently required.

Abstract in Welsh
Er bod costau uchel rhywogaethau ymledol yn cael eu nodi’n aml fel rhesymeg allweddol ar gyfer gweithredu
polisïau a rheolaeth amgylcheddol, mae data syntheseiddiedig ar gostau ymlediad yn brin. Yma, rydym yn
meintioli ac yn archwilio costau ariannol ymlediadau biolegol yn y Deyrnas Unedig (DU) gan ddefnyddio
synthesis byd-eang o gostau ymlediadau cyhoeddedig. Mae rhywogaethau ymledol estron wedi costio rh-
wng UD$ 6.9 biliwn a $17.6 biliwn (£5.4 – £13.7 biliwn) i economi’r DU mewn colledion a threuliau ag
adroddwyd ers 1976. Adroddwyd y mwyafrif o gostau ar gyfer y DU neu Brydain Fawr yn ei chyfanrwydd
(97%) ac felly roedd adroddiadau costau i’r gwledydd unigol yn brin. Adroddiadau ar ymlediad anifeiliaid
oedd yr ymlediadau mwyaf costus ($4.7 biliwn), yna planhigion ($1.3 biliwn), yna ffwng ($206.7 miliwn).
Roedd costau difrod yr adroddwyd arnynt (h.y. heb gynnwys costau rheoli) yn uwch mewn amgylcheddau
daearol ($4.8 biliwn) nag amgylcheddau dyfrol neu led-ddyfrol ($29.8 miliwn), gan effeithio’n bennaf ar
amaethyddiaeth ($4.2 biliwn). Roedd ymledwyr â gyflwynwyd yn gynharach wedi cronni cyfanswm costau
ymlediadau roedd yn uwch o lawer ‘na rhai a gyflwynwyd yn fwy diweddar. Mae costau ymlediadau wedi
bod yn cynyddu’n gyflym ers 1976, gan gostio ar gyfartaledd $157.1 miliwn (£122.1 miliwn) y flwyddyn
i economi’r DU. Dim ond ar gyfer 42 o’r 520 o rywogaethau ymledol a gyhoeddwyd costau economaidd
penodol yn y DU, a hynny gan amlaf ar gyfer y tacsa a astudiwyd yn fwyaf dwys yn unig, gyda pedair
rhywogaeth yn gyfrifol am 90% o’r costau penodol. O ystyried bod llawer o rywogaethau ymledol sydd heb
ddata costau yn cael eu rheoli’n weithredol, awgrymir fod gwybodaeth am gostau yn anghyflawn a bod y
cyfansymiau a gyflwynir yma ond yn amcangyfrif isel oblegid diffyg gwybodaeth. Mae gwariant ariannol ar
reoli ymlediadau yn cynrychioli ffracsiwn (37%) o’r costau a achosir trwy ddifrod gan ymledwyr; felly mae
angen buddsoddiadau ychwanegol ar reoli rhywogaethau ymledol y DU ar frys.

Abstract in Irish
D’ainneoin gur minic a luaitear na costais arda a bhaineann le hionradh agus gur cúis an-tábhachtach
iad le bainistiú agus polasaí comhshaoil, is annamh a fhaightear sonraí sintéisithe faoi chostais ionraidh.
Sa pháipéar seo, measaimid ar bhonn cainníochtúil agus scrúdaímid costais airgeadaíochta ionraí bitheo-
laíochta sa Ríocht Aontaithe (RA) agus leas á bhaint againn as sintéis dhomhanda ar chostais ionraidh
a thuairiscítear. Tá geilleagar na RA thíos idir SA$6.9 billiún agus $17.6 billiún (£5.4 – £13.7 billiún)
le speicis choimhthíocha ionracha ó bhí 1976 ann maidir le caillteanais agus costais a tuairiscíodh. Is i
gcás na RA nó i gcás na Breataine Móire a tuairiscíodh formhór na gcostas agus, mar sin de, is annamh
a tuairiscíodh costais ar scála tíre. Ba iad tuairiscí ar ionraí ainmhithe ba mhó a raibh costais ag baint leo
($4.7 billiún), ansin ionraí plandaí ($1.3 billiún) agus ionraí fungasacha ($206.7 milliún). B’airde na
costais damáiste a tuairiscíodh (.i. gan costais bhainistithe san áireamh) i dtimpeallachtaí talún ($4.8 bil-
liún), agus tionchar acu seo, go príomha, ar an talmhaíocht ($4.2 billiún), ná i dtimpeallachtaí uisceacha
nó leathuisceacha ($29.8 milliún). B’airde i bhfad na costais ionraidh a d’fhabhraigh ionróirí a tugadh
isteach ar bhonn níos óige. Tá méadú tapa ag teacht ar chostais ionraidh ó bhí 1976 ann, agus $157.1
milliún (£122.1 milliún) de chostas ar gheilleagar na RA in aghaidh na bliana, ar an mheán mar gheall
orthu. Níor chuimsigh eolas a foilsíodh faoi chostais gheilleagracha shonracha ach 42 de chuid na 520
ionróir a tuairiscíodh sa RA agus ní raibh sé ar fáil, go ginearálta, ach i gcás na dtacsón is mó a ndearnadh
mionstaidéar orthu, agus gan ach ceithre speiceas bainteach le 90% de na costais sainspeicis. Nuair a
United Kingdom invasion costs                                         301

chuirtear san áireamh go mbainistítear go gníomhach mórán de na speicis ionracha a bhfuil sonraí costas
ina leith ar iarraidh agus go bhfuil tionchair an-aitheanta ag baint leo, tugann sé seo le fios go bhfuil an
t-eolas a bhaineann le costais neamhiomlán agus gur meastacháin faoina luach ollmhóra iad, de bharr
bearnaí eolais, na hiomláin a chuirtear i láthair anseo. Is cuid bheag (37%) de na costais a thabhaítear de
bharr damáiste a dhéanann ionróirí is ea caiteachas airgeadais ar bhainistiú ionraí; tá géarghá, dá réir sin,
le hinfheistíochtaí níos mó i mbainistiú speicis ionracha na RA.

Abstract in French
Bien que les coûts élevés des invasions biologiques soient fréquemment évoqués et qu’ils constituent une
motivation clé pour les politiques et la gestion environnementale, les données synthétiques sur ces coûts
sont rares. Dans cette étude, nous quantifions et examinons le coût monétaire des invasions biologiques
au Royaume-Uni (UK) à l’aide d’une synthèse globale des coûts effectivement reportés. Selon les informa-
tions disponibles sur les pertes et les dépenses depuis 1976, les espèces exotiques envahissantes ont coûté
à l’économie de l’UK entre 6,9 et 17,6 milliards USD (entre 5,4 et 13,7 milliards £). La plupart des coûts
proviennent de l’ensemble de la Grande Bretagne (97%) et, ainsi, les données à l’échelle de chaque pays
sont rares. Les invasions animales sont les plus coûteuses (4,7 milliards USD), puis viennent les invasions
végétales (1,3 milliard USD) et fongiques (206,7 millions USD). Les coûts des dégâts (i.e. en excluant les
coûts de gestion) sont plus élevés dans les environnements terrestres (4,8 milliards USD) que dans les mi-
lieux aquatiques ou semi-aquatiques (29,8 millions USD), et concernent majoritairement l’agriculture (4,2
milliards USD). Les organismes envahissants avec des années d’introduction plus précoces sont ceux qui
sont associés aux coûts les plus élevés. Le coût des invasions ont augmenté rapidement depuis 1976, avec
un coût annuel moyen à l’économie anglaise de 157,1 millions USD (122,1 millions £). Les informations
publiées sur des coûts espèce-spécifiques concernent seulement 42 des 520 organismes envahissants connus
au Royaume-Uni, et sont généralement disponibles seulement pour les taxons les plus étudiés, avec seule-
ment quatre espèces qui contribuent pour 90% des coûts espèces-spécifiques documentés. Compte tenu
du nombre important d’espèces exotiques pour lesquelles il n’existe aucune donnée mais qui sont pourtant
activement gérées pour leurs impacts parfaitement reconnus, cela suggère que les informations sur le coût
des invasions biologiques sont incomplètes et que les totaux présentés ici sont largement sous-estimés à
cause des lacunes de connaissance. Les dépenses liées à la gestion des invasions ne représentent qu’une frac-
tion (37%) des coûts provoqués par les dégâts des espèces exotiques envahissantes. Des investissements plus
importants en matière de gestion des espèces envahissantes en UK sont donc nécessaires et urgents pour
limiter au maximum les impacts de ces invasions biologiques.

Abstract in Spanish
Aunque los altos costos de las invasiones se mencionan con frecuencia y son una motivación clave para la
gestión y las políticas ambientales, aún las síntesis de datos de los costos de las invasiones son escasas. Aquí,
cuantificamos y examinamos los costos monetarios de las invasiones biológicas en el Reino Unido (UK)
utilizando una síntesis global de los costos reportados sobre invasiones biológicas. Las especies exóticas
invasoras le han costado a la economía del Reino Unido entre US$6,9 mil millones y US$17,6 mil mil-
lones (£ 5.4 – £ 13.7 mil millones) en pérdidas y gastos reportados desde 1976. La mayoría de los costos se
reportaron a la escala del Reino Unido o Gran Bretaña (97%) y, por lo tanto, la representación de informes
de costos a escala individual de cada país dentro del Reino Unido fue escasa. Los informes de invasiones
de animales fueron los más costosos ($4,7 mil millones), seguidos por las invasiones de plantas ($1,3 mil
millones) y de hongos ($206,7 millones). Los costos de daños reportados (es decir, excluyendo los costos
de gestión) fueron más altos en ambientes terrestres ($4.8 mil millones) que en ambientes acuáticos o
semiacuáticos ($29.8 millones), afectando principalmente a la agricultura ($4.2 mil millones). Los invas-
ores con introducciones más antiguas acumularon costos totales de invasión significativamente más altos.
302                    Ross N. Cuthbert et al. / NeoBiota 67: 299–328 (2021)

Los costos de invasión han aumentado rápidamente desde 1976, lo que le ha costado a la economía del
Reino Unido unos $157,1 millones (£122,1 millones) por año, en promedio. La información publicada
sobre costos económicos específicos incluyó sólo 42 de las 520 invasores reportados en el Reino Unido y
generalmente estaba disponible solo para los taxones más estudiados, con solo cuatro especies contribuy-
endo con el 90% de los costos específicos de cada especie. Dado que muchas de las especies invasoras que
carecen de datos de costos se gestionan activamente y tienen impactos bien conocidos, esto sugiere que
la información de costos es incompleta y que los totales presentados aquí son subestimaciones enormes
debido a lagunas de conocimiento. El gasto financiero en el manejo de invasiones es una fracción (37%)
de los costos incurridos por los daños causados por los invasores; por lo tanto, se requieren con urgencia
mayores inversiones en la gestión de especies invasoras del Reino Unido.

Abstract in German
Obwohl die hohen Kosten biologischer Invasionen häufig aufgezeigt werden und eine wichtige Motiva-
tion für das Umweltmanagement und die Umweltpolitik darstellen, sind synthetisierte Daten rar. Hier
quantifizieren und untersuchen wir die monetären Kosten biologischer Invasionen im Vereinigten Köni-
greich anhand einer globalen Synthese der gemeldeten Invasionskosten. Invasive gebietsfremde Arten
haben die britische Wirtschaft seit 1976 zwischen 6,9 und 17,6 Milliarden US-Dollar (5,4 bis 13,7 Mil-
liarden Pfund) an gemeldeten Verlusten und Ausgaben gekostet. Die meisten Kosten wurden für das
Vereinigte Königreich oder Großbritannien (97%) und damit für das gesamte Land gemeldet. Berichte
über invasive Tiere waren die teuersten (4,7 Mrd. USD), gefolgt von Pflanzen (1,3 Mrd. USD) und Pilzen
(206,7 Mio. USD). Die gemeldeten Schäden (d.h. ohne Verwaltungskosten) waren in terrestrischen Hab-
itaten (4,8 Mrd. USD) höher als in aquatischen oder semi-aquatischen (29,8 Mio. USD) und wirkten
sich hauptsächlich auf die Landwirtschaft aus (4,2 Mrd. USD). Invasoren mit früheren Einführungsjah-
ren verursachten signifikant höhere Gesamtinvasionskosten. Die Invasionskosten sind seit 1976 rapide
gestiegen und kosten die britische Wirtschaft durchschnittlich 157,1 Mio. USD (122,1 Mio. GBP) pro
Jahr. Zu den veröffentlichten Informationen zu spezifischen wirtschaftlichen Kosten gehörten nur 42 von
520 im Vereinigten Königreich gemeldeten Invasoren, die im Allgemeinen nur für die am intensivsten
untersuchten Taxa verfügbar waren, wobei nur vier Arten 90% der art-spezifischen Kosten beisteuern.
Angesichts der Tatsache, dass viele der invasiven Arten, denen Kostendaten fehlen, aktiv verwaltet werden
und allgemein anerkannte Auswirkungen haben, deutet dies darauf hin, dass die Kosteninformationen
unvollständig sind und dass die hier dargestellten Summen aufgrund von Wissenslücken stark unter-
schätzt werden. Die finanziellen Ausgaben für das Management von Invasionen machen einen Bruchteil
(37%) der Kosten aus, die durch Schäden durch Eindringlinge entstehen. Daher sind dringend größere
Investitionen in das Management invasiver Arten im Vereinigten Königreich erforderlich.

Keywords
England, InvaCost, invasive alien species, non-native species, Northern Ireland, published monetary im-
pacts, Scotland, socioeconomic sector, Wales

Introduction

Biological invasions can cause far-reaching ecological, environmental, social and eco-
nomic impacts in invaded ranges (Simberloff et al. 2013; Linders et al. 2019; Pyšek
et al. 2020; Diagne et al. 2021). In the last two decades, there has been an increasing
number of studies examining the ecological impacts of invasive alien species (hereon,
United Kingdom invasion costs                             303

invasive species) (Crystal-Ornelas and Lockwood 2020). However, notwithstanding a
few national-scale studies (e.g. Pimentel et al. 2000, 2005; Williams et al. 2010; Hoff-
man and Broadhurst 2016), the socioeconomic implications have generally lacked syn-
thesis until recently (Bacher et al. 2018; Shackelton et al. 2019; Diagne et al. 2020a;
Cuthbert et al. 2021a; Diagne et al. 2021). A lack of cost-reporting reduces monetary
incentives for policy-makers to implement management measures aimed at preventing
the introduction, spread and impacts of invasions (Diagne et al. 2020b). That is despite
management, especially when applied at an early invasion stage (Leung et al. 2002;
Ahmed et al. 2021), being highly cost-effective in reducing longer-term management
expenditure or damage to resources (Aukema et al. 2011; Paini et al. 2016).
     Until recently, large-scale studies into the economic costs of invasive species have been
limited to major geographic entities, such as the United States (Pimentel et al. 2000, 2005),
Europe (Kettunen et al. 2009) and Australia (Hoffman and Broadhurst 2016). Important-
ly, these studies have raised societal and policy-maker awareness of the massive economic
costs of biological invasions, yet many nations lack assessment. In 2020, the United King-
dom (UK) was the 5th largest economy in the world (World Economic Outlook Database
2020) and has experienced high levels of invasion success (Roy et al. 2014a; van Kleunen
et al. 2015), with economic factors, such as GDP, known to influence invasion rates (Lin
et al. 2011) and invader economic costs (Haubrock et al. 2021a; Kourantidou et al. 2021).
     Despite invasive species being increasingly recognised as a concern for the UK gov-
ernment (EAC 2019), in-depth and up-to-date cost reporting of invasions to the UK
economy is lacking. Early estimates of the total cost of invasive species to the UK econ-
omy have, however, been made (e.g. White and Harris 2002; Williamson 2002), albeit
with a focus on relatively few, well-known taxa. In 2010, invasion costs were estimated
at around £1.7 billion per year in England, Scotland and Wales (Williams et al. 2010).
In Northern Ireland, invasion costs have been estimated at £46.5 million per year (Kelly
et al. 2013). Williams et al. (2010) found that rabbits, Japanese knotweed and wild oats
were the costliest invasive species in the UK and agriculture was the most impacted
sector, especially in England. Other UK studies have focused on specific environments
and cost types. For freshwater invasions in Great Britain, costs of controlling invasive
species have been projected at £43.5 million per year in the case of management being
undertaken at all invaded locations (Oreska and Aldridge 2011). That pioneering study
also highlighted aquatic macrophytes and zebra mussels as two particularly expensive
species for management. These same species groups have since been targeted in biosecu-
rity campaigns such as Check, Clean, Dry in the UK (Anderson et al. 2015). However,
whilst having raised important awareness, often such studies are outdated, based on ex-
trapolations and have a limited focus on one specific cost type and there thus remains a
lack of wide-scale cost estimation for impacts that are empirically observed. There is also
no basis to test the notion that observed management investments are less costly than
resource damages and losses from invasions in a standardised way, despite Williams et
al. (2010) identifying that prevention is cheaper than longer term control in the UK.
     Overall, the economic costs of invasions for the UK lack a finer-scale, up-to-date
synthesis across multiple environmental, social and temporal contexts, with different
304 Ross N. Cuthbert et al. / NeoBiota 67: 299–328 (2021)
types of costs compiled in a comparable way. There have been few appraisals of the
biases and knowledge gaps in cost reporting amongst invasive species, despite the pres-
ence of ‘flagship’ invaders in the UK that receive high attention from scientists and
media outlets (Roy et al. 2014b). As such, whether costs correlate with the degree of
scientific interest towards a given taxon lacks examination. More broadly, invasion sci-
ence has been shown to be taxonomically biased and only a minority of invasive species
are studied in detail (Jarić et al. 2020). This unevenness leads to knowledge gaps in
the costs of invasions, which can make management, prioritisation and policy creation
difficult. Robust analyses of economic costs are urgently required to enable cost-benefit
analyses and efficient allocations of limited economic resources.
The need to comprehensively understand costs of invasive species on the UK econ-
omy is particularly crucial given their escalating numbers (Manchester and Bullock
2000; Roy et al. 2014b; Seebens et al. 2017, 2021). The Great Britain Non-Native
Species Secretariat estimates that approximately ten new alien species have become
established in the UK each year since 1950 and, on average, two of these have become
invasive since 2000 (EAC 2019). As the rate of invasion across the UK increases over
time, so too are the expected costs associated with these invasions (Diagne et al. 2020a).
However, how economic costs relate to the length of time an alien species has been
established remains unclear; species that invaded earlier might accrue greater costs or,
on the contrary, these costs might diminish as species become naturalised. This needs
to be assessed and temporal dynamics in total costs need to be characterised. Likewise,
whether certain pathways of introduction are associated with higher costs than others
at different times require consideration.
To address these knowledge gaps, we use UK-specific data from 1976 to 2020 in
the InvaCost database (Diagne et al. 2020a), a global compilation of the available lit-
erature on the economic costs of invasive species. This database compiles detailed cost
information suitable for large-scale syntheses of costs associated with invasive species at
different spatial, taxonomic and temporal scales. Specifically, we ask:
Question 1: What is the reported economic cost of invasive species in the UK
and how is it distributed amongst taxonomic groups, habitat types and socioeconomic
sectors? Given its economic importance, we expect costs to be higher from species
impacting agriculturally-intensive terrestrial environments.
Question 2: Are studies and recorded costs shared equally amongst all invasive
species? We expect that most costs are caused by relatively few species and that these
species are particularly well-known and studied, reflecting a positive feedback between
documented costs and study effort.
Question 3: How do costs of invasions vary over time and are species with early
introductions costlier than more recent invaders considering their introduction path-
ways? We expect that costs per species will increase with residence time, given a longer
time period over which to accrue costs and that common introduction pathways will
be dominant (e.g. ornamental; van Kleunen et al. 2020).
Overall, answering these questions allows us to synthesise cost information across
numerous ecological and socioeconomic contexts in the UK, helping to make informedUnited Kingdom invasion costs 305 current and future management strategies. Further, they will help in pointing out po- tential biases in available invasion-related cost data and guide further research avenues in this topic. Methods Data collection and filtering To estimate the cost of invasive species on the UK economy, we used UK-relevant cost data from the latest available version of the InvaCost database (version 3.0; Diagne et al. 2020a; https://doi.org/10.6084/m9.figshare.12668570) up to the year 2020. We note that InvaCost is a ‘living’ database that is subject to further additions and im- provements. Following the InvaCost protocol (Diagne et al 2020a), all references were retrieved using standardised searches within selected repositories [Web of Science (htt- ps://webofknowledge.com/); Google Scholar (https://scholar.google.com/); Google search engine, (https://www.google.com/)] and targeted collection through gathering opportunistic literature and contacting experts and stakeholders. Collected materials were thoroughly assessed to identify relevance and extract cost information. Specifi- cally, titles, keywords, abstracts and full texts were checked hierarchically to ensure that (1) they were in English, as per the language competencies of the review team, (2) they contained at least one cost estimate and (3) each cost estimate was attributed ex- clusively to invasive species (see Diagne et al. 2020a for full details). InvaCost only in- cludes invasive species for which there are documented economic impacts and our cost analysis reflects that scope. The database effectively defines invasive species as human- introduced alien species that cause some economic cost. Duplicates that reported the same or overlapping costs were also removed from the data. We note that, for the most part, InvaCost includes species that are currently invasive in the UK. However, in some cases, costs pertaining to past successful eradications are included, such as for coypu Myocastor coypus. Costs from the Channel Islands, British Overseas Territories and the Isle of Man were excluded to tighten the biogeographical focus. All costs were con- verted to a common, up-to-date currency (2017 US$); we also provided certain cost estimates in 2017 GBP [1 USD = 0.777 GBP (World Bank 2017 exchange range)]. Data processing The period of estimation across reported costs varied considerably, spanning periods of several months to several years. In order to obtain comparable costs, we considered all costs for a period of less than a year as annual costs and re-calculated costs covering several years on an annual basis (i.e. costs accumulated over multiple years were divided amongst those years, giving annual cost estimates). Therefore, costs that spanned mul- tiple years were divided equally amongst those years (e.g. a cost totalling $10,000 over ten years would equal $1,000 per year). If there was no evidence for a cost occurring in more than one year (i.e. One-time cost), we conservatively counted it for one year only
306                  Ross N. Cuthbert et al. / NeoBiota 67: 299–328 (2021)

and likewise for costs that were Potentially-ongoing (Occurrence column in InvaCost).
In cases where the timespan for the costs was not described in the data publication, we
used publication year as a surrogate for starting year and – if the cost was Potentially-
ongoing – publication year as a surrogate for ending year.
     The conversion of all costs into an annual basis resulted in a total of 709 expanded
entries (Suppl. material 1; 353 initial entries). This was accomplished using the expand-
YearlyCosts function of the ‘invacost’ package version 0.3–4 (Leroy et al. 2020) in R
version 4.0.2 (R Core Team 2020); this function considers both the probable starting
and ending years of each cost entry in the InvaCost database to annualise costs (see
Suppl. material 2; https://doi.org/10.6084/m9.figshare.12668570). The first cost en-
try in our dataset was recorded in 1976, so all analyses were performed for the period
1976 to 2019, because that was the last year with robust reported costs. Costs in Inva-
Cost are reported at different spatial scales (Spatial scale column), from site-specific to
regional and national estimates. We carefully considered this information and checked
for potential duplications in costs within or amongst scales, with costs estimated at all
spatial scales (i.e. unit, site or country) included in the analyses.

Question 1: Invasion costs distributions through space and sectors
We categorised the invasion costs using seven criteria. The first two criteria were used
to filter and subset the costs and the other five were used in analysis. See Suppl. mate-
rial 2 for further information on the considered categories.

     (i) Method reliability (High or Low): Cost estimates, extracted from peer-reviewed
publications or official reports or with documented, repeatable and/or traceable meth-
ods, were considered to have High reliability; all other estimates were designated as Low
reliability (Diagne et al. 2020a);
     (ii) Implementation (Observed or Potential): Cost estimates that occurred in the
invaded habitat were designated Observed and those or that were extrapolated or pre-
dicted to occur were deemed Potential.

    We calculated full costs, which include potential and low reliability estimates, but
excluded these more speculative estimates when examining the data in detail (as well
as for the following subsections). The more detailed, conservative analysis, therefore,
considered only the following descriptors:

     (iii) Country (England, Scotland, Wales, Northern Ireland). Where costs were at-
tributed to a particular country, we presented costs to that country; other costs were
recorded as spanning multiple countries, i.e. Great Britain (i.e. excluding Northern
Ireland) or the UK (i.e. including Northern Ireland);
     (iv) Environment of the invasive species (Terrestrial, Aquatic, Semi-aquatic or Diverse/
Unspecified): the habitat from which the species causing the cost originated. Here, we
considered that Semi-aquatic corresponds to species that are closely associated with water
for development, reproduction and/or foraging (e.g. M. coypus is a semi-aquatic rodent);
United Kingdom invasion costs 307
(v) Type of cost: (a) Damage referring to damages or losses incurred by invasion
(e.g. costs for damage repair, resource losses, medical care), (b) Management compris-
ing control-related expenditure (e.g. monitoring, prevention, management, eradica-
tion) and money spent on education, research and maintenance costs, (c) Mixed in-
cluding mixed damage and management costs (cases where reported costs were not
clearly distinguished amongst cost types);
(vi) Impacted sector: the activity, societal or market sector that was impacted by the
cost (Agriculture, Authorities-Stakeholders, Environment, Fishery, Forestry, Public and social
welfare); individual cost entries not allocated to a single sector were classified as Mixed;
(vii) Kingdom: the taxonomic kingdom of the species associated with each cost en-
try. Where this information was missing, taxa were deemed to be Diverse/Unspecified.
Viruses were included as a general ‘kingdom’, but only counted if they were vectored
by an invasive species in the UK subset (e.g. squirrelpox virus vectored by the grey
squirrel Sciurus carolinensis).
Question 2: Taxonomic biases in invasion costs
To identify the proportions of invasive species in the UK for which cost data are avail-
able, the list of individual species in InvaCost was compared with comprehensive lists
of invasive species in the UK. Lists of known invasive species were extracted and com-
piled for the UK from the following databases: (1) InvaCost version 3.0; (2) the Global
Invasive Species Database (GISD); (3) the sTwist database; and (4) the Great Britain
Non-native Species Information Portal (GB-NNSIP) (Table 1). Only species listed
within the UK were extracted from each database, with listed species checked to con-
firm their alien status and refined accordingly. We classify all of these species as “inva-
sive”, but note that the definitions of invasiveness differ slightly amongst these datasets
(Table 1). We used the GBIF.org Backbone Taxonomy to standardise species names.
Rank-abundance analyses were used to determine the unevenness of species’ costs
according to cost types (management and damage), environments (aquatic, semi-
aquatic and terrestrial) and kingdoms (plants and animals).
A keyword search on the Web of Science over the period 1960 to 2020 was used to
quantify research effort (i.e. publication numbers) towards individual species listed as
invasive in the UK (Table 1). Global and UK-only searches were conducted to determine
research effort, as indicated by numbers of publications. The Global search string used
species’ scientific names only; the UK-only search string combined the scientific name
of the species with “UK” OR “United Kingdom” OR “Great Britain” OR “England”
OR “Scotland” OR “Wales” OR “Northern Ireland”. For example, the search string
used to retrieve the number of studies for Oryctolagus cuniculus was: TS=(“Oryctolagus
cuniculus”) AND TS=(“UK” OR “United Kingdom” OR “Great Britain” OR “Eng-
land” OR “Scotland” OR “Wales” OR “Northern Ireland”), where TS is the “Topic”.
The results and specific search terms are provided in Suppl. material 3.
We used a Kruskal-Wallis test to compare research efforts for invasive species that
were present vs. absent from InvaCost. This tested the null hypothesis that research
effort was equal across species with and without published impact costs. We also used308 Ross N. Cuthbert et al. / NeoBiota 67: 299–328 (2021)
Table 1. Initial numbers of known invasive species extracted from the InvaCost, GISD, sTwist and GB-
NNSIP databases for the UK. Definitions of invasiveness are provided in relation to each database, along
with underlying sources of data extracted.
Database Species (n) Invasive definition Data source
InvaCost 42 Invasive alien species with reported economic Version 3.0, Diagne et al. (2020a; https://doi.
impacts. org/10.6084/m9.figshare.12668570).
GISD 216 Alien species with known negative impacts on GISD (www.iucngisd.org/gisd).
biodiversity in the region where they are invasive.
sTwist 321 A taxon whose introduction and/or spread Version 1.2.3, https://doi.org/10.5281/zenodo.3763222.
threatens biological diversity (Convention on Underlying data sources: Caphina et al. (2017); GAVIA
Biological Diversity). (Dyer et al. 2017); Global Alien First Records Database
(Seebens et al. 2017); GloNAF (van Kleunen et al.
2015); GRIIS (available via: GBIF.org).
GB- 282 An introduced taxon designated as having a Roy et al. (2014b).
NNSIP negative ecological or human impact.
linear regression to test the relationship between species’ total economic costs and their
research effort, on a log10 scale to normalise residuals and homogenise variances. Here,
a significant positive relationship would indicate that greater invasion costs are re-
ported for invasive species with larger numbers of studies.
Question 3: Temporal dynamics of invasion costs
The cost over time of all UK invasive species was calculated via the summarizeCosts func-
tion of the ‘invacost’ R package (Leroy et al. 2020). This function illustrates the dynamics
of costs over time, projecting the mean cost per decade, as well as the mean cost over the
entire reported period (i.e. from 1976 to 2019; the last year with robust, reported costs).
Using first record information from the sTwist database, we used linear regression
to examine the relationship between the length of time a species has been reported as
invasive in the UK and its total invasion cost. First record information was available for
35 species reported in InvaCost (of the 42 species with individual cost entries). Both
time since introduction and total economic costs were modelled on a log10 scale to
normalise residuals and homogenise variances. We thus tested whether species with an
earlier year of introduction accrued greater impacts than species that were introduced
more recently. For each species and year of introduction, we also examined introduc-
tion pathway information (Suppl. material 4), as reported in the DAISIE database
(Roy et al. 2020). This database is an inventory of invasive species in Europe, in the
form of a checklist; we used UK-specific data only.
Results
Question 1: Invasion costs distributions through space and sectors
Biological invasions cost the UK economy an amount estimated from $6.9 billion to
$17.6 billion (£5.4 billion – £13.7 billion) between 1976 and 2019. The lower, moreUnited Kingdom invasion costs 309
conservative cost estimate excludes Potential costs ($5.2 billion; £4.0 billion; 103 en-
tries) and Low reliability costs ($5.5 billion; £4.3 billion; 101 entries). We use the more
conservative estimates for all further analyses below (538 entries).
Of the total for the whole of the UK, $4.3 billion (£3.3 billion) was attributed to
the UK and $2.4 (£1.9 billion) billion to Great Britain. Much lower cost totals were
recorded per country, with $81.5 million (£63.3 million) to Northern Ireland, $76.2
million (£59.2 million) to England, $34.9 million (£27.1 million) to Scotland and
$2.4 million (£1.9 million) to Wales. Therefore, the vast majority of invasion costs
were reported at larger spatial scales.
Where costs were assigned to specific taxa, the majority were attributed to animals
($4.7 billion, 267 entries; including $2.4 billion to mammals and $1.5 billion to in-
sects), followed by plants ($1.3 billion, 99 entries) and then fungi ($206.7 million,
2 entries). Invasive chromists (16 entries) and viruses (10 entries) cost $771,575 and
$775,451, respectively. However, a large sum of invasion costs in the UK was either
not taxonomically defined or spanned multiple kingdoms (i.e. Diverse/Unspecified;
$781.6 million, 144 entries).
Terrestrial habitats were most impacted overall ($6.4 billion, 245 entries) and had
the highest number of cost entries. Impacts to aquatic ($258.5 million, 116 entries)
and semi-aquatic habitats ($51.7 million, 86 entries) were, respectively, one and two
orders of magnitude lower (Fig. 1), despite high numbers of cost entries. A relatively
small portion of total economic costs was reported from entries that affected multiple
or unspecified environment types ($172.0 million, 91 entries) (Fig. 1).
The costliest impacts of invasions in the UK were incurred by the agricultur-
al sector ($4.9 billion, 32 entries), followed by authorities and stakeholders (i.e.
governmental services and/or official organisations, $955.9 million, 436 entries),
mixed sectors ($824.6 million, 41 entries), as well as forestry ($144.2 million,
11 entries). Public and social welfare ($37.8 million, 10 entries), fisheries ($11.0
million, 5 entries) and the environment ($7.8 million, 3 entries) were reportedly
impacted to a much lesser degree. Agricultural, mixed and forestry impacts were
typically incurred through direct damage or losses to resources, whilst impacts
to authorities and stakeholders were mostly related to management expenditure.
Across these sectors and cost types, terrestrial environments were dominant, with
relatively few contributions from aquatic and semi-aquatic environments overall in
terms of invasion costs. In contrast to terrestrial environments, where costs were
mostly damage-related, aquatic and semi-aquatic costs were more likely to be from
management actions (Fig. 1).
Question 2: Taxonomic biases in invasion costs
Overall, cost data in the UK were reported for 42 invasive species in InvaCost (with
individual cost entries; n = 56 including species within ‘mixed’ entries). However, there
were 520 unique invasive species in the UK reported in InvaCost, sTwist, GISD or
GB-NNSIP, thus meaning that approximately 8% of known invasive species in the UK
have documented economic costs (Fig. 2a). Invasive species with reported cost data310 Ross N. Cuthbert et al. / NeoBiota 67: 299–328 (2021)
Environment Cost type Impacted Sector
Damage
$4.84 bn $4.93 bn Agriculture
Terrestrial $6.43 bn
$0.96 bn Authorities Stakeholders
Management
$1.81 bn
$0.82 bn Mixed
Aquatic $0.26 bn
$0.14 bn Forestry
Semi-Aquatic Public and social welfare $0.04 bn
$0.05 bn
Mixed Fishery $0.01 bn
Diverse Unspecified $0.17 bn
Environment $0.01 bn
$0.26 bn
Figure 1. Alluvial plot illustrating flows of identified invasion cost types in the UK amongst environ-
ments and socioeconomic sectors. Abbreviations: bn is billion (2017 US$).
(a) (b)
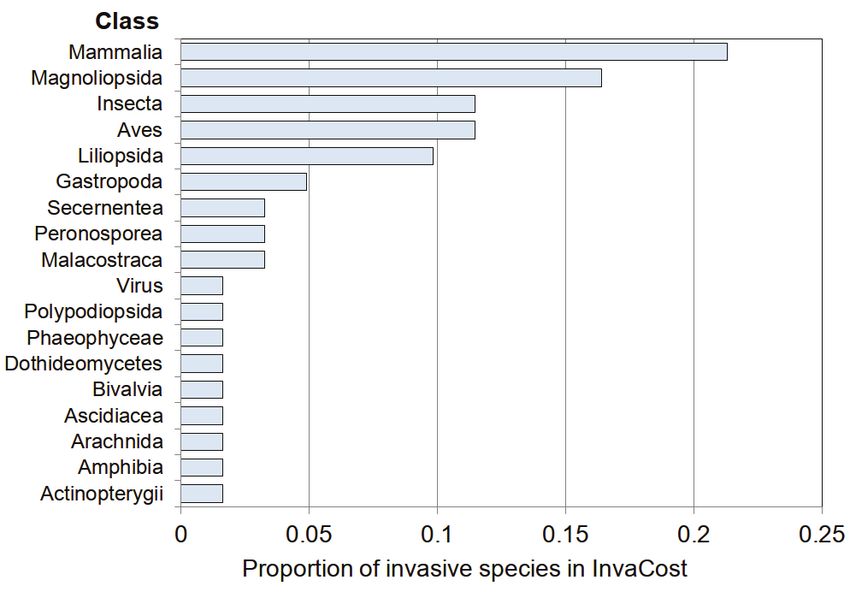
Figure 2. Barplots showing a total numbers of all known invasive species in the UK (i.e. species within
GISD, sTwist and GB-NNSIP) and UK invasive species in InvaCost; and b proportions of UK invasive
species in InvaCost across classes.
mainly belonged to the Mammalia (21%), Magnoliopsida (16%), Insecta (11%) and
Aves (11%) classes (Fig. 2b).
Cost contributions were highly uneven across species overall (Fig. 3). Considering
total costs, the European rabbit O. cuniculus contributed 62%, followed by JapaneseUnited Kingdom invasion costs 311
100% (a) Overall 100% (b) Management 100% (c) Damage
European rabbit
80% 80% 80% Oryctolagus cuniculus
European rabbit Japanese knotweed
60% Oryctolagus cuniculus 60% Reynoutria japonica 60%
40% 40% 40%
Japanese knotweed
20% Reynoutria japonica 20% Brown rat 20% Rock pigeon
Rattus norvegicus
Rock pigeon Columba livia
Columba livia European rabbit Oryctolagus cuniculus
Varroa mite Varroa destructor
0% 0% 0%
5 10 20 30 40 5 10 15 20 25 30 35 40 4 8 12 16 20
100% (d) Aquatic 100% (e) Semi-aquatic 100% (f) Terrestrial
Proportion of cost
80% 80% 80%
European rabbit
Oryctolagus cuniculus
60% 60% Ruddy duck 60%
Oxyura jamaicensis
Floatting pennywort
40% Hydrocotyle ranunculoides 40% 40%
20% Canadian pondweed 20% Coypu Myocastor coypus 20% Japanese knotweed
Elodea canadensis American mink Neovison vison Reynoutria japonica
Waterweed Elodea nuttallii Rock pigeon
Columba livia
0% 0% 0%
3 6 9 12 15 2 4 6 8 10 5 10 15 20 25
100% (g) Plants 100% (h) Animals
80% Japanese knotweed 80% European rabbit
Reynoutria japonica Oryctolagus cuniculus
60% 60%
40% 40%
20% Floatting pennywort 20% Rock pigeon
Hydrocotyle ranunculoides Columba livia
Canadian pondweed Elodea canadensis Brown rat Rattus norvegicus
0% 0%
3 6 9 12 15 5 10 15 20 25 30
Species rank
Figure 3. Whittaker plots illustrating ranked proportional cost contributions across species for a overall
b management c damage d aquatic e semi-aquatic f terrestrial g plant and h animal cost categories. The
top three highest-contributing species are labelled on each subplot, for example, the European rabbit
ranks as the costliest species a overall, for c damage costs and amongst the terrestrial organisms (f) and
animal kingdom (h), representing 62%, 82%, 66% and 77% of costs in the respective categories. Note
the differences in x-axes scaling.
knotweed (Reynoutria japonica) and the rock pigeon (Columba livia). Japanese knot-
weed dominated management costs (62%), followed by the brown rat (R. norvegicus)
and European rabbit. Damage costs were again dominated by the European rabbit
(82%), followed by the rock pigeon, with Varroa mite (Varroa destructor) third.
Aquatic environments were mostly impacted by floating pennywort (Hydrocotyle
ranunculoides) (45%) and Canadian pondweed (Elodea canadensis) (16%), thereafter
waterweed (Elodea nuttallii). Semi-aquatic taxa costs were mostly driven by the ruddy
duck (Oxyura jamaicensis) (55%), coypu (Myocastor coypus) and American mink (Neo-
vison vison). Costs in terrestrial environments were driven predominantly by the Euro-
pean rabbit (66%), Japanese knotweed and rock pigeon. Overall, the majority of spe-312 Ross N. Cuthbert et al. / NeoBiota 67: 299–328 (2021)
a) Oryctolagus cuniculus
0
Reynoutria japonica
Columba livia
Hydrocotyle ranunculoides Rattus norvegicus
US$ billion (log10) (2017 value)
Varroa destructor Sciurus carolinensis
Oxyura jamaicensis
Elodea nuttallii Elodea canadensis Rhododendron ponticum
Myocastor coypus Dreissena polymorpha
-2 Crepidula porcellana
Branta canadensis Pacifastacus leniusculus
Lagarosiphon major Azolla filiculoides
Neovison vison
Myriophyllum aquaticum Crassula helmsii Elatobium abietinum
Buddleja davidii Heracleum mantegazzianum Impatiens glandulifera
Glis glis
Thrips palmi Dothistroma septosporum Cygnus olor Amphibian
Arthropod
Leptinotarsa decemlineata Squirrelpox virus Pseudorasbora parva Bird
Psittacula krameri
Decapod
Dendroctonus micans Bemisia tabaci Fish
Didemnum vexillum Fungi
-4 Hyacinthoides hispanica Insect
Myiopsitta monachus Mammal
Alopochen aegyptiaca Sargassum muticum Mollusc
Lithobates catesbeianus Diverse Animals
Ludwigia grandiflora Plant
Other Organisms
1 10 100
Number of publications (1960-2020)
1000
b) Amphibian
c)
(# species = 1)
Number of publications per species (1960-2020)
Arthropod
(# species = 1)
Decapod
(# species = 1)
Insect 100
(# species = 5)
Bird
(# species = 7)
Fish
(# species = 1)
Mammal
(# species = 6)
Mollusc 10
(# species = 2)
Diverse Animals
(# species = 1)
Fungi
(# species = 1)
Plant
(# species = 14)
Other Organisms 1
(# species = 2)
0 50 100 150 200
Species without cost
Number of publications (1960-2020) Species with cost
Figure 4. Per-species invasion costs and study efforts showing a the number of publications available in
Web of Science for the period 1960–2020 for each species with InvaCost records against the total cost for
each species in billion US$ (2017 value; log10 scale; shaded area is 95% confidence interval) b the distribu-
tion of the number of publications available in Web of Science for the period 1960–2020 for each species
with invasion costs by organism group (“# species” refers to numbers of species in InvaCost within that
group) and c distribution of publication numbers of invasive species with and without costs.
cies with monetary costs (83%) each contributed less than 1% of the respective total
cost (Fig. 3). Costs of the European rabbit were incurred predominantly by agricultural
impacts (93%); Japanese knotweed through impacts to authorities and stakeholders
(97%); and rock pigeon towards mixed sectors (100%).
Invasive species with economic costs were associated with significantly more pub-
lications than UK invasive species without costs (χ2 = 32.79, df = 1, p < 0.001; Suppl.
material 5: Fig. S1; Fig. 4). Of those invasive species present in InvaCost, total per-United Kingdom invasion costs 313
10,000,000,000.0
1,000,000,000.0
Average annual cost per period in US$
100,000,000.0
10,000,000.0
1,000,000.0
100,000.0
10,000.0
1,000.0
100.0
10.0
1.0
06
76
16
86
96
19
20
19
20
19
19
20
Year
Figure 5. Annual average costs of biological invasions in the United Kingdom, considering decadal
means (except 2016 to 2019: four years mean). Grey points indicate annual total costs. Note the y-axis is
on a log10 scale.
species costs were positively related to numbers of studies per species (t = 3.32, p < 0.01;
Fig. 4a). Plants, birds, mammals and insects had the highest numbers of species with
costs (Fig. 4b), whilst many other taxa comprised just one species. Plants had relatively
few publications per species, yet many invasive plants exhibited high costs relative to
their study effort (e.g. floating pennywort, H. ranunculoides; Japanese knotweed, R.
japonica). For birds, the rock pigeon (C. livia) and ruddy duck (O. jamaicensis) had the
highest costs relative to publications. Mammals were generally the focus of the most
published studies, with taxa such as the coypu (M. coypus) and European rabbit (O.
cuniculus) having especially high costs relative to their study intensity (Fig. 4).
Question 3: Temporal dynamics of invasion costs
In examining the raw cost trends over time, between 1976 and 2019, the accumulated
costs of $6.9 billion ($157.1 million per year; £5.4 billion and £122.1 million, respec-
tively) increased steadily until 2005, being between $411,987 (1976–1985) and $1.7
million (1986–1995) per year until 1995. Costs then grew rapidly to between $338.7
million and $350.0 million per year after 1995 (Fig. 5). Cost reporting reduced in314 Ross N. Cuthbert et al. / NeoBiota 67: 299–328 (2021)
Oryctolagus cuniculus
0
Reynoutria japonica
Columba livia
−1 Hydrocotyle ranunculoides Rattus norvegicus
Economic cost (log10 US$ billion)
Varroa destructor
Sciurus carolinensis Pathway
Oxyura jamaicensis Elodea canadensis
Aquaculture
Elodea nuttallii Dreissena polymorpha Diverse/Unspecified
Rhododendron ponticum
−2 Pacifastacus leniusculus Neovison vison Myocastor coypus Escapes
Branta canadensis
Myriophyllum aquaticum Lagarosiphon major Fauna improvement
Azolla filiculoides
Crassula helmsii
Forestry
Buddleja davidii Impatiens glandulifera Ornamental
Heracleum mantegazzianum
Cygnus olor Glis glis
−3
Pseudorasbora parva
Psittacula krameri
Dendroctonus micans
Didemnum vexillum
−4 Sargassum muticum
Hyacinthoides hispanica
Myiopsitta monachus Alopochen aegyptiaca
Lithobates catesbeianus
Ludwigia grandiflora
1.0 1.5 2.0 2.5 3.0
Minimmum residence time (log10 no. years)
Figure 6. Invasion costs (US$ billions) as a function of number of years since introduction for UK
invasive species. Note that both the x- and y-axes are on a log10 scale. The dashed line represents a linear
regression model fit and the shaded area the 95% confidence interval. Pathways of introduction per spe-
cies are indicated by different fill shapes and colours.
recent years, causing lower average costs in the last four years, likely due to time lags
in cost reporting.
Of the 35 UK invasive species present in InvaCost with first record information,
there was high variation in species’ costs ($18,300 to $2.12 billion) and minimum
residence times (9 to 885 years; time since first record of introduction; Fig. 6). None-
theless, species that have been present in the UK for longer tended to have significantly
higher invasion costs (t = 2.93, p < 0.01). There were several anomalies, however, to
this trend, with species, such as the floating pennywort (H. ranunculoides), Varroa mite
(Varroa destructor) and European rabbit (O. cuniculus), displaying disproportionately
high impacts relative to their minimum residence time. Conversely, species, such as
the Egyptian goose (Alopochen aegyptiaca), Spanish bluebell (Hyacinthoides hispanica)
and edible dormouse (Glis glis), had relatively low economic effects, despite their early
record of introduction (Fig. 6).
Of the five specified pathways of UK invasive species introductions, species in-
troduced via the ornamental pathway were most common (12 species), followed by
escapes (3 species); almost half of species were introduced via multiple (diverse) or
unspecified pathways (17 species). In turn, diverse and unspecified pathways con-United Kingdom invasion costs 315 tributed the greatest costs ($2.8 billion), followed by escapes ($0.49 billion) and ornamental species ($0.17 billion). There was, however, generally no trend between pathway prevalence and minimum residence time for the assessed UK invasive spe- cies (Fig. 6). Discussion Biological invasions have cost the UK economy at least $6.9 billion (£5.4 billion) since 1976 and possibly at least $17.6 billion (£13.7 billion) if we include low reliability and potential costs (Diagne et al. 2020a). Costs have been rising rapidly over time and species with longer residence times have accrued higher invasion costs. However, there were no cost estimates for 90% of invasive species recorded so far in the UK. Of the costs reported for individual species, 90% were caused by approximately 10% of all invasive species in the UK with costs. Although the more costly species are also the most studied, the lack of any cost data for the majority of invasive species suggests that knowledge gaps are pervasive and that total costs of invasive species in the UK are underestimated. If cost reporting was complete for all invasive taxa, activity sectors, geographic regions and through time, UK invasion costs would likely be far greater than those reported here. Our totals also exclude invasion costs based on extrapola- tions or predictions ($5.2 billion), which calls for further research effort to decipher economic costs empirically. Impacts to certain activity sectors, such as fisheries and the environment, require urgent quantification, given the available means of quantifying economic impacts from environmental degradation and losses of ecosystem services from invasions (Hanley and Roberts 2019). Question 1: Invasion costs distributions through space and sectors Invasion costs were mostly reported at UK or Great Britain scales and, thus, further cost reporting is required at country-level scales or lower within the UK to improve and pinpoint management actions. Most costs stemmed from direct damage rath- er than management spending and principally impacted the agriculture sector. This dominance of damage-related costs over management aligns with trends in other geo- graphic regions worldwide (Crystal-Ornelas et al. 2021; Haubrock et al. 2021a; Her- inger et al. 2021; Liu et al. 2021). Invasion impacts in the UK were largely driven by animals, which were both the most studied and costliest taxa. Terrestrial invasion costs were most frequently documented and accounted for 93% of reported impacts overall. Contrastingly, there were comparatively few studies documenting economic impacts of aquatic and semi-aquatic invasions, despite the presence of multiple aquatic invaders that are recognised as a high management priority in the UK (e.g. Oreska and Aldridge 2011; Booy et al. 2020) and high global aquatic invasion costs (Cuthbert et al. 2021a). This trend might also reflect broader research biases within ecology towards terrestrial over aquatic environments (Menge et al. 2009; Cuthbert et al. 2021a) or perhaps re-
316                 Ross N. Cuthbert et al. / NeoBiota 67: 299–328 (2021)

flect that aquatic invasion costs are more difficult to be observed empirically and thus
likely to be predicted (and therefore excluded from our data subset).
     Reported management costs were substantially lower than reported damage costs.
Management costs were primarily incurred by authorities and stakeholders that are re-
sponsible for ecosystem management practices in the UK, rather than through primary
sectors (e.g. agriculture and forestry). Aquatic and semi-aquatic invaders were more
likely to incur management costs than direct damage, but the converse was true for
terrestrial species. A study by Oreska and Aldridge (2011) found that aquatic invad-
ers cost Great Britain £26.5–£43.5 million per year; like our study, most costs were
attributed to macrophytes and bivalves. This suggests that observed management cost
totals for aquatic systems ($258.5 million since 1976; £200.9 million) in our study
may be underestimated. Nonetheless, aquatic invasion costs were found to be at least
one order of magnitude lower than terrestrial impacts overall. A similar finding has
been made at the global scale, where aquatic invasion costs have been found to have
reached over $20 billion in the year 2020 alone, but remain an order of magnitude
lower than terrestrial invasion costs in total (Cuthbert et al. 2021a). A lack of observed
aquatic invasion costs in the UK may stem from a paucity in damage reporting from
aquatic taxa or suggest that aquatic invasion costs are more likely to be predicted or
extrapolated, given the difficulty in monitoring submerged environments. Awareness
campaigns such as Check, Clean, Dry have spearheaded aquatic biosecurity in the UK,
with recent methods developed to improve invader decontaminations (Anderson et al.
2015; Bradbeer et al. 2020). Recent criticisms have, however, been raised surrounding
the efficacy of existing biosecurity protocols to prevent aquatic invasions and invasive
species secondary spread across Europe (Coughlan et al. 2020).
     More effective and coordinated management strategies are required to help limit
future invasion costs in the UK, particularly in the terrestrial realm where damages
are most burgeoning. Such management strategies should consider the range of path-
ways through which costly invaders have established (Robertson et al. 2020), as well
as scientific evidence which indicates the most damaging species. Proactive manage-
ment strategies, such as biosecurity, can prove disproportionately more cost-effective
than longer-term, reactive interventions at more advanced invasion stages (Leung et al.
2002; Williams et al. 2010; Ahmed et al. 2021). Moreover, nations that fail to develop
sufficient management strategies, at any invasion stage, could incur greater resource
damages and losses as a result of biological invasions, such as through impacts to ag-
riculture, forestry and human health sectors (Aukema et al. 2011; Paini et al. 2016).
     Similar to prior estimates of UK invasion costs (Williams et al. 2010), we found
the agricultural sector to be the most impacted overall and with cost types dominated
by damages and losses, principally by animals. More broadly, this trend is congru-
ent with a growing threat to agricultural enterprises worldwide by invasive species,
threatening food production (Paini et al. 2016). Economic impacts were accordingly
dominated by taxa affecting agriculturally-intensive terrestrial environments (e.g. Eu-
ropean rabbit, brown rat, Varroa mite), where damage can be more readily perceived
than in submerged realms. These results also corroborate Williams et al. (2010), where
You can also read