Economic Impact Assessment of Grootvlei Power Station - Centre for Environmental Rights
←
→
Page content transcription
If your browser does not render page correctly, please read the page content below
as

Economic
Impact
Assessment
of Grootvlei
Power
Station
Eskom Holdings SOC
Ltd.
07 July 2017
 1
Disclaimer This report has been prepared by KPMG Services (Pty) Ltd (“KPMG”) exclusively for the benefit, information use of ESKOM for the exclusive purposes of/in order to assist ESKOM to estimate the socio-economic impact of the coal power station’s capital and operational expenditure between 2014/15 to 2016/17. KPMG has been informed and requested by ESKOM that this report may be published, as well as shared individually with third parties. Notwithstanding the provisions of the Engagement Letter and Terms and Conditions, KPMG is willing to give its consent for ESKOM to do so on the following basis: KPMG accepts no liability to any third party in connection with the Services; and KPMG does not have a duty of care or any legal obligation to any third party in connection with the Services. 2
Glossary
CPI Consumer Price Index

CSR Corporate Social Responsibility

DoE Department of Energy

EIA Economic Impact Assessment

EIUG Energy Intensive Users Group

EUF Energy Utilisation Factor

FBE Free Basic Electricity

GHG Greenhouse Gases

GDP Gross Domestic Product

GOS Gross Operating Surplus

GWh Gigawatt hours

GVA Gross Value Added

IEP Integrated Energy Plan

I-O Input-Output

IRP Integrated Resource Plan

ISO International Organisation Standards

LTIR Loss Time Injury Rate

MW Megawatts

NDP National Development Plan

NOSA National Occupational Safety Association

OECD Organisation for Economic Co-operation and Development

OHSAS Occupational Health and Safety Assessment Series

PDCA plan-do-check-act

PPI Producer Price Inflation

 3

QLFS Quarterly Labour Force Survey

q-o-q quarter-on-quarter

SAM Social Accounting Matrix

SARB South African Reserve Bank

SDGs Sustainable Development Goals

SIC Standard Industrial Classification

StatsSA Statistics South Africa

UAGS Unplanned Automatic Grid Separations

UK United Kingdom

UN United Nations

UNDP United Nations Development Programme

USA United States of America

y-o-y year-on-year

 4
Glossary of terms
Average per year The average per year is the total impact over the period, divided by
 number of years.
Direct impact Includes the first round effects where increased demand for
 particular goods/services leads to increased business activity and
 thus a direct change in sectoral production. This would be the
 number of people employed by the power station in order for the
 power station to operate.
Energy Availability Factor Measures plant availability including planned maintenance and
(EAF) unplanned breakdowns and energy losses not under plant
 management control
Gross Domestic Product A monetary value of all the finished goods and services produced
(GDP) within a country's borders in a specific period. In addition, GDP is a
 good indicator of economic growth and welfare, as it represents,
 amongst other, the remuneration of employees and gross
 operating surplus (GOS) (profits) as components of value added to
 the economy.
Gross Operating Surplus Economic rent or value of capital services flows or benefit from the
(GOS) asset.
High-income households Include households with an annual income of R305 115 and above.
Household income All receipts by all members of a household, in cash and in kind, in
 exchange for employment, or in return for capital investment, or
 receipts obtained from other sources such as social grants,
 pension, etc.
Indirect impact Includes the second round effects that change the demand for
 factors of production and household income, which can be
 explained by the inter-linkages of sectors in the economy. With
 reference to this project, these impacts emanate from the
 increased demand for goods and services acquired by the power
 station’s suppliers from external service providers such as
 consultants, external training providers, sub-contractors, etc, as
 well as increased employment opportunities created on the back of
 this economic activity. These industries themselves generate
 additional economic output and employment and in turn generate
 additional demand for goods and services along their supply chains.
Induced impact Includes the multiplier effect that arises through the second round
 of spending. This is the increase in household income and the
 additional spending that arises from the change in income levels
 from the new employment opportunities created due to
 expenditure by the supplier. The induced contributions stem from
 how electricity industry employees and the employees of its
 suppliers spend a share of the additional income generated through
 their consumption of goods and services in the wider economy.
Integrated Development Integrated Development Plans (IDPs) are required to be undertaken
Plan by all District and Local Municipalities. The IDPs set out the
 development vision for the municipality and allies this to dedicated
 projects to be undertaken over the life span of the IDP (5 years).
ISO 14001 International standard that provides assurance that environmental
 impact is being measured and improved.

 5
ISO 9001 International standard that specifies requirements for a quality
 management system (QMS). Organizations use the standard to
 demonstrate the ability to consistently provide products and
 services that meet customer and regulatory requirements.
ISO 17025 International standard that provides a laboratory with the criteria
 necessary to implement in order for it to perform its test work
 competently
Lost Time Injury Rate The LTIR refers to the proportional representation of the
(LTIR) occurrence of lost-time injuries (including occupational diseases)
 over 12 months per 200 000 working hours
Low-income households Include households with an annual income of up to R6 324
Medium income Include households with an annual income of between R6 324 and
households R305 114
OHSAS 18001 Occupational Health and Safety Management System (OHSMS)
 with the purpose of measuring and improving organisational health
 and safety impacts
Rest of South Africa The provinces of South Africa, with the exception of Mpumalanga
Unplanned Automatic Grid This tracks the average grid separation rate.
Separations (UAGS)

 6
Contents
Disclaimer 2

Executive summary 9

1 Aim, context and overview of report 15

1.1 The development of Grootvlei Power Station 15

1.2 Purpose of this study 17

1.3 Acknowledgements 17

1.4 Data validation, data quality and data reliance 17

1.5 Layout of the report 19

2 Approach to estimating Grootvlei Power Station’s economic
 contribution 21

3 Economic and industry overview 25

3.1 South African economic overview 25

3.2 Mpumalanga economic overview 30

3.3 Electricity industry overview 32

4 Grootvlei Power Station’s estimated economic contribution through
 capital expenditure 35

4.1 Grootvlei Power Station’s capital investment 35

4.2 Grootvlei Power Station’s estimated contribution to GDP through capital expenditure 37

4.3 Grootvlei Power Station’s estimated contribution to employment through capital
 expenditure 39

4.4 Grootvlei Power Station’s estimated contribution to the national fiscus through capital
 expenditure 41

4.5 Grootvlei Power Station’s estimated contribution to households through capital expenditure
 42

4.6 Potential future economic benefits through capital expenditure 43

5 Grootvlei Power Station’s estimated economic contribution through
 day-to-day operations 46

 7
5.1 Grootvlei Power Station’s income through electricity generation 46

5.2 Grootvlei Power Station’s estimated contribution to GDP through day-to-day operations 46

5.3 Grootvlei Power Station’s estimated contribution to employment through day-to-day
 operations 49

5.4 Grootvlei Power Station’s estimated contribution to the national fiscus through day-to-day
 operations 51

5.5 Grootvlei Power Station’s estimated contribution to households through day-to-day
 operations 52

5.6 Estimated future economic benefits through day-to-day operations 53

6 Local Economy 56

6.1 Economic overview of Dipaleseng Local Municipality and the local towns 56

6.2 Estimated economic contribution through capital expenditure and day-to day operations 60

7 Grootvlei Power Station’s quality of jobs 64

7.1 Measuring the quality of jobs 64

7.2 Estimating quality of jobs 65

8 Conclusion 68

8.1 Grootvlei Power Station’s economic contribution to Mpumalanga and the rest of South
 Africa 68

8.2 Quality of jobs and skills development 71

8.3 Local community impact 72

Appendix 74

Input-Output table 74

Input-Output table as an analytical tool 79

The Social Accounting Matrix 82

Limitations 84

Disclaimer 84

 8
Executive summary
Eskom contracted KPMG Services (Pty) Ltd (KPMG) to undertake a research project on the economic
impact of the Hendrina, Grootvlei, Kriel, Camden and Komati Power Stations’ capital and operational
expenditure over the period 2014/15 to 2016/17.

The purpose of this economic impact report is to highlight the economic contribution that Grootvlei
coal fired power station (hereafter “Grootvlei Power Station”) makes to Mpumalanga, the rest of
South Africa and Dipaleseng Local Municipality. The document sets out Grootvlei Power Station’s
estimated footprint through the positive economic spin-offs from the capital investment as well as its
day-to-day operation. Current spend for capital investment and day-to-day operation relates to the
period 2014/15 to 2016/17.

Importance of determining Grootvlei Power Station’s estimated
economic contribution
As part of fulfilling Eskom’s mandate “to provide electricity in an efficient and sustainable manner”1,
Grootvlei Power Station provides coal fired power, facilitating the generation of electricity in
Mpumalanga and South Africa. Grootvlei Power Station is the 12th largest (of 14) coal station by
generating capacity. Grootvlei Power Station has a generating capacity of 1 180 Megawatt (MW).
With this, Grootvlei Power Station addresses an estimated 2.5% of South Africa’s electricity needs.

In order to realise the Eskom mandate, Grootvlei Power Station needs to implement the safety,
health, environment and quality requirements through the plan-do-check-act (PDCA) quality cycle. In
achieving some of these requirements, Grootvlei Power Station potentially considered economic
development, environmental duty of care and social equity to continually improve performance and
achieve stakeholder requirements. Therefore, Grootvlei Power Station ensures security of electricity
supply, which enables economic growth.

Estimating Grootvlei Power Station’s economic contribution confirms that the electricity sector and
Grootvlei Power Station in particular is effectively contributing to national energy and economic
growth targets. This is evident not only from the contribution it makes to economic productivity,
employment, tax revenue and household income but also through the positive influences on quality
of jobs.

Approach to determining Grootvlei Power Station’s estimated
economic contribution
The Economic Impact Assessment (EIA) considered for this project is based on the theory of input-
output analysis developed by Wassilly Leontief. The basis of input-output analysis is that it shows the
financial interdependencies between different sectors of the economy in a matrix format. EIAs are
widely accepted, with several credible international organisations such as the United Nation’s Food
and Agriculture Organisation, the World Bank, International Model for Policy Analysis of Agricultural
Commodities and Trade, the Organisation for Economic Co-operation and Development employing
the methodology.

We incorporate the structure of this input-output model into the national accounting systems of
various countries, including South Africa, to form an important representation of measures such as
Gross Domestic Product (GDP). In this report, we focus on Grootvlei Power Station’s impact on

1
 Eskom, Mandate, Vission, Mission, Strategy, 2017. Accessed at:
http://www.eskom.co.za/OurCompany/CompanyInformation/Pages/Business_Vision.aspx

 9
Mpumalanga, South Africa and Dipaleseng Local Municipality through GDP, job creation, tax
collection and poverty alleviation.
Through its capital investment and day-to-day operations, Grootvlei Power Station directly influences
outcomes in the economy. More specifically, it does so through the forward and backward linkages
with other industries and its operations within the energy industry and the entire economy. Linkages
refer to forward and backward linkages that occur between consecutive steps of a production value
chain. A forward linkage exists where Grootvlei Power Station uses the product of a particular firm or
industry as an input or raw material in production. Conversely, a backward linkage occurs where
another firm or industry uses Grootvlei Power Station’s product as raw materials or inputs. The
benefit of having an increased number of such backward linkages within an economy is that such
linkages centre local demand for raw materials and reduces dependence on imports. Instead, local
industry can rely on local suppliers for the supply of raw materials.

Grootvlei Power Station’s estimated economic contributions
As mentioned, Grootvlei Power Station’s capital expenditure and day-to-day operations influence
Mpumalanga and South Africa in terms of their contribution to employment creation, economic
growth, government tax revenue, as well as poverty alleviation. These estimated impacts, based on
the EIA results, are summarised below.

 10
Source: KPMG analysis from 2014 Social Accounting Matrix for South Africa and Mpumalanga

 11
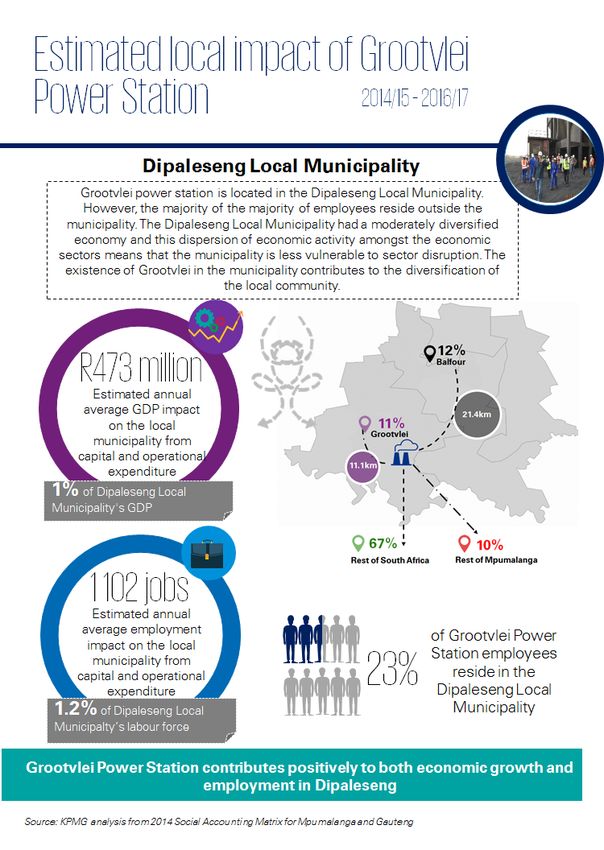
Grootvlei Power Station’s local community impact
Mpumalanga province is divided into three district municipalities (Nkangala, Ehlanzeni and Gert
Sibande), which are further subdivided into 17 local municipalities. 2 Grootvlei Power Station is located
in Dipaleseng Local Municipality within the Gert Sibande district and will impact the economy of the
local municipality. As such, we estimated Grootvlei Power Station’s economic impacts in terms of
economic growth and employment. These estimated impacts on the local economy, based on the
EIA results, are summarised below.

2
 Albert Luthuli, Bushbuckridge, Dipaleseng, Dr JS Moroka, Emakhazeni, Emalahleni, Goven Mbeki, Lekwa, Mbombela,
Mkhondo, Msukaligwa, Nkomazi, Pixley ke Seme, Steve Tshwete, Thaba Chweu, Thembisile Hani and Victor Khanye

 12
Grootvlei Power Station’s quality of jobs
Over and above the economic contributions resulting from Grootvlei Power Station’s investment and
day-to-day operations, Grootvlei Power Station’s activities relating to quality of jobs affect the
economy via their associated outcomes.

To examine the quality of jobs, we constructed a methodology based on OECD and UN perspectives
of job quality. The main finding from the assessment is that, across the utilities sector in
Mpumalanga, Grootvlei Power Station employees earn notably more than the industry average. This
is not surprising considering that Grootvlei Power Station employ many people with scarce skills.
These workers’ salaries reflect the scarcity of their skills and the international demand for their
services.

As South Africa looks to intensify productivity and bolster economic growth, the full range of role
players needs to draw on their strengths and synergies. With so many linkages in the economy
through its various activities, Grootvlei Power Station has an important role to play by contributing to
the country’s energy needs and thus, to economic growth more broadly.

 13
Aim, context and
overview

 14
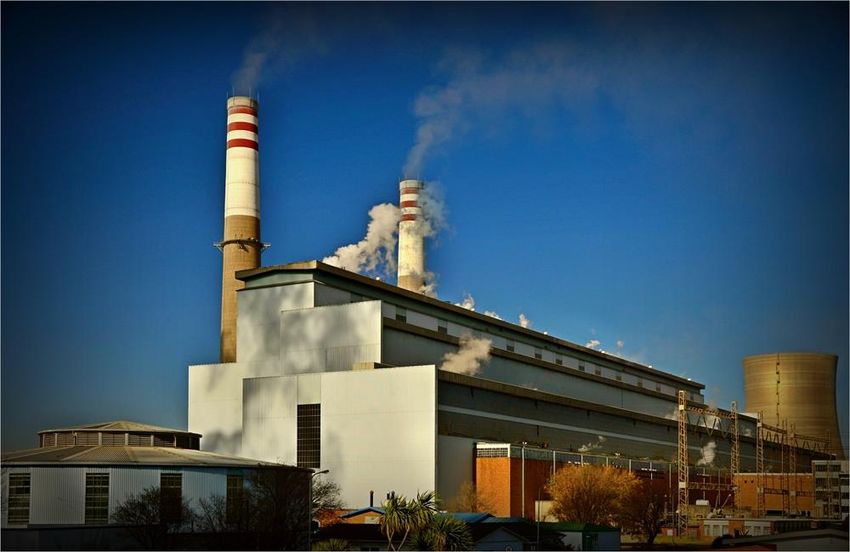
1 Aim, context and overview of report
1.1 The development of Grootvlei Power Station
Grootvlei Power Station is
situated approximately 100
km south-east of
Johannesburg and 50 km
from the town of
Heidelberg. The power
station is under the
ownership and operation of
South Africa’s major energy
provider, Eskom.

Eskom commissioned the
first unit of Grootvlei Power
Station in 1969. It is located
on flat agricultural land that
is 1 568 m above sea level.
The lack of significant water
sources lowers the power
station’s flood exposure.
Grootvlei Power Station’s
50-year power station life
ends in 2025. Eskom may
decommission the power
 Source: Eskom
station either before or after
the 50 year period, as long as it is based on economic viability, balance sheet strength and safe
operations.3

1.1.1 Prior to the development of Grootvlei Power Station

Before the development of Grootvlei Power Station, the electricity mix of South Africa included
various sources for generating electricity. In 1886, gas engines and steam turbines were used to
power up lamps on the South African streets, followed by the introduction of hydroelectric power. 4 It
was not until 1912 that discussions about the first coal power station would take place. The main
driver was the need to power the national railway line. This would start the broader process of the
commissioning of coal-powered stations.

1.1.2 After the development of Grootvlei Power Station

In 1969, the initial turbine unit 3 of Grootvlei Power Station was commissioned. It was not until 1977
that all six were commissioned and the power station was fully operational.5 In 1989, the power
station was mothballed, but it was refurbished and re-commissioned between 2005 and 2008. The
return to service of this power station has contributed to alleviating electricity demand pressures on
the national grid by providing maintenance space for other power stations.

3
 Eskom, Power Station Preservation and Decommissioning, Presentation, 10 May 2017.
4
 Eskom, Grootvlei Power Station, nd http://www.eskom.co.za/sites/heritage/Pages/early-years.aspx [Accessed on 3 May
2017]
5
 Information supplied by Grootvlei Power Station Manager

 15
Grootvlei Power Station was the first station of its size to have dry cooling and both direct (unit 5) and
indirect cooling (unit 6) systems. Unit 6 uses demineralised water as a cooling medium. The outside
plant is considered as a conventional Eskom design of that era.6

1.1.3 Achievements at Grootvlei Power Station

Grootvlei Power Station has also been recognised for its operating performance at the Eskom 2010,
2011, 2012, 2013, 2014 and 2015 Winter Awards. Grootvlei Power Station was awarded the best
power plant category and leader in power management on two occasions. In 2015, Grootvlei Power
Station’s unit 6 achieved a 91.19% Energy Availability Factor (EAF), earning the power station second
place in the Best Unit EAF category. The EAF, measures plant availability including planned
maintenance and unplanned breakdowns and energy losses not under plant management control.
It also earned third place for the Best
Station Energy Utilisation Factor (EUF) of
95.42%. The EUF, measures the usage
time for which an equipment can be used.
This is the highest percentage that
Grootvlei Power Station has achieved since
2010. All units have also achieved zero
Unplanned Automatic Grid Separations
(UAGS).7
Grootvlei Power Station has several policies
for upholding health and safety standards in
place. These are focused on ensuring
consistent quality management delivered
to consumers and the implementation of Source: Eskom
sound occupational health and safety
performances. In particular, Grootvlei Power Station possesses the following notable certifications:
 o ISO14001 certification, which is an Environmental Management System (EMS) aimed at
 measuring an improving an organisation’s environmental impact.

 o ISO 9001 certification, which is a Quality Management System (QMS) providing
 organisations with a systematic approach for meeting customer objectives by means of
 process improvement.

 o OHSAS 18001 certification, which is an Occupational Health and Safety Management
 System (OHSMS) with the purpose of measuring and improving organisational health and
 safety impacts. 8

Furthermore, between 2012 and 2017, lost-time injury rate (LTIR) showed a general downward trend.
The LTIR refers to the proportional representation of the occurrence of lost-time injuries (including
occupational diseases) over 12 months per 200 000 working hours. At Grootvlei Power Station, the
average LTIR for both Eskom employees and contractors decreased from 0.61 to 0.09 9, which means
that the number of working hours lost because of occupational injuries (including diseases) decreased
from six to one hour. Therefore, this indicates improved Occupational Health and Safety standards.

6 6
 Eskom, Grootvlei Power Station, nd
http://www.eskom.co.za/Whatweredoing/ElectricityGeneration/PowerStations/Pages/Grootvlei_Power_Station.aspx [Accessed
on 3 May 2017]
7
 Information supplied by Grootvlei Power Station Manager
8
 Phophi, S. (n.d.).ISO 17025 and SANAS guidelines for use of reference materials and PT scheme participation. South African
National Accreditation System (SANAS).
9
 Data from Grootvlei Power Station manager.

 16
Grootvlei Power Station received the National Occupational Safety Association (NOSA) Safety
System 5-star grading, for the safety measures they have in place.10 Additionally, Grootvlei Power
Station received the Best Environmental Performing and Water Consumption Power Station Award.

1.1.4 Grootvlei Power Station at present

Grootvlei Power Station currently generates 1 180 MW of electricity from its six units. This consists
of:
 o four units installed rated capacity of about 200 MW

 o two units installed rated capacity of about 190 MW

In this way, it has the potential to contribute 2.5% to the national electricity grid. In 2013, the power
station was returned to service after approximately 18 years of non-use since 1989 when it began a
preservation (mothballing) programme.
This report aims to show that Grootvlei Power Station not only continues to generate electricity for
the country, but also provides other economic benefits through productivity, employment, taxes and
household income.

1.2 Purpose of this study
Eskom contracted KPMG Services (Pty) Ltd (KPMG) to conduct a research project assessing the
economic impacts of the following five coal-fired power stations: Hendrina, Kriel, Komati, Grootvlei
and Camden, in light of the production ramp down. This document forms part of the project and
focuses on the direct, indirect and induced economic impacts of Grootvlei Power Station in South
Africa, Mpumalanga and Dipaleseng Local Municipality.

In particular, we consider Grootvlei Power Station’s capital and operational expenditure between
2014/15 and 2016/17. We report on the economic impact through GDP, employment, tax revenue
and household income of Grootvlei Power Station’s capital expenditure and operational cost.

1.3 Acknowledgements
We would like to express our appreciation for the time and cooperation provided to the KPMG project
team by the management, staff and members of Eskom and Grootvlei Power Station. In particular,
we acknowledge the assistance of Grootvlei Power Station Manager, Gersh Bonga and Finance
Manager, Mathepelo Mokoena.

1.4 Data validation, data quality and data reliance
The data used in this analysis has been received directly from the Eskom and Grootvlei Power Station
teams.

Grootvlei Power Station team provided the majority of the data including capital expenditure,
operating costs, salaries and wages, and the direct number of employees. Being most familiar with
this data, the Eskom team conducted the initial allocation of data to industries using the globally
employed Standard Industrial Classification (SIC) codes. This classification is in line with previous
projects conducted by the internal KPMG technical team including previous projects for Eskom (i.e.
an EIA for the Koeberg nuclear Power Station and a deep dive into Medupi Power Station), the South
African Petroleum Industry Association, the Independent Power Producers Project Office,
telecommunications operator Vodacom, the Gautrain Management Agency, Transnet, amongst

10
 Information supplied by Grootvlei Power Station Manager

 17
others. Through an iterative process, the data and initial allocations were then sense checked by the
KPMG team.

In this form, the KPMG team inputted the data into the EIA model to understand the economic
impacts thereof. Both project teams discussed and confirmed the assumptions used to populate the
model to ensure their relevance and appropriateness. EIAs are widely accepted, with several credible
international organisations such as the United Nation’s Food and Agriculture Organisation, the World
Bank, International Model for Policy Analysis of Agricultural Commodities and Trade, the Organisation
for Economic Co-operation and Development employing the methodology.
KPMG has compared the model’s results with the previously mentioned projects to ensure that they
align with the type and quantum of investment as well as the sector.

The relevant management and finance teams at Grootvlei Power Station as well as head office then
reviewed this classification and the figures employed. Constant engagement and communication
with the Eskom project sponsor and project manager was present throughout the process. In this
way, the data forming part of the EIA has been reconciled and validated both internally and externally
by the appropriate Eskom and KPMG teams. KPMG also has formal risk management and quality
assurance processes in place that require the engagement and risk partners’ review of the final
output. The overall process is summarised in the diagram.

As evident from the processes, the KPMG team and Eskom went through several steps to ensure
the information and data results are feasible, reliable and accurate, taking into account the limitations
with a model such as the EIA model. However, the procedures carried to date by KPMG, do not
constitute an audit, examination or review in accordance with generally accepted auditing standards
and, therefore, KPMG do not express an opinion and/or make any other form of representation
regarding the sufficiency of the procedures that KPMG performed.

 18
1.5 Layout of the report
The layout for the rest of the report consists of the following sections:

 o In Section 2 we introduce the theoretical framework of the EIA used in modelling the
 economic impact of Grootvlei Power Station’s investment and operations in Mpumalanga,
 South Africa and Dipaleseng economies.
 o In Section 3 we provide the context in which Grootvlei Power Station operates in terms of
 national and provincial economic overview, as well as an overview of the electricity industry.
 o In Section 4 we estimate the economic impact of Grootvlei Power Station’s contribution to
 the economies of Mpumalanga and the rest of South Africa. This section considers the
 capital investment of the power station.
 o In Section 5 we continue to estimate the economic impact of Grootvlei Power Station’s
 contribution to the economies of Mpumalanga and the rest of South Africa. In contrast to
 section 4, this section considers the day-to-day operations of the power station.
 o In Section 6 we provide an economic overview of Grootvlei Power Station’s local
 municipality and towns as well as the estimated economic impact that its activities has on
 them.
 o In Section 7 we consider the impact of Grootvlei Power Station’s activities as they relate to
 the quality of jobs.
 o In Section 8 we provide a conclusion summarising the main contributions of capital
 expenditure and day-to-day operations in Grootvlei Power Station, to the Mpumalang, South
 Africa and Dipaleseng economies.

 19
Modelling approach 20
2 Approach to estimating Grootvlei Power Station’s economic
 contribution
The EIA we employ for this project uses the theory of input-output analysis developed by Wassilly
Leontief as a basis. The analysis shows the interdependencies between different sectors of the
economy in a matrix format. Various countries, including South Africa, have incorporated the
structure of this input-output model into their national accounting systems. It therefore forms an
important part of measuring variables such as GDP.

In addition to studying the structure of national economies, we use input-output analysis as a tool for
economic planning. We also use it to identify economically related sector clusters and so-called
“key” or “target” sectors. These sectors are most likely to increase the internal coherence of a
specified economy. We do this by analysing the linkages between the different sectors in the
economy.

Linkages refer to forward and backward linkages that occur between consecutive steps of a
production value chain. A forward linkage exists where the products that are produced by the
electricity industry are used by particular firms or sectors as inputs or raw materials. Conversely, a
backward linkage occurs where Grootvlei Power Station uses the product of another firm or sector as
raw materials or inputs during the production process. The benefits of having an increased number of
such backward linkages within an economy is that it centres local demand for raw materials and
reduces the sector’s dependence on imports, as we rely on local suppliers for the supply of raw
materials.

When estimating the impacts of Grootvlei Power Station, this approach considers the direct, indirect
and induced impacts.

 The direct impact includes the first round of effects where increased demand for
 particular goods/services leads to increased business activity and thus a direct
 change in sectoral production. This is the impact associated with Grootvlei Power
 Station’s infrastructure investment and operational expenditure.

 The indirect impact includes the second round of effects that change the demand
 for factors of production and household income, which can be explained by the
 inter-linkages of sectors in the economy. With reference to this project, these
 impacts emanate from the increased demand from Grootvlei Power Station’s
 acquisition of goods and services from external service providers, as well as
 increased employment opportunities created on the back of this economic activity.

 The induced impact includes the multiplier effect that arises through the second
 round of spending. This is the increase in household income and the additional
 spending that arises from the change in income levels from the new employment
 opportunities created due to Grootvlei Power Station’s expenditure.

The sum of the direct, indirect and induced impacts represents the total impact.

According to Keynesian economic theory, any injection into the economy via investment capital,
government spending or the like will result in a proportional increase in overall income (measured
through GDP) at a national, provincial and local level. The basic principle of this theory is that

 21
increased spending will have carry-through or multiplier effects or impacts, which result in even
greater aggregate spending over time. The multiplier itself is an attempt to measure the size of those
carry-through effects or impacts. The multiplier takes all direct and indirect benefits from that
investment or from the change in demand into account. The size of the impact or the effect on the
economy depends on the size of the multiplier in the economy.

We use this theory as the basis for estimating the economic impact of Grootvlei Power Station’s
investment spending and operations expenditure in South Africa. We apply an extension to the input-
output matrix, the Social Accounting Matrix (SAM), in our analysis. A SAM is a presentation of the
national accounts of a country that places the focus on issues that are of special interest in a country,
e.g. an analysis of interrelationships between structural features of an economy and the distribution
of income and expenditure among household groups. We collect the required data from a number of
different sources including, inter alia, national accounts, income and expenditure surveys and
integrated economic accounts.

A SAM shows, amongst other things:

 o The structure of the costs of production and the value added, which is generated in the
 production process
 o The inter-dependencies of sectors
 o The flows of goods and services produced within the national economy
 o The flows of goods and services with the rest of the world
 o The expenditure by different household groups

The following analysis uses a 2014 SAM for the Mpumalanga as well as South Africa, built by KPMG.
We utilised the following data from a number of different sources:

 o Capital investment values and generation capacity for the periods 2014/15 – 2016/17 supplied
 by Eskom
 o Operational expenditure and income for the periods 2014/15 – 2016/17 supplied by Eskom
 o Average price per Gigawatt hours (GWh) supplied by Eskom
 o National Accounts from the South African Reserve Bank (SARB) for 2014
 o Income and expenditure surveys from StatsSA
 o Labour force surveys from StatsSA
 o GDP statistical release (P0441) from StatsSA

We used this SAM to estimate how the activities of Grootvlei Power Station in one or more parts of
the economy could affect other sectors of the economy, and how the sector investment and
operational impact are distributed in the economy. It thereby highlights the economic linkages within
the economy and has the ability to show the direct, indirect and induced effects of a given
expenditure on the following economic factors:

 GDP is a good indicator of economic growth and welfare, as it represents,
 amongst others, the remuneration of employees and gross operating surplus
 (GOS) (profits) as components of value added to the economy.

 Labour form an important part of the primary production factors needed for
 Grootvlei Power Station‘s operations. The number of people employed because
 of Grootvlei Power Station’s capital spending and operations is determined by the
 EIA.

 22
Grootvlei Power Station’s impact on public finances is its direct tax contributions.
 In addition, Grootvlei Power Station’s indirect contribution to public finance is
 included in this analysis.

 South Africa has high levels of poverty, with 45% of the population (est. 2.4
 million) living in poverty on an average income of less than R3 000 per annum. One
 of the components of the EIA is to determine whether Grootvlei Power Station’s
 investment and operations have a positive impact on poverty alleviation. We show
 how Grootvlei Power Station’s operations benefit low-income households, this is
 reflected through income that low-income households received11.

The basis of this analysis is therefore an assessment of how direct economic activity could potentially
lead to other forms of economic activity. The size of the created economic activity is measured by
means of the multiplier effect. The different rounds of the multiplier effect, from the initial spending
in a sector due to Grootvlei Power Station’s investment, through to economically active individuals
spending their salaries on goods and services (and its resultant effects), is then estimated as the
direct, indirect and induced impacts of Grootvlei Power Station’s investment and operations.

For more detail, an appendix with the methodology’s technical concepts is provided.

11
 The definition of low, medium and high-income household categories follows from the definition in the Income and
Expenditure Survey (IES) 2010/11 by StatsSA. Low-income households include households with a monthly income of up to
R9 886; medium income households include households with a monthly income of between R9 887 and R21 002; high-income
households include households with a monthly income of R21 003 and above.

 23
Economic & industry
overview

 24
3 Economic and industry overview
3.1 South African economic overview
South Africa is a middle-
income, emerging
market12 with an
abundant supply of
natural resources and
well-developed
financial, legal,
communications,
energy and transport
sectors.13 In 2016,
South Africa was
Africa’s second largest
economy in terms of
nominal GDP (US$),
with Nigeria in first
place.14

South Africa’s
macroeconomic
environment is currently
under pressure,
characterised by a lower
than expected growth
rate, high, structural
unemployment, high
inflation, a volatile and
depreciated currency.

 Source: SARB, Stats SA, IHS Global Insight

12
 World Bank, n.d. http://data.worldbank.org/country/south-africa [Accessed on 23 January 2017]
13
 World Economic Forum, The global competitiveness report, 2017. http://www3.weforum.org/docs/GCR2016-
2017/05FullReport/TheGlobalCompetitivenessReport2016-2017_FINAL.pdf [Accessed on 23 January 2017]
14
 BMI, Based on Nominal GDP (USD bn)

 25
3.1.1 Unemployment

South Africa’s official15 unemployment rate during Q4 of 2016 was a high 26.5%16, and can be
attributed to structural unemployment, i.e. a mismatch between the required and actual skills of the
labour market. In general, the energy sector employs semi- and unskilled workers17.

Continued elevated unemployment, along with deflated economic growth is likely to weigh on
consumer purchasing power and confidence.18 Weak economic growth results in lower tax revenue
yield, which in turn reduces governments’ ability to meet its obligations, particularly to the vulnerable,
without having to borrow. Furthermore, rising income taxes directly reduce the ability for households
to save and meet their living commitments. The number of households receiving at least one form of
social grant rose from 29.9% (of the population) in 2003 to 44.3% in 2010. This rose to 45.5% in
2015.19

To alleviate the burden of electricity prices on the poor, in 2001, the government announced the
provision of Free Basic Electricity (FBE) to poor households, which makes provision for 50 kWh of
electricity to poor households identified by municipalities and connected to the national grid.

3.1.2 GDP

In terms of GDP for 2016, the major sectors consisted of the financial services sector, which
contributed 20%, the manufacturing sector 12% and the mining sector 7% to GDP20. Although the
energy sector (comprising of electricity, gas and water) contributed 2%,21 electricity is a major input
of all sectors. Decreased levels of security of supply of electricity, as well as electricity inflation,
affect the productivity of all sectors with electricity as an input. The Energy Intensive Users Group
(EIUG) consists of members from the Mining and Quarrying, Manufacturing, Electricity, Gas and
Water Supply, Agriculture, Hunting, Forestry and Fishing, Transport, Storage and Communication and
Wholesale and Retail Trade. This diverse array illustrates the broad need for electricity in the South
African economy.

The World Economic Forum’s Global Competitiveness Index for 2016/17 ranks South Africa 47 th
amongst 138 measured countries. South Africa’s financial and legal institutions perform particularly
well.22 In terms of quality of electricity supply, South Africa ranks 112 th with a downward trend. As
such, an improvement of electricity supply may work to improve competiveness.

3.1.3 Inflation

On average, consumer prices exceeded the SARB’s inflation target (3 to 6%) between 2007 and
2009, returning to the target range from 2010. The Consumer Price Index (CPI) steadily increased
from 2011 and since 2014, the SARB reacted by increasing the repo rate from 5.75% in July 2015 to
7% in January 2017. Consequently, although inflationary pressures have declined, the rate hikes
affect consumers with high debt, and some default on their credit obligations. The resultant reduced
consumer spending contributes to a slowing economy.

15
 The official definition excludes discouraged work seekers.
16
 StatsSA, Quarterly Labour Survey, 2016. http://www.statssa.gov.za/publications/P0211/P02114thQuarter2016.pdf
17
 StatsSA, 2016. Quarterly employment statistics. http://www.statssa.gov.za/publications/P0277/P0277September2016.pdf
[Accessed on 23 January 2017]
18
 BMI, Emerging Markets Monitor, 2017. [Accessed on 11 February 2017]
19
 StatsSA, 2016. Facts you might not know about social grants. http://www.statssa.gov.za/?p=7756
20
 StatsSA, Gross domestic product, 2016. http://www.statssa.gov.za/publications/P0441/P04414thQuarter2016.pdf
21
 StatsSA, Gross domestic product, 2016. http://www.statssa.gov.za/publications/P0441/P04414thQuarter2016.pdf
22
 World Economic Forum, 2017. The global competitiveness report. http://www3.weforum.org/docs/GCR2016-
2017/05FullReport/TheGlobalCompetitivenessReport2016-2017_FINAL.pdf [Accessed on 23 January 2017

 26
CPI inflation in December 2016 rose to 6.8% year-on-year (y-o-y),23 which is outside of the SARB’s
inflation target. However, this has declined to 6.1% in March 2017, still slightly above the inflation
target. Inflation could still decline during the course of the year as above-normal summer rainfall could
reverse the drought conditions and provide consumer food price inflation relief. Real GDP is forecast
to fluctuate between 0.12% y-o-y in 2016 and 2.2% y-o-y in 2020. CPI inflation is expected to decline
steadily from 2017 to 2018.

One of the largest drivers of CPI is ‘Electricity and other fuels’ which experienced a 7.4% y-o-y
increase in December 2016.

A volatile ZAR/US$ exchange rate presents further inflationary pressures and raises borrowing costs.
This can raise South Africa’s net national debt to GDP and result in excess repayments relative to
GDP. This, in turn, limits resources for government investment spending and can inhibit the country’s
further development. The graph below shows that going forward, inflationary pressures will remain
along with low real GDP growth.

Source: SARB, IMF, OECD

3.1.4 Key policies

South Africa’s rapid population growth, an ageing energy infrastructure as well as an energy-intensive
socio-economic development agenda has led to increasing energy needs.24

The Integrated Resource Plan (IRP) 2010 – 2030 sets out the country’s long-term energy needs and
generating capacity requirements to secure a sustainable energy sector. In addition, the updated draft
IRP, published in November 2016, focuses on electricity provision to 2050.

The Integrated Energy Plan (IEP), which takes into account all previous policies such as the IRP, aims
to guide future energy investment, as well as to identify and recommend policy development to
shape the energy industry. The IEP is enabled though the National Energy Act and is considered to be
more descriptive than the IRP which is more prescriptive. 25

23
 SARB, 2016. Quarterly Bulletin.
https://www.resbank.co.za/Lists/News%20and%20Publications/Attachments/7588/01Full%20Quarterly%20Bulletin%20%E2
%80%93%20December%202016.pdf [Accessed on 19 January 2017
24
 Van Wyk, J. South Africa’s Nuclear Future, 2013. http://www.saiia.org.za/occasional-papers/337-south-africa-s-nuclear-
future/file [Accessed 25 January 2017]
25
 IEP, n.d. Integrated Energy Plan. http://www.energy.gov.za/files/IEP/presentations/Integrated-Energy-Plan-22-Nov-2016.pdf

 27
The National Development Plan 2030, South Africa’s blueprint for economic growth and development,
aims to eliminate poverty and reduce inequality in South Africa by 2030.

3.1.5 Other global and domestic factors

Since the global financial crisis in 2007/08, growth in South Africa has decelerated, with real GDP
growth declining from 5.5% y-o-y in 2005 to an estimated 0.4% y-o-y in 2016.26 GDP forecasts for
2017 suggest a slight increase in growth to 1.1%. 27 This overall downward trend can be attributed to
the slowdown in global economic activity, especially for South Africa’s trade partners, tied to a
number of domestic factors. These include infrastructure gaps, labour market rigidity and unrest, and
weak investment flows.28 The possibility of constrained electricity supply would further decrease
growth forecasts and economic competitiveness, suggesting consistent supply of electricty from
alternative sources.

Both local and external factors have an impact on South Africa’s economic outlook. The local factors
that could place downward pressure on South Africa’s growth prospects include constrained
electricity supply (load shedding), labour unrest accompanied by low commodity prices as well as
potential divestment from the platinum and gold mining sectors. 29 Potential platinum and gold mining
divestments would mainly arise due to rising labour costs and labour unrest, electricity shortages and
declining profitability. The threat of load shedding has been mitigated of late, which has positively
affected the economy through fewer disruptions to business activity and wastage of products, as
well as the lowered cost of generating back-up electricity incurred by households and businesses. 30

Statistics South Africa (StatsSA) reported in March 2017 that the South African economy contracted
by 0.3% quarter-on-quarter (q-o-q) during the last quarter of 2016. This was notably weaker than a
growth rate of 0.4% q-o-q seen in the preceding quarter. The negative reading is associated with a
contraction in the contribution to real gross domestic product (GDP) by the mining (-0.9% q-o-q) and
manufacturing (-0.4% q-o-q) sectors, as production in both industries declined. However, the
agricultural sector posted its first positive reading (+2.4% y-o-y) since Q1 of 2015 due to improved
summer rainfall, while the services sectors all recorded positive y-o-y growth. In turn, mining (-3.1%
y-o-y), manufacturing (-0.7% y-o-y) and utilities (-3.2% y-o-y) performed weaker.31

In the first half of 2017, a downgrade of South Africa’s sovereign rating from investment-grade “BBB-
” (with a negative outlook) to a non-investment-grade “BB+” by both S&P Global Ratings and Fitch
took place. The implication is that South African debt is now sub-investment grade. These changes
have put fiscal and growth outcomes at risk in that internal government and party divisions could
delay potential fiscal and structural reforms. A heightened sense of tension in the domestic political
climate is resulting in more attention being paid to party political matters and less to national
governance issues. As a result, the fiscal consolidation and structural reforms needed to place South
Africa on a more sustainable economic trajectory over the long term will likely be delayed. Overall,
these could affect the funding of planned infrastructure projects due to the increased associated
borrowing costs.

26
 SARB, 2016. Statement of the Monetary Policy Committee.
https://www.resbank.co.za/Lists/News%20and%20Publications/Attachments/7489/MPC%20Statement%20September%202
016.pdf [Accessed on 11 February 2017]
27
 SARB, 2017. Statement of the Monetary Policy Committee.
https://www.resbank.co.za/Lists/News%20and%20Publications/Attachments/7644/Statement%20of%20the%20Monetary%2
0Policy%20Committee%20-%2024%20January%202017.pdf [Accessed on 11 February 2017]
28
 SARB, 2015. Quarterly Bulletin Supplement. [Accessed on 12 February 2017]
29
 BMI, 2015. South Africa Country Risk Report. [Accessed on 12 February 2017]
30
 Eugenie du Preez, 2015. Economic effects of load-shedding hit home. www.mg.co.za/article/2015-08-26-economic-effects-
of-load-shedding-hit-home [Accessed on 02 February 2017]
31
 KPMG analysis

 28
Developments in the United States of America (USA) and China are key economic drivers, which
have an impact on the global economy and emerging markets such as South Africa. Continued
interest rate hikes in the USA can produce depreciatory pressure on the Rand relative to the dollar.
South Africa is dependent on foreign portfolio investment inflows and a higher USA interest rate
could lead to an outflow of portfolio investment and a depreciation of the rand. The dampened
economic activity in China translates into dampened demand for commodity exports to China and
suggests a muted outlook for emerging markets like South Africa. In 2012, China was the destination
for almost 84% of South Africa’s exports. 32 Therefore, this could negatively affect South Africa’s
economy because China is the largest importer of coal, precious metals and steel, amongst other
things.

Other global risks include Brexit and its effect on South Africa. According to Moody’s, South Africa
faces considerable exposure, all due to South Africa’s financial links with the United Kingdom (UK).
Further risks include prospects of dampened growth in the UK. 33

The subdued outlook for economic growth over the medium term could negatively affect the
economy because of rising production costs and expensive imports. In this context, a stable and
cost-efficient supply of electricity will be a necessary condition in driving growth and productivity in
the South African economy.

32
 IDC, 2014. Trade Report: Export opportunities for South Africa in other BRICS economies.
https://www.idc.co.za/images/2014/pdfs/IDC%20R&I%20publication%20%20Export%20opportunities%20for%20SA%20in%
20the%20BRICS.pdf
33
 Moody’s, Moody's: Impact of Brexit on Sub-Sahara Africa is limited, but South Africa is more exposed, 2016.
https://www.moodys.com/research/Moodys-Impact-of-Brexit-on-Sub-Sahara-Africa-is-limited--PR_351685 [Accessed on 06
February 2017]

 29
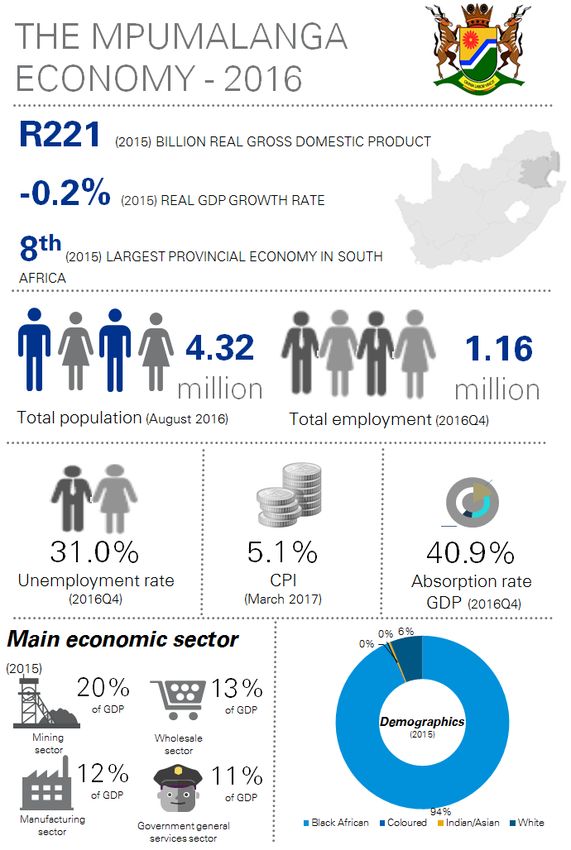
3.2 Mpumalanga economic overview
The Mpumalanga
economy has not
performed well in terms of
important macroeconomic
variables such as, growth
and unemployment, which
could be attributable to
low growth on a national
level. In this section, we
outline a number of
variables that differentiate
the Mpumalanga province
from the average South
African economy and the
significance thereof.

3.2.1 GDP

With an annual economic
growth rate of -0.2% for
the year 2015,
Mpumalanga’s
contribution to South
Africa’s GDP was the
smallest compared to the
other provinces (except
the Free State).
Mpumalanga’s GDP
amounted to R222 billion
in 2015, which contributed
7% (in constant prices) to
South Africa’s national
GDP.34 The main economic
sectors contributing to
economic growth in 2015
include the mining sector
(20%), the wholesale
sector (13%), the Source: Stats SA
manufacturing sector (12%)
and the government general services sector (11%). In March 2017, y-o-y inflation was 5.1% in
Mpumalanga.35

3.2.2 Population and Demographics

In the 2016 statistical release of the mid-year population estimates report, Mpumalanga had an
estimated population of 4.3 million people. Of this, 2.13 million are males and 2.2 million are females.

34
 StatsSa, 2016. Annual Quarter and Regional Revisions Tables Q4. http://www.statssa.gov.za/?page_id=1854&PPN=P0441
35
 StatsSA, 2017. Consumer Price Index. http://www.statssa.gov.za/publications/P0141/P0141January2017.pdf

 30
In terms of population group, the Mpumalanga population consists of 93.4% Black Africans, 6.0%
White, 0.3% Indian/Asian and 0.3% Coloured.36

3.2.3 Unemployment

Mirroring the structural challenges faced at a national level, Mpumalanga suffers from high
unemployment. The unemployment rate of 31.0% is slightly higher than the national average of
26.5% recorded in the fourth quarter of 2016. The absorption rate, which is the proportion of the
working-age population employed, was 40.9% in Mpumalanga in the fourth quarter of 2016. This is
lower than the South African absorption rate of 43.5%.

In terms of education levels, 9.5% of individuals aged 25- 64 have progressed through post-
secondary level; this is lower than the national average of 12.1%. 37 In 2016, labour was employed
mostly in the formal sector38 (715 000) followed by the informal sector 39 (251 000), private
households (101 000) and the agriculture sector (88 000).40 Thus, in reducing the unemployment rate
both provincially and nationally, it is important to increase the number of educated and skilled labour,
especially in the formal sector where there is generally an increasing demand for skilled labour.

36
 StatsSA, 2015. General Household Survey. http://www.statssa.gov.za/publications/P0318/P03182015.pdf [Accessed on 13
February 2017]
37
 StatsSA, 2016. Education Series Volume III: Educational Enrolment and Achievement.
http://www.statssa.gov.za/publications/Report%2092-01-03/Report%2092-01-032016.pdf [Accessed on 15 February 2017]
38
 Formal sector definition: The formal sector has the following two components:
 (i) Employers and own-account workers registered for VAT or income tax.
 (ii) Employees paying income tax and those not paying tax but working in firms with five or more workers.
39
 Informal sector: The informal sector has the following two components:
 (i) Employees working in establishments that employ fewer than five employees, who do not deduct income tax
 from their salaries/wages; and
 (ii) Employers, own-account workers and persons helping unpaid in their household business who are not
 registered for either income tax or value-added tax.
40
 StatsSA, 2016. Quarterly Labour Force Survey, Quarter 4 2016.
http://www.statssa.gov.za/publications/P0211/P02114thQuarter2016.pdf

 31
3.3 Electricity industry overview
In 2008, the Electricity, Gas
and Water sector contributed
2% to South Africa’s GDP and
by 2016 this increased to
2.4% (R64 billion).41

Electricity is crucial for the
functioning of the overall
economy, particularly for
energy-intensive sectors like
mining and manufacturing.42

Annual producer price
inflation (PPI) for electricity
and water was 10.8% in
March 2017.43 This was
higher than the average PPI
figure of 5.2% for final
manufactured goods in March
2017.44 These price increases
result in future inflation for
prices of consumer goods and
subsequently discourage
consumers from saving and
reduce their purchasing
power.

The main source for South
Africa’s electricity generation
in 2016 was coal, followed by
nuclear, diesel and gas, pump
storage, hydro- and wind
 Source: Eskom, NERSA, StatsSA
sources.45

Recently, South Africa experienced energy constraints again, through loadshedding, that were an
impediment to economic growth in 2015. Eskom’s large power projects such as the Kusile and
Medupi power plants, which have been under construction for about 10 years, 46 will add
approximately 10 000 megawatts (MW) of capacity to the national grid. 47 These projects could
potentially alleviate the electricity supply constraints in the country.

41
 StatsSA, 2016. Gross domestic product. http://www.statssa.gov.za/publications/P0441/P04413rdQuarter2016.pdf [Accessed
on 23 January 2017]
42
 Laura M. Platchkov and Michael G. Pollitt, The Economics of Energy (and Electricity) Demand, 2011.
http://www.econ.cam.ac.uk/dae/repec/cam/pdf/cwpe1137.pdf [Accessed on 26 January 2017]
43
 StatsSA, Producer Price Index, 2017. http://www.statssa.gov.za/publications/P01421/P01421January2017.pdf
44
 StatsSA, Producer Price Index, 2017. http://www.statssa.gov.za/publications/P01421/P01421January2017.pdf
45
 Eskom, 2016. Integrated report 2016. http://www.eskom.co.za/IR2016/Documents/Eskom_integrated_report_2016.pdf
[Accessed on 09 April 2017]
46
 Yelland, C., Medupi, Kusile, 2016. The massive cost/time overrun.: https://www.dailymaverick.co.za/article/2016-07-07-
medupi-kusile-and-the-massive-costtime-overrun/#.WMFN61V97IU]
47
 South African Government, Energy Challenge, 2015. http://www.gov.za/issues/energy-challenge [Accessed on 24 January
2017]

 32
Furthermore, South Africa’s
reliance on coal means that
the country is a major emitter
of greenhouse gases (GHG).
In response, the country
indicated its intention to opt
for ‘green’ energy sources to
reduce emissions.48

South Africa is the fifth largest
coal producer in the world,
producing an average of 224
million tones of marketable
coal annually.49

Eskom has 14 coal-fired
power stations in South
Africa, of which 11 are located
primarily in the Mpumalanga
province. Currently, South
Africa has 46 417 MW of
installed capacity, with 30 066
MW (65%) of this capacity
being installed in
Mpumalanga.

In 2016, 90.7% of households
in Mpumalanga had electricity Source: Eskom, NERSA, StatsSA
connections. This is higher than the national average of 89.5%, which is an indication that Eskom and
municipalities, together with the Department of Energy (DoE) have made considerable progress
towards accelerating the government’s objective of universal access to electricity by 2025.

48
 Eskom, 2012. RSA Briefing to TWG-LWR. http://www.iaea.org/NuclearPower/Downloads/Technology/meetings/2012-06-18-
20-TWG-LWR-HWR/5.SouthAfrica-LWR.pdf. [Accessed on 21 February 2017]
49
 Eskom. Coal Power. http://www.eskom.co.za/AboutElectricity/ElectricityTechnologies/Pages/Coal_Power.aspx

 33
You can also read