Economic Impacts of Submarine Fiber Optic Cables and Broadband Connectivity in Indonesia
←
→
Page content transcription
If your browser does not render page correctly, please read the page content below

Economic Impacts of Submarine
Fiber Optic Cables and Broadband
Connectivity in Indonesia
Working Paper 0214363.202.8

December 2020

Prepared by
Alan C. O’Connor
Benjamin Anderson
Alice Olive Brower
Sara E. Lawrence

                                                                                           Sponsored by
RTI International
3040 E. Cornwallis Road
Research  Triangle Park, NC, USA
Economic Impacts of Submarine Fiber Optic Cables and Broadband Connectivity in Indonesia        | Page 1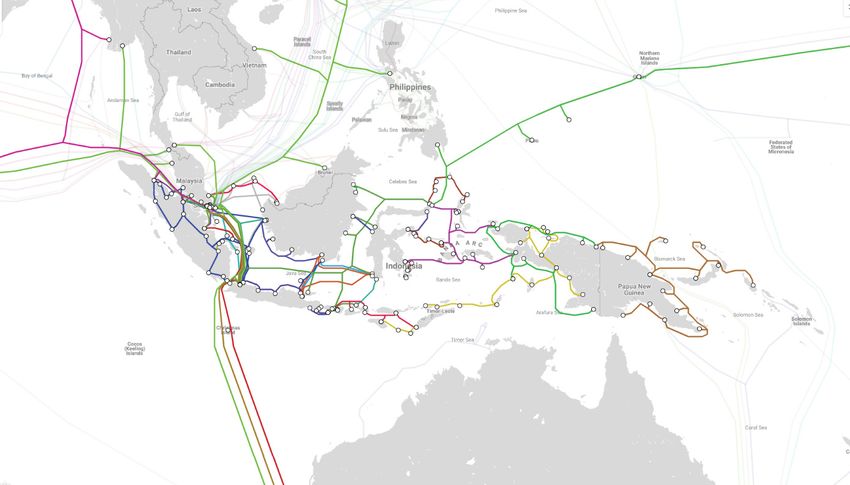
Economic Impacts of Submarine Fiber Optic
Cables and Broadband Connectivity in Indonesia
HOW DO SUBSEA CABLES GENERATE ECONOMIC IMPACT?
Subsea cables are the global backbone of the Internet, connecting people, businesses, and economies around the world.
They connect us to the cloud, deliver streaming video, and increase efficiency and productivity. Subsea cables’ importance
is all the more apparent during the COVID-19 pandemic when many of us have switched to working from home, remote
learning, and online gaming and entertainment.
We studied the economic impacts from subsea cables that arrived in Indonesia in 2012 to understand how they changed
the economy. The results show the large impact subsea cables have had.
Consumers
Subsea
Internet speed Economic Impacts
cables arrive
increases
• Jobs • GDP
Existing consumers enjoy The last wave of subsea
better speeds, increasing $ cable landings led to
their consumption of
Price per data digital content, products,
unit decreases and services.
New firms and
$
startups emerge to
serve consumers
and businesses
(e.g., GoJek, 5.5%
Bukalapak)
Some consumers decide increase in employment in
to subscribe to services the services sector by 2015
for the first time
2.95
2.81
Before major subsea After
2.67
2.55
Business cable arrivals
2.43
2.30
2.17
2.04
2.80
GDP (Trillions of 2011 USD PPP)
2.66
2.56
2.44
2.32
2.30
2.17
2.04
Increased internet speed,
quality and reliability
2010
2011
2012
2013
2014
2015
2016
makes doing business Growth in 2017
easier productivity,
efficiency, and GDP in the absence of connectivity improvements
from new subsea cables
revenue for firms
$ Easier transition to
remote work
GDP impact catalyzed by improved connectivity
from subsea cables
Network is
Increased
data traffic More businesses use the 5.4%
cloud and e-commerce
built out competition increase in GDP per
for the first time
capita by 2017†
†
Subsea cables landing in 2012 catalyzed a 5.4% increase in GDP by 2017. This chart presents values at purchasing power parity (PPP), which accounts for changes in living standards over time. Doing so
presents the most accurate picture of the impact that the connectivity improvement from subsea cables makes on people’s lives. At PPP, in 2017 GDP was $2.95 trillion instead of $2.80 trillion.
For reference, in nominal terms (without any adjustments to measure living standards across time and countries), Indonesia’s GDP was $1 trillion in 2017.
Alan C. O’Connor, Senior Director, Center for Applied Economics & Strategy | oconnor@rti.org, +1.919.541.8841
Recommended Citation: O’Connor, Alan C., B. Anderson, A. Brower , and S.E. Lawrence. 2020, December. Economic Impacts of Submarine Fiber Optic Cables and
Broadband Connectivity in Indonesia. Working Paper 0214363.202.8. Research Triangle Park, NC, USA: RTI International. © RTI International, 2020
Economic Impacts of Submarine Fiber Optic Cables and Broadband Connectivity in Indonesia | Page 2
Table of Contents

          SECTION                                                                                      PAGE

          1.        OVERVIEW                                                                               3

          2.        INDONESIA COUNTRY PROFILE                                                              4

          3.        ANALYSIS APPROACH                                                                      6
                    3.1       Econometric Analyses                                                         6
          		                  3.1.1      Synthetic Control (SC)                                            6
          		                  3.1.2      Simultaneous Equations Model (SEM)                                7
                    3.2       Thematic Analysis of Interviews with Key Stakeholders	                       8

          4.        ECONOMIC IMPACTS OF SUBSEA CABLE LANDINGS                                              9
                    4.1       Impacts to Date		                                                            9
                    4.2       Forward-Looking Implications of Econometric Analyses		                      11

          5.        STAKEHOLDER PERSPECTIVES ON CONNECTIVITY                                              12
                    5.1       Network Expansion                                                           12
          		                  5.1.1      The Palapa Ring                                                  12
          		5.1.2                        Mobile Wireless                                                  13
          		5.1.3                        Fixed Broadband		                                                14
          		                  5.1.4      Further Expansion                                                14
                    5.2       Economic Development                                                        14

          6.        CONCLUSION15

Recommended Citation: O’Connor, Alan C., B. Anderson, A. Brower, and S. Lawrence. 2020, December. Economic Impacts
of Submarine Fiber Optic Cables and Broadband Connectivity in Indonesia. Working Paper 0214363.202.8. Research
Triangle Park, NC, USA: RTI International.

Economic Impacts of Submarine Fiber Optic Cables and Broadband Connectivity in Indonesia                             | Page 3
1. Overview
This study explores the economic impact of the internet areas. In less populated, harder-to-reach areas connectivity is
connectivity delivered by submarine fiber optic cables inconsistent. Network infrastructure economics and geogra-
(“subsea cables”) on Indonesia. Subsea cables are the global phy inhibit network expansion and access. The government
backbone of the internet, connecting people, businesses, and has taken significant steps to address this challenge, partic-
economies around the world (Figure 1).1,2 ularly with the Palapa Ring, a new domestic subsea cable
system.
Our analysis quantifies the impact that improvements in
connectivity from subsea cables have had on the econ- We found that subsea cables have led to a 5.4% increase in
omy overall and on people’s livelihoods. The importance GDP per capita between 2012 and 2017, after controlling for
of connectivity to economic growth is well-established, such things as technology trends, population characteristics,
but rigorous studies have not been conducted for many economic trends, and other important factors (Table 1). There
individual countries.3,4,5 This analysis is the first time a coun- was a 5.5% increase in services employment over the same
try-level impact study has been prepared for Indonesia using period, equivalent to about 4.3 million jobs.
advanced econometric analysis methods paired with insights
Looking back over 1997 to 2017, we found that each 10%
from Indonesian experts in broadband connectivity.
increase in Indonesia’s international data consumption per
Known for its vibrant ecosystem of gig economy apps user led to a 0.41% increase in GDP per capita.
like GoJek and Bukalapak, Indonesia has leveraged rapid
Taken together, our analysis results signal the important role
improvements in internet connectivity into economic
subsea cables play in Indonesia’s economic development.
growth. The context changes, however, outside of urban
Table 1. K
ey Takeaways: The Economic Impact of Subsea Cables on Indonesia
INDICATOR TIME PERIOD OUTCOME
Economic growth 2012—2017 5.4% increase in gross domestic product (GDP) per capita
5.5% increase in service-sector employment over 6 years
Employment 2012—2017
This is an increase of 4.3 million service-sector jobs
0.41% increase in GDP per capita for every 10% increase in
international bandwidth consumption per user
Long-term economic growth 1997—2017 Without any change in international data connectivity, the compound
annual growth rate (CAGR) for GDP per capital would have been 1.32%
instead of the actual rate of 2.70%
Source: Authors’ estimates.
1 C lark, K. 2019. Submarine Telecoms Industry Report, 7th Edition. Submarine Telecoms Forum.
2 Brake, D. 2019. Submarine Cables: Critical Infrastructure for Global Communications. Information and Technology Foundation.
3 Hjort, J, Poulsen, J. 2019. The Arrival of Fast Internet and Employment in Africa. American Economic Review, 109(3): 1032-1079.
4 Minges, M. 2015. Exploring the Relationship between Broadband and Economic Growth. WDR 2016 Background Paper; World Bank, Washington, DC.
5 Khalil, M., Dongier, P., & Zhen-Wei Qiang, C. 2009. Information and Communications for Development: Extending Reach and Increasing Impact. World Bank.
Economic Impacts of Submarine Fiber Optic Cables and Broadband Connectivity in Indonesia | Page 4Figure 1. R
ole of Subsea Cables in Internet Connectivity
ROLE OF SUBSEA CABLES IN CONNECTIVITY
Infrastructure investments and policy
decisions affect the extent to which
countries are able to benefit from
Once international bandwidth lands
connectivity.
from the sea, data moves through
terrestrial networks and points of
Subsea cables are part of a presence to reach a firm or household.
Mobile network
complex internet delivery system. Fixed line to the
firm or household
Points of presence
Landing station
International bandwidth
via submarine cable
Terrestrial Fiber
2. Indonesia Country Profile
An archipelago nation of more than 17,000 islands (6,000 agriculture, forestry, and fishing; oil, gas, and mining; and
inhabited), Indonesia is the largest nation in Southeast Asia manufacturing. About 80% of the formal economy is concen-
(Table 2). More than half of its 270 million people live on the trated on the islands of Java and Sumatra.
island of Java, which is home to four of Indonesia’s five largest
Another way to look at Indonesia’s GDP is to take into consid-
cities, including Jakarta, one of the world’s largest metro-
eration purchasing power parity (PPP). PPP accounts for
politan areas with more than 30 million residents. Sumatra,
differing price levels for comparable expenditure categories
Sulawesi, Kalimantan, Papua , and Bali round out the top six
between countries. By applying PPP one can assess, both
most-populated islands. In 2019, the government announced
between countries and over time, real year-on-year changes
that a new national capital is planned for Kalimantan. The
and economic trends based on actual living standards.
objective is to reduce pressure on Jakarta while also situating
Through the lens of PPP, Indonesia’s economy is the equiva-
the capital more centrally and balancing development across
lent of $3 trillion (2011 USD)—ranking 7th worldwide—with
the islands.
a per capita GDP of $11,173. Later, we will use the PPP
Indonesia has the world’s 16th largest economy (in nominal method of quantifying the Indonesian economy to generate
terms). Its gross domestic product (GDP)—the most common our results, enabling impacts to be interpreted directly as
measure of the value of all goods and services produced by improvements in living standards relative to different points
a country—was estimated to be about $1.1 trillion in 2019. in the past.
GDP per capita was $4,136. Key economic sectors include
Economic Impacts of Submarine Fiber Optic Cables and Broadband Connectivity in Indonesia | Page 5Table 2. K
ey Indicators for Indonesia’s Population and Economy
INDICATOR VALUE YEAR SOURCE
Population 270.6 million people 2019 The World Bank
Literacy Rate 96% of population aged 15+ 2018 The World Bank
Primary education completion rate 78% of population aged 25+ 2018 The World Bank
5% of population below WB poverty line
Poverty rate 2018 The World Bank
of 1.90 USD PPP/day
GDP, nominal USD
• Total 1.1 trillion USD 2019 The World Bank
• Per capita 4,136 USD
GDP, purchasing power parity
• Total 2,950 billion (2011 USD PPP) 2017 Penn World Table
• Per capita 11,173 (2011 USD PPP)
GDP, rupiah 15.8 quadrillion 2019 Penn World Table
GDP growth rate 5% 2018 The World Bank
Unemployment 4.3% of labor force 2018 The World Bank
Given its geography, it is not surprising that many subsea quantified are for the international connectivity associ-
cables traverse Indonesia’s waters and connect its islands ated with subsea cables and not domestic connectivity.
(Figure 2). Table 3 lists key cables and their landing sites. Increasingly, nationally hosted internet exchanges, local
content delivery networks, and data centers are bringing data
Note that because terrestrial fiber and wireless networks
resources stored abroad on shore. However, international
connect users to subsea cables’ landing stations, we include
connectivity remains critical to access the global Internet.
them in the analysis. We emphasize that the impacts
Figure 2.
Map of Indonesia’s Subsea
Cables
Source: Telegeography.
Economic Impacts of Submarine Fiber Optic Cables and Broadband Connectivity in Indonesia | Page 6Table 3. Recent
Important International Subsea Cable Landings for Indonesia
CABLE DESIGN CAPACITY (TBPS) LOCAL LANDING STATION(S) READY FOR SERVICE YEAR
Australia-Singapore Cable 60 Anyer 2018
Bali, Balikpapan, Batam,
Indonesia Global Gateway (IGG) System 32 Dumai, Jakarta, Madura, 2018
Makassar, Manado, Tarakan
SEA Cable Exchange (SEAX-1) 225 Batam 2018
SEA-US 20 Kauditan 2017
SeaMeWe-5 36 Dumai, Medan 2016
Batam, Batu Prahu, Jakarta,
Jakarta-Bangka-Bintan-Batam-Singapore (B3JS) 1.4 2012
Pesaren
Sources: Telegeography’s Submarine Cable Map & STF Analytics’ Submarine Cable Almanac.
3. Analysis Approach
Our study paired rigorous statistical analysis methods 3.1.1 Synthetic Control (SC)
with interviews with more than 25 executives and market
SC estimates the impact of subsea cables on economic
analysts in the Indonesian Internet ecosystem. This approach
outcomes by comparing Indonesia’s actual outcomes after
permitted us to acquire comprehensive insights into what
subsea cable arrivals to a model of Indonesia in which
the quantitative analysis results tell us. A detailed technical
the cables did not arrive but for which all other prevailing
addendum accompanies this report.
economic trends continued. This latter version of Indonesia is
referred to as a synthetic counterfactual.
3.1 ECONOMETRIC ANALYSES The synthetic counterfactual is a weighted combination of
We employed two complementary econometric methods similar countries which did not receive subsea cable land-
to quantify the impacts of subsea cable landings: synthetic ings during the time period of interest and that is calibrated
control and simultaneous equations model. Of all available to Indonesia’s pre-cable arrival state. We use a weighted
analysis methods, these two offer the most robust, reliable, combination of multiple countries because the resulting
and accurate way of estimating the impacts caused by subsea counterfactual is more like Indonesia across a variety of
cable landings in Indonesia. Both methods derive from important and relevant dimensions than any single compar-
cutting-edge statistical techniques6,7,8 and have been used to ison country alone. Key dimensions include GDP per capita,
investigate similar issues.9,10 labor composition by industry sector, and the proportion of
people living in urban areas, for example.
6 I mbens, G. W., & Wooldridge, J. M. 2009. Recent developments in the econometrics of program evaluation. Journal of Economic Literature, 47(1), 5-86.
7 Athey, S., Imbens, G. W. 2017. The State of Applied Econometrics: Causality and Policy Evaluation. Journal of Economic Perspectives, 31(2): 3-32.
8 Baum-Snow, N, Ferreira, F. 2017. Causal Inference in Urban and Regional Economics. National Bureau of Economic Research (NBER) Working Paper Series. Working Paper 20535.
9 Abadie, A., Diamond, A., Hainmueller, J. 2010. Synthetic control methods for comparative case studies: Estimating the effect of California’s tobacco control program. Journal of the
American Statistical Association, 105.490 (2010): 493-505.
10 Roller, L.H., Waverman, L. Telecommunications infrastructure and economic development: A simultaneous approach. American Economic Review, 91.4 (2001): 909-923.
Economic Impacts of Submarine Fiber Optic Cables and Broadband Connectivity in Indonesia | Page 7The construction of the synthetic counterfactual is has a positive effect on GDP per capita, if broadband speed
completely computationally driven and optimizes the fit enables the formation of new start-ups and/or the growth of
of the counterfactual based on the countries’ actual data. some existing businesses. Meanwhile, or alternatively, it could
Importantly, the counterfactual can be tested for its robust- be true that GDP per capita has a positive effect on interna-
ness and reliability, which helps assess confidence in each set tional bandwidth because more resources are potentially
of results. See Figure 3. available to invest in subsea cables and other broadband
infrastructure. Moreover, it could be that neither of these vari-
Figure 3. S
ynthetic Control Technique for Analysis of Subsea Cables ables cause change in the other and that instead the two vary
together because both are driven by other distinct variables.
Subsea cable landing(s)
These complexities are illustrated in Figure 4.
Real Country
Impact Figure 4. S
imultaneous Equations Model Schema for Analysis of
of subsea Subsea Cables
cables
Synthetic
Counterfactual
Outcome
X3 GDP X2
X3
X4
Before Subsea Cable(s) After Subsea Cable(s) Investment
Broadband
in Broadband
Time Infrastructure
Penetration or
Quality
Price or
Data for the analysis are sourced from the Penn World Table
Revenue
(PWT)11 and the World Bank’s World Development Indicators
(WDI).12 These sources acquire national statistics from
officially-recognized sources and standardize them using Stock of
well-documented methodologies. Importantly, the rigor, Broadband
Infrastructure
standardization, and quality control used by PWT and WDI
enable cross-country comparisons over time. This means
that we have a high degree of confidence in the ability (and
accuracy) of SC to match on a variety of important macroeco- Jointly estimating the system of equations representing the
nomic characteristics and outcomes. aggregate economy and the dynamics of supply and demand
within the broadband market enables us to more accurately
3.1.2 Simultaneous Equations Model (SEM) approximate the causal impact of subsea cables on GDP per
capita. The SEM approach accounts for the mutually rein-
SEM estimates the effect of subsea cables on GDP per capita
forcing relationships (potential feedback loops arising from
over a long period of time by modeling national economic
reverse causality) as well as other key explanatory factors,
output and the market for broadband as a system of simulta-
thus isolating the effects of a) increases in economic growth
neous equations. International bandwidth is highly correlated
attributable to international bandwidth, and b) increases in
with economic growth (GDP per capita),13 but this alone does
the demand and supply of international bandwidth attribut-
not reveal anything about the causal relationships between
able to increases in economic growth.
the two. It could be the case that international bandwidth
11 Feenstra, R. C., Inklaar, R., Timmer, M. 2015. The Next Generation of the Penn World Table. American Economic Review, 105(10), 3150-3182.
12 World Development Indicators, The World Bank Group, 2019, https://databank.worldbank.org/source/world-development-indicators.
13 The Economist Intelligence Unit. Who dominates global data flows? Retrieved from https://perspectives.eiu.com/an-analysis-of-underwater-internet-cables
Economic Impacts of Submarine Fiber Optic Cables and Broadband Connectivity in Indonesia | Page 8Table 4. S
imilarities and Differences of Econometric Analysis Strategies
SIMULTANEOUS
IMPACT DIMENSION SYNTHETIC CONTROL
EQUATIONS MODEL
subsea cables (explicitly) �
Treatment
international bandwidth (implicitly related to subsea cables) �
discrete point-in-time impacts �
Temporality
average impact over the long run �
employment �
Outcome
economic growth � �
Geography spatially-inspecific impacts (at the country-level) � �
Data aggregation macroeconomic data on countries (national statistics) � �
The country-level data we used for SEM analysis come from app and service developers, data center providers), and trade
the PWT, the WDI, and the International Telecommunication and business associations. Interview topics included current
Union’s (ITU) World Telecommunication/ICT Indicators connectivity trends and challenges (e.g., network expansion,
Database.14 These datasets are standardized to enable valid latency, affordability), public-sector priorities driving network
comparisons over time and thus are appropriate for use as expansion, role of subsea cables in the broader landscape
time series variables in SEM. of connectivity and internet quality, role of connectivity in
economic development, and future trends and issues. So
The estimated effects using SC and SEM provide complemen-
that interviewees could be open and candid, we advised
tary insights due to their similarities and differences across
that participation would be confidential, that we would not
different dimensions, as described in Table 4. By applying two
attribute responses to individuals, and that only the synthe-
econometric methods our work sheds insight into various
sized remarks of all interviewees would be presented in our
aspects of economic impact caused by subsea cable landings.
reports.
3.2 THEMATIC ANALYSIS OF INTERVIEWS
WITH KEY STAKEHOLDERS
We interviewed more than 25 Indonesian broadband
connectivity experts with telecommunications firms, govern-
ment agencies, the subsea cable industry, other related
sectors (e.g., internet service providers, content providers,
14 World Telecommunication/ICT Indicators Database, 22nd Edition, International Telecommunication Union, 2018, https://www.itu.int/en/ITU-D/Statistics/Pages/publications/wtid.aspx.
Economic Impacts of Submarine Fiber Optic Cables and Broadband Connectivity in Indonesia | Page 94. Economic Impacts of Subsea Cable Landings
Subsea cables have caused notable economic growth in
Figure 5. E
stimated Effect of Subsea Cables on GDP per Capita,
Indonesia, over both the short and the long term. Over the 2012 to 2017
short term, they have caused a 5.4% increase in GDP per
capita between 2012 and 2017. They also increased the
number of jobs in the service sector by 4.3 million. Over the
long-term, we found that for every 10% increase in interna-
tional bandwidth consumption per user, there was a 0.41%
increase in GDP per capita.
4.1 I MPACTS TO DATE
Figure 5 compares actual, observed GDP growth in Indonesia
from 2010 to 2017 with what would have happened had
subsea cables had not arrived. We focused specifically on
cable landings between 2012 and 2016 (e.g, Jakarta-Bangka-
Bintan-Batam-Singapore and SeaMeWe-5).15 Studying the
most recent landings allows us to better understand the
incremental impact cable landings have.
In 2017, 5 years after the first of these arrivals, Indonesia’s
actual GDP per capita was about $568 greater (5.4% greater)
than it otherwise would have been. In other words, without
these cables, we estimate that Indonesia’s GDP per capita in
2017 would have been $10,604 instead of $11,173 as shown
in Table 5.16 The impact was greatest within the first year of labor market, showing a greater shift towards services.
arrival, with additional impacts in subsequent years smaller Figure 7 shows Indonesia’s actual services employment as
but still positive. a percentage of its population compared to the synthetic
counterfactual for 2010 to 2018. Clear divergence appears
Over a 20-year period, we found a large positive effect of beginning in 2015, indicating a somewhat lagged effect from
increases in international bandwidth per user consumption the first cable (e.g. Jakarta-Bangka-Bintan-Batam-Singapore)
(IBWPU) on GDP per capita. Our estimates suggest that each and/or greater effects from later cables (e.g. SeaMeWe-5).
10% increase in Indonesia’s IBWPU leads to a 0.41% increase
in GDP per capita.17 See Table 6. Illustratively, the impact of In 2018, 6 years after the first of the subsea cable arrivals
IBWPU over the past 20 years amounts to an increase in GDP within recent years, Indonesia’s actual share of the population
per capita of about $2,065. employed in services was 30.5%, which is 5.5% greater than
the synthetic counterfactual of 28.9%. In other words, with-
Figure 6 depicts Indonesia’s actual GDP per capita growth out these subsea cables, we estimate that Indonesia’s services
between 1997 and 2017. The compound annual growth rate employment in 2018 would have been 28.9% rather than the
(CAGR) was about 2.70% over this period. In the absence of actual 30.5%. This difference amounts to approximately 4.3
any change in IBWPU, we estimate that Indonesia’s GDP per million service sector jobs. The cumulative effect grows from
capita would have grown only at roughly a CAGR of 1.32%. 2015 to 2018, with the largest incremental impact occurring
Subsea cables also appear to have impacts on the national in 2016.
15 We focused on the cable arrivals in this timespan for SC our analysis because they contributed most substantially to a discrete increase in international bandwidth, and importantly,
there were no major subsea cable arrivals during the few years prior to this set of arrivals.
16 All U.S. dollar values are in 2011 USD PPP. All Indonesian rupiah values are in 2011 rupiah.
17 These estimates describe the average effect of past changes in IBWPU in Indonesia on GDP per capita but are not necessarily predictions of the effects of future changes, which will
be determined in part by future circumstances of the country.
Economic Impacts of Submarine Fiber Optic Cables and Broadband Connectivity in Indonesia | Page 10Table 5. I mpact of Subsea Cables on GDP per Capita
2012 2017
Actual 9,238 11,173
2011 USD PPP Counterfactual — 10,604
Difference — 568
Actual 33,364,978 40,352,944
2011 Indonesia Rupiah Counterfactual — 38,300,135
Difference — 2,052,809
Figure 6. L
ong-Term Trends in Actual and Counterfactual GDP per Figure 7. E
stimated Effect of Subsea cables on Employment in
Capita and International Bandwidth Consumption per Services, Indonesia
User, Indonesia
Of these additional service sector jobs, some are likely to have
Table 6. L
ong-Term Impact of International Bandwidth per User on
GDP per Capita, Indonesia been created in financial services and insurance, information
and communication, and company services. These indus-
Years: 1997 – 2017 tries comprised 4%, 8%, and 7% of jobs in the services sector
For every 10% increase in in 2018, respectively, according to the Statistics Indonesia.
0.41%
IBWPU, there has been a Range of Estimate
Other large industries in the services sector that likely bene-
increase in GDP per capita 0.30%‡ – 0.52%† fited include educational services and health services and
social activities. Respectively, these industries comprised 26%
and 8% of service sector jobs in 2018.
‡ p-value = 0.951 † p-value = 0.174
Economic Impacts of Submarine Fiber Optic Cables and Broadband Connectivity in Indonesia | Page 11The findings lead us to conclude that subsea cables have 4.2 FORWARD-LOOKING IMPLICATIONS OF
caused productivity increases in Indonesia. Impacts on ECONOMETRIC ANALYSES
GDP per capita found using both analysis approaches are
complemented by evidence from interviews (described later) Numerous factors play a role in determining if future subsea
indicating increases in the proportion of formal employment cable landings will have similar impacts to those discussed
accounted for by services. We did not find a discernable above. Important factors include improvements to technol-
increase in overall employment. Thus, relative to the number ogy, Indonesia’s future terrestrial broadband infrastructure,
of new formal jobs, there is much greater economic output as changes in the skills of the labor force, and policy changes.
a result of subsea cable arrivals. The evidence of impact on overall growth in Indonesia from
Figure 8 illustrates cables’ overall impact on Indonesia’s GDP. subsea cables is overwhelmingly positive so far; however,
Better connectivity stimulated the economy, causing it to effects likely vary for specific demographics of the popu-
grow more quickly than it otherwise would have. By 2017, the lation and types of firms. As more of Indonesia’s economy
annual impact on GDP was equivalent to about $150 billion shifts towards industries leveraging connectivity, highly
(at PPP). educated and skilled segments of the labor force may be
relatively better poised to take advantage of the technol-
Altogether, the evidence suggests that subsea cables have ogy. This, in turn, could contribute to widened disparities in
driven impressive growth in GDP per capita mostly by socioeconomic outcomes across certain demographics if left
facilitating modernization and enhanced productivity in the unaddressed. Policies that expand geographic access and
Indonesian economy. It is possible that the same economic improve access through greater competition while maintain-
dynamism enabled by subsea cables that has driven growth ing broadband quality would likely further amplify cables’
may also help to create and preserve jobs in the long run. impact on overall growth while mitigating the emergence of
inequities.
Figure 8. E
stimated Impact of Subsea Cables’ Connectivity on Indonesia’s GDP at PPP
3 Before major 2.95
subsea cable 2.81
After
arrivals 2.67
2.55
2.43 2.80
2.30 2.66
2.17 2.56
GDP (Trillions of 2011 USD PPP)
2.04 2.44
2 2.30 2.32
2.17
2.04
1
0
2010 2011 2012 2013 2014 2015 2016 2017
Subsea cables landing in 2012 catalyzed a 5.4% increase in GDP by 2017. This chart presents values
GDP in the absence of connectivity improvements from at purchasing power parity (PPP), which accounts for changes in living standards over time. Doing
new subsea cables so presents the most accurate picture of the impact that the connectivity improvement from subsea
GDP impact catalyzed by improved connectivity from cables makes on people’s lives. At PPP, in 2017 GDP was $2.95 trillion instead of $2.80 trillion.
subsea cables For reference, in nominal terms (without any adjustments to measure living standards across time and
countries), Indonesia’s GDP was $1 trillion in 2017.
Economic Impacts of Submarine Fiber Optic Cables and Broadband Connectivity in Indonesia | Page 125. Stakeholder Perspectives on Connectivity
Interviewees concurred with our quantitative analysis To boost access, the government built the Palapa Ring,
results, emphasizing how gains in connectivity allowed for more than 12,000 km of subsea cables that bridge gaps in
entrepreneurs and start-ups to leverage apps to overcome private-sector infrastructure and facilitate connectivity.
the logistical challenges of serving an archipelago nation. BAKTI, the government agency, is moving to ensure the Ring
According to one executive, demand is expected to grow by 5 works for the last mile. It has a mandate to develop infrastruc-
times by 2025. For key indicators, see Table 6. ture for the universal service obligation. According to one
long-time industry executive some 10% of Indonesians—28
The strength of connectivity is greatest on the major islands
million people—are estimated to have poor or no internet
of Sumatra, Java, and Bali and in urban areas. In other locales,
availability.
connectivity can be inconsistent. In response, the Indonesian
government intervened with the construction of the Palapa To address this, BAKTI launched a tender for a second project:
Ring, a 12,000 km fiber ring connecting islands, and other a multifunction high-throughput satellite that can provide
projects to boost access. 150 Gbps of capacity via 116 spot beams to some 150,000
public facilities. BAKTI considered other options, but realized
it would take years to build terrestrial networks, so they are
pursuing a dual track process, where they will put out tenders
5.1 NETWORK EXPANSION for fiber connections but rely on satellites until the connec-
tions are ready, assumed to be about a decade. “Gradually
5.1.1 The Palapa Ring when the last mile is connected this reliance on satellite can
be reduced,” said one advisor to the project. “BAKTI is essen-
For Indonesia, geography conspires against even and
tially taking on itself the role of trying to solve the issue of
comprehensive connectivity. The 43,000 km of domestic
connecting from points of presence of the Palapa Ring to the
cables linking the major islands, and 25,000 km of foreign
end user.”18
cable passing through Indonesian waters, are vulnerable to
breaks from natural disasters, seismic activity, and shipping. The government meanwhile is trying to make things simpler
Experts emphasize that these factors present headwinds to for companies wanting to build out infrastructure on the
private-sector investment. back of the Ring. For example, an online single submission
Table 6. K
ey ICT Indicators, Indonesia
INDICATOR UNITS YEAR
Electrification 98% of population with access to electricity 2017a
Internet users 32% of population 2017a
Fixed broadband subscribers 3.28 subscriptions per 100 inhabitants 2018a
Fixed Broadband Speed 10 megabits per second 2017a
Fixed Broadband Monthly Subscription Charge 18.37 2011 USD PPP 2017a
Mobile Cellular Subscribers 120 subscriptions per 100 inhabitants 2018a
Mobile Download Speed 14 megabits per second 2020b
Mobile Broadband Prepaid Subscription Charge 3.22 2011 USD PPP per 500 megabits 2017a
a
International Telecommunication Union
b
Ookla Speedtest
18 A consortium led by PT Pasifik Satelit Nusantara won the tender in 2019 and plans to launch in 2022. See also https://theinsiderstories.
com/indonesias-psn-consortium-wins-us1-5b-satellite-multifunction-project/.
Economic Impacts of Submarine Fiber Optic Cables and Broadband Connectivity in Indonesia | Page 13service will allow contractors and others to complete their Many of these companies only took off in 2015, some 4 to 5
paperwork more easily. BAKTI is also interceding where it can years after they were founded, propelled in part by improved
to expedite and facilitate in those instances where obstacles internet speeds and cheaper devices. In 2016 there was a
impede progress. 142% growth in mobile data traffic in Indonesia, compared
to 86% in China and 76% in India. New cable landings had a
5.1.2 Mobile Wireless substantial impact.
The rise of Indonesian unicorns offers a view into how This has been largely the case in highly-populated areas.
Indonesia exploits existing technologies to overcome bottle- Beyond them, the challenge is greater, as alluded to above.
necks, and a possible glimpse of how the deployment of A survey conducted by the E-commerce Association of
subsea cables to the country’s outlying islands may unleash Indonesia (idEA) and Marketing Research Indonesia (MARS) in
new forms entrepreneurship. It is still a mobile world, and 2016 reported that only 11% of those in rural areas shopped
an affordable one, with prices costing half or less of some of online, compared to 39% in towns.19 This has forced e-com-
its neighbors. However, quality trails, according to data from merce companies to be creative: Bukalapak delivers physical
Ookla’s Speedtest (Table 7). Improvements in international goods around the country via a network of 900,000 kiosks,
connectivity could improve these stats.The mobile-mainly whose deployment largely mirrors the local quality of inter-
world favors startups which work around the logistical net connectivity.
limitations, or create solutions. One senior telecoms execu- For now, logistical challenges create opportunities for start-
tive pointed out that for a long time the conventional wisdom ups to forge a competitive advantage. One company said it
in Indonesia had been that e-commerce would never take checks where the user is based before pushing the app to
off because of the twin problems of logistics and payments, them. In a Tier 1 city, a user would have the standard app,
neither of which looked like being solved any time soon. But whereas one in Tier 3 cities and lower (those with less than
GoJek and Grab, and other companies like Bukalapak, have 500,000 people) would have a lighter, smaller app which
turned those challenges to their advantage, leveraging exist- is likely to run better and faster on a phone with a slower
ing logistical infrastructure or transportation, and building connection. As the network expands, regional variations will
their own mobile wallets and payments systems. likely give way to more uniform service provision.
Table 7. K
ey ICT Indicators, Indonesia
MOBILE DATA SPEED FIXED BROADBAND AVERAGE MOBILE FIXED BROADBAND PRICE
COUNTRY
(MBPS DEC 2019) SPEED (MBPS, DEC 2019) COST OF 1 GB (USD) PER MONTH (USD)
Indonesia 13.83 20.11 1.21 30.02
Thailand 25.98 125.12 2.78 23.82
Singapore 57.16 200.12 3.67 43.80
Philippines 16.76 25.55 3.16 43.80
Malaysia 23.80 78.03 1.18 31.75
Vietnam 30.27 43.26 1.31 11.23
Laos 25.54 34.48 3.42 47.24
Myanmar 23.86 18.90 0.87 36.82
Cambodia 15.22 20.89 1.49 32.63
Sources: Ookla Speedtest, Cable.co.uk.
19 B udiono, F., Lau, S., Tibben, W. 2018. Cloud Computing Adoption for E-Commerce in Developing Countries: Contributing Factors and Its
Implication for Indonesia. PACIS 2018 Proceedings.
Economic Impacts of Submarine Fiber Optic Cables and Broadband Connectivity in Indonesia | Page 145.1.3 Fixed Broadband announced that it had recently deployed about 15,000
BTS, with many of them in the country’s so-called ‘Frontier,
Cable landings and building out the necessary ancillary
Outermost and Disadvantaged’ (3T) regions.
infrastructure could yield the rise of more fixed broadband
subscribers, especially among industry, which could experi- 5.2 ECONOMIC DEVELOPMENT
ence lower connectivity costs and/or rises in productivity.
The government has long pursued a policy of ensuring equal
Fixed broadband accounts for a small share of the number access to broadband internet. The Palapa Ring and initiatives
of subscribers, meaning that there are still plenty of oppor- to boost network availability are products of these policies.
tunities to cater to desktop/laptop-based services and those Like other countries, Indonesia adopted programs from the
requiring intense or extremely low latency bandwidth. UN’s Sustainable Development Goals, where broadband
is one of the infrastructures that should be available and
High-speed fixed broadband penetration (connections over
developed by the government. Beyond that, broadband
5 megabits per second, or Mbps) is increasing. DBS Bank said
connectivity is important for national unity, to provide equal-
in a research note that penetration had risen to 10% in 2Q19,
ity among the provinces, where the emphasis is not just on
from 4% in the first half of 2017. DBS also reckoned 8 million
Bali, Sumatra, and Java. President Jokowi has been explicit in
new households would be added by 2021, bringing pene-
saying he wants the economic focus to be in other parts of
tration to 20%.20 Thus, the market remains modest, but it will
the country. So, the country’s Indonesia Broadband Plan goes
mean millions of Indonesians will be able to access high defi-
beyond what the UN calls for: it sees internet connectivity
nition video and gaming more seamlessly, as well as widen
in terms of national unity and equal opportunities for other
opportunities for freelancers and studio businesses working
people.21
on data-heavy projects.
Indonesia is a nation of entrepreneurs: There are nearly 60
5.1.4 Further Expansion million micro- and small enterprises, constituting some 99.9
This evolution of Indonesia from tech backwater to home percent of companies in Indonesia, and accounting for about
of logistics-busting apps like GoJek has naturally influ- 97 percent of the workforce, while contributing between
enced thinking at the telcos. The greater connectivity the 58-61% of gross domestic product. And while most of them
Ring provides to otherwise less attractive markets within are sole proprietorships, they have usually been quick to
the archipelago presents an opportunity. There is growing exploit the opportunities provided by communication tech-
interest among telcos in building their markets beyond Java, nologies.
and investing in the infrastructure to do it, pivoting off the In the early 2000s, for example, having a mobile phone meant
capability provided by the Ring. that a sate seller could receive orders by SMS overnight and
This is a reverse of the past few years, when some companies anticipate the day’s demand before she went to the morning
switched off base stations because of the cost of backhaul market to buy the necessary ingredients, often doubling her
and the expense of maintaining them. Now nearly all telcos daily earnings. This same trend is now playing out with the
are committing significant funds to building networks rise of Indonesian decacorns – mega-startups that offer a
beyond Java. smorgasbord of ecommerce opportunities to those looking
to amplify their business.
XL Axiata, for example, has been deploying fiber in all provin-
cial capitals and major cities on the islands of Java, Madura, The initial GoJek service itself, which ‘professionalized’ the
Sumatra, Kalimantan, Sulawesi, Bali, and Lombok. Currently, informal sector where people – effectively individual entre-
fiber serves some 30% of BTS – mainly covering the Java preneurs in a cash economy – ferried passengers between
region – but its target was that by the end of 2019, 50% of BTS homes, offices and bus stops, also served to connect some
would be connected to fiber networks, increasing to around 80,000 of them to the internet for the first time via the app, as
60-70% by the end of 2020. In November 2019 Telkomsel well as helping a quarter million of them open their first bank
accounts. The addition of other services has had the same
20 DBS Indonesia Telecom Report, 2019 October.
21 See Rosalia Adisti, Human Development Impact of the Implementation of Broadband, A case study of the Indonesian Palapa Ring Project,
and Indonesia Digital for Future Economy and Inclusive Urban Transformation, Eddy Satriya, Deputy Assistant for ICT and Utility, Ministry
Economic Impacts of Submarine Fiber Optic Cables and Broadband Connectivity in Indonesia | Page 15effect on other sectors: Nearly all food stall-holders and cafe There’s hope that improvements in connectivity will help
owners who sold their wares via GoJek’s Go-Food service, for bring government services to remote villages, and, in turn
example, have seen their transaction volume grow. Indeed, to stem the migration of youth to the cities: e-government,
data suggests that as GoJek moves into these other areas, its e-health, and e-education are all seen as services that could
contribution to the economy will grow considerably.22 Clearly be provided over the new network connections.
none of this would have happened without the necessary
Particularly for education, the boost will be welcome.
connectivity, ubiquity and affordability of devices, and famil-
Access to education and its quality remain concerns. On the
iarity with the technology, irrespective of age and education.
OECD’s most recent Programme for International Student
As this level of comfort spreads, so do owners of small enter-
Assessment (PISA), Indonesia scored second lowest among all
prises shift their services from offline to online selling.
countries surveyed in terms of the percentage of high-achiev-
But this is uneven. Many of the country’s successful startups ing students who expect to complete tertiary education.
emerged because of the inadequacies of existing infra- This means that students who qualified enough to study
structure and services, from transport to payment, rising to more aren’t, often because they don’t have the money, or the
fill such gaps by leveraging cheap and ready connectivity facilities are not available. This shows up in the workforce:
(see above). But where the connectivity is lacking, so are Indonesia came last in terms of the percentage of employed
the opportunities for SMEs. While more than 60% of SMEs adults with tertiary education. Indonesia was, perhaps not
were online 2017, there’s still an imbalance: according to the unexpectedly, second last when it came to expectations
Ministry of Cooperatives and Small and Medium Enterprises, for their career among top performing math and science
the lack of internet connections in less developed areas of the students.
country create challenges for SMEs. This is partly why those
parts of the population form a key justification for the rollout
of the Palapa Ring.
6. Conclusion
Connectivity gains are critical for future industries and key
internet of things and other 4th Industrial Revolution tech-
nologies that rely on robust connectivity. There is also a sense The international connectivity provided by subsea cables led
that Indonesia is on the cusp of breaking into the business to a 5.4% increase in GDP per capita. By 2017, the total GDP
process outsourcing market. Aside from strictly online indus- impact was equivalent to roughly $150 billion (at PPP).
tries, improved digital infrastructure is crucial to government What is more, subsea cables have been key to the emergence
plans to encourage high-value industrial development and of the gig economy apps that define modern Indonesia.
boost local manufacturing. The Making Indonesia 4.0 road We attribute shifts towards service sector employment
map launched in April 2018 seeks to diversify the economy (+4.3 million jobs) and digital transformation to the gains in
away from a reliance on natural resources by developing connectivity, improvements in internet quality, and conse-
higher-tech export industries. Areas of focus include 3D print- quent price reductions and increases in access.
ing, artificial intelligence, human-machine interface, robotics
and sensor technology, all of which require advanced The evidence also affirms Indonesia’s development goals
digital capacity. Planners hope that the strategy will create that emphasize improvements in connectivity and access.
between 7 million and 19 million new jobs between 2018 and Over the long term (>20 years), for every 10 percent increase
2030 and lift the industrial sector’s gross domestic product in international bandwidth per user, there has been a 0.41%
contribution from 20 percent to 30 percent over the same increase in GDP per capita.
period. McKinsey believes that with the necessary invest-
Our results underscore the economic development signifi-
ments, automation in Indonesia could create many more
cance of subsea cable landings, international connectivity,
jobs than it displaces: a net gain of four million to 23 million
and policies and programs that are bringing connectivity
full-time-equivalent jobs.
beyond the beach across the archipelago.
22 A cademic research found that two of the company’s services contributed 15.1 trillion rupiah to the economy in 2017; in 2018 it was
calculated the overall company had contributed between 44 and 55 trillion rupiah.
Economic Impacts of Submarine Fiber Optic Cables and Broadband Connectivity in Indonesia | Page 16Economic Impacts of Fiber Optic Subsea Cables
and Broadband Connectivity in Indonesia
Acknowledgment
The authors thank the Indonesian telecommunications experts who
shared their insights and perspectives with us.
The authors wish to gratefully acknowledge the financial support of
Facebook, Inc. The research design, method selection, results, and
conclusions are the authors’ alone.
About RTI
RTI International is an independent, nonprofit research institute
dedicated to improving the human condition. Our partners and clients
rely on us to answer questions that demand an objective and multi-
disciplinary approach—one that integrates expertise across the social
and laboratory sciences, engineering, and international development.
We believe in the promise of science, and we are inspired every day
to deliver on that promise for the good of people and communities
around the world.
For more information, visit www.rti.org.
December 2020
© 2020 RTI International. RTI International is a registered trademark and
RTI International
3040 E. Cornwallis Road a trade name of Research Triangle Institute. The RTI logo is a registered
Research Triangle Park, NC 27709 trademark of Research Triangle Institute.You can also read