Economic Insights 2018 - SURF COAST SHIRE
←
→
Page content transcription
If your browser does not render page correctly, please read the page content below

1   Economic Insights 2018

                             SURF COAST SHIRE

                             Economic
                             Insights
                             2018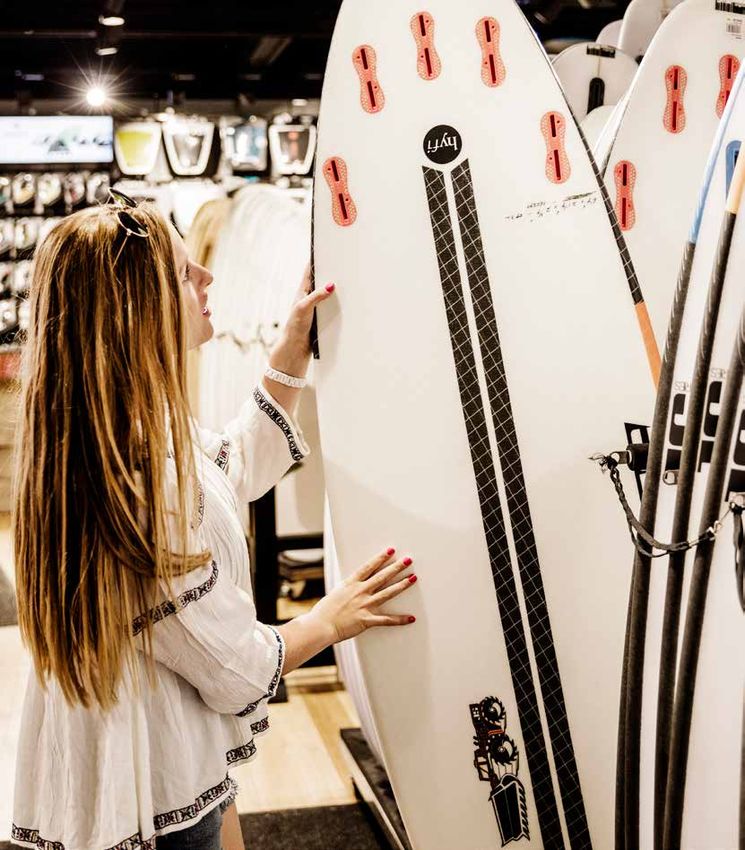
2   Economic Insights 2018

    Contents

    Introduction                                                   3
    Location                                                       4
      Travel times                                                 4
      Surf Coast living is exceptional                             4
    The Surf Coast Economy Profile                                 6
      Gross Regional Product (GRP)                                 6
      The Industry and Jobs Mix                                     7
    All about Surf Coast Businesses                                8
      Business Count                                               8
      Business Size                                                8
      Business Entries and Exits                                   9
    The Tourism Economy                                            10
      Tourism Visitation and Expenditure                           10
      Regional Visitation                                          10
      Visitor Type                                                 10
      Tourism Industry Output                                      11
      Part Time and Visitor Population                             11
      Peak Overnight Population                                    11
    The Surfing Economy                                            12
      Surf Coast, riding the economic wave of a global industry    12
      The Social value of Surfing                                  13
    The Hinterland Economy                                         14
      Land use and production values                               14
      Agribusiness snapshot                                        14
      Strategic work in the hinterland                             15
      Climate Ready                                                15
      Top 10 – Number of Businesses in the Surf Coast Hinterland   15
    Demographics (People)                                          16
      Unemployment rate                                            17
    Development and growth                                         18
      Top 15 Growth areas of Victoria                              18
      Regional population growth forecast comparison               18
      Construction activity                                        19
      Median House Price                                           19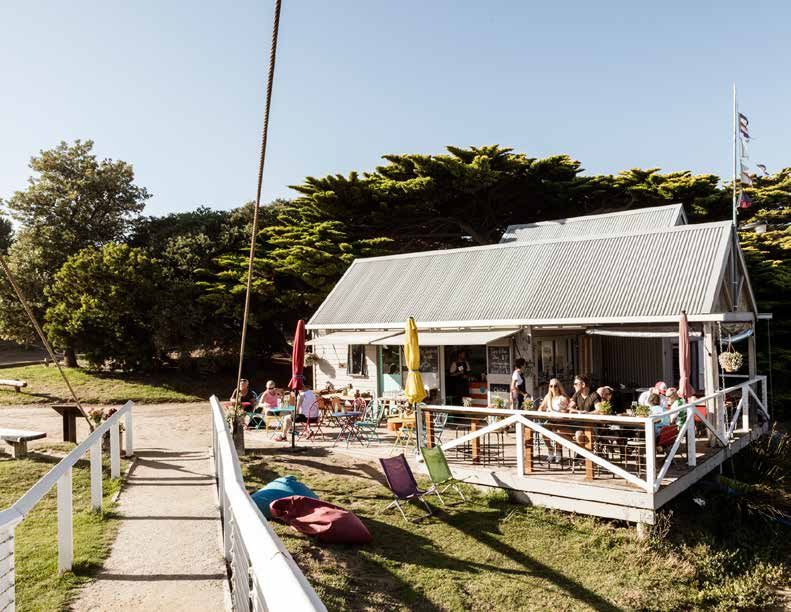
3

Introduction

The Surf Coast economy is unique and it’s growing. Powered by sectors
including surfing, tourism, construction and retail, it generates over $1 billion
annually.
The Surf Coast Economic Snapshot provides          The key data sources include
an overview of the economic and demographic        •   RemPlan
aspects of the Surf Coast Shire, measuring these
trends against other regions and municipalities    •   Forecast ID
for benchmarking purposes.                         •   Profile Id
Using a variety of data sources the publication    •   Census (June 2016)
identifies the distinctly different economic       •   www.rdv.vic.gov.au/information-portal
composition of the Shire and the opportunities
that extend as a result.

 Population

 30,445
 LGA Size

 1560
 No of properties

 20,864
 GRP

 $1.248B
4   Economic Insights 2018

    Location

    The Surf Coast Shire, one of the most liveable locations in                Surf Coast living is
    Victoria, is only 20 minutes from Geelong and 75 minutes from              exceptional
    Melbourne. It retains the charm and values of a coastal lifestyle,
    making it an ideal place to live, work and enjoy an exceptional            •   Close & easy access to
    quality of life.                                                               Melbourne and Geelong
                                                                               •   55km of breathtaking coastal
    With regular V/Line trains the commute to Melbourne is easy,
                                                                                   scenery
    convenient and quick with an approximate travel time from
    Geelong Station of one hour.                                               •   Exceptional beaches around
                                                                                   every corner
    The Shire is home to nine distinct townships: Aireys Inlet,
    Anglesea, Deans Marsh, Fairhaven, Jan Juc, Lorne, Moriac,                  •   Mighty rainforests, booming
                                                                                   waterfalls and fertile
    Torquay and Winchelsea.
                                                                                   farmland
    Source: Surf Coast Shire
                                                                               •   Relaxed, active, healthy
                                                                                   lifestyle
                                                                               •   Safe, welcoming community
                                                                               •   Buzzing coastal towns with
                                                                                   strong sense of belonging
                                                                               •   Flourishing tourism,
                                                                                   construction and unique
                                                                                   retail sectors
                                                                               •   Thriving arts and cultural
                                                                                   communities
                                                                               •   Plentiful locally grown,
                                                                                   sustainable wholefoods
                                                                               •   Original, quality cafés and
                                                                                   restaurants
                                                                               •   Abundant wildlife and nature
                                                                               •   Broad selection of clubs,
                                                                                   sporting and community
                                                                                   facilities

    Travel times

                        MELBOURNE         AVALON            TORQUAY                LORNE            WINCHELSEA
                                          AIRPORT
     MELBOURNE                                 42mins             1hr 13mins         1hr 4mins         1hr 40MINS

     AVALON                    56km                                37mins            1hr 14mins          41mins
     AIRPORT
     TORQUAY                   96km             41km                                  47mins             35mins

     LORNE                     142km           89km                 47km                                 41mins

     WINCHELSEA                111km           57km                 44km               46km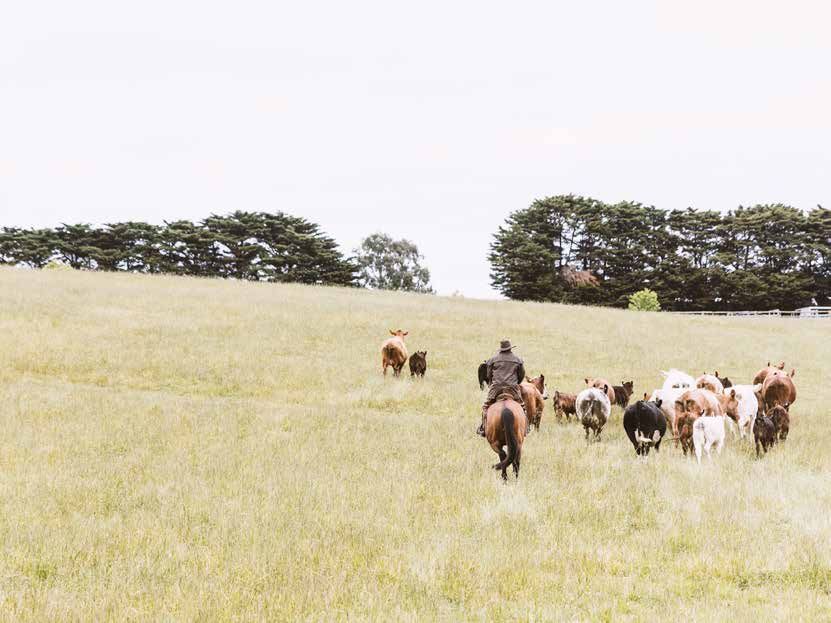
5
6 Economic Insights 2018
The Surf Coast Economy Profile
The Surf Coast townships and the rural hinterland support over 3,227 businesses which drive an
economy shown to be worth nearly $1.25 billion annually.
The economy is unique, dominated by surfing, tourism, construction and retail sectors. Traditional and
emerging
Surf Coast: Grosssectors of agriculture
Regional Product Trend and health compliment to create a distinctly different economy to
that of Geelong and surrounding regions.
1300
$1.248
Gross Regional Product (GRP)
1250
Surf Coast Gross Regional Product Trend
Surf Coast: Gross Regional Product Trend
1200
GRP
1150
is the net measure of wealth generated 1300
$1.248
1100 1250
by the region and represents the total$1.049 value of
$ Billion
1050 $1.010 1200
goods
1000
and services produced
$0.979 in a year. 1150
950 $0.924
Surf Coast's Gross Regional Product in 2017 is 1100
$ Billion
$1.049
900 1050
estimated
850
at $1.248 billion. $0.979
$1.010
1000
800 950 $0.924
2013 2014 2015 2016 2017
Real GDP (June 2015 prices) 900
850
800
2013 2014 2015 2016 2017
Real GDP (June 2015 prices)
Regional Comparison
Regional Comparison GRP 5 Year Average GRP 5 year average growth
8
7
6.74%
6.44% 6.24%
Over a five year period, the Gross Regional
Product of the Surf Coast Shire grew by an
Regional Comparison GRP 5 Year Average
6
8 average of 6.74%.
5 4.40% 6.74%
7 6.44% 6.24%
4 3.24%
This is higher than the average growth for the
6
3 G21 region, Victoria and Australia.
5 4.40%
2
4 3.24%
1
3
0
Surf Coast Geelong G21 region Victoria Australia 2
1
0
Surf Coast Geelong G21 region Victoria Australia
7

The Industry and Jobs Mix
The total employment estimate for the Surf           Rental, hiring and real estate services is one
Coast is 9,293 jobs.                                 of the highest performing sectors in terms of
                                                     output and value add, however it accounts for
The Accommodation & Food Services sector
                                                     very few jobs (1.9%).
provides the highest percentage (16%) of all jobs
in the Surf Coast.                                   The Retail Trade is the second largest
                                                     employment sector but is the seventh largest
The construction industry provides 22.9%
                                                     sector ranked in order of output.
of the total output and is very strong in
terms of output, value add, local sales and          Agriculture represents the fifth largest sector in
regional exports. It is dominated by residential     terms of output and value-add and the seventh
construction.                                        largest in terms of jobs.

Industry Sector                          Output     Output       Value        Value          Jobs           Jobs
                                             $M           %    Add $M         Add %                            %
Construction                             $547.58     22.90%     $157.92       14.10%     1,350.00         14.50%
Rental, Hiring & Real Estate             $326.22     13.60%     $226.59      20.20%        180.00          1.90%
Services
Accommodation & Food Services            $224.41     9.40%       $94.10        8.40%     1,486.00         16.00%
Manufacturing                            $173.88      7.30%      $28.25        2.50%      366.00          3.90%
Agriculture, Forestry & Fishing          $156.86     6.60%       $71.50        6.40%      544.00          5.90%
Professional, Scientific & Technical     $147.98     6.20%        $70.18       6.30%       595.00         6.40%
Services
Retail Trade                              $118.79    5.00%       $72.57        6.50%      1,135.00        12.20%
Wholesale Trade                           $117.09    4.90%       $58.28        5.20%       337.00         3.60%
Health Care & Social Assistance           $96.01     4.00%        $71.21       6.40%      854.00          9.20%
Public Administration & Safety            $86.34     3.60%       $49.33        4.40%      430.00          4.60%
Financial & Insurance Services            $85.27     3.60%       $52.47        4.70%       148.00          1.60%
Administrative & Support Services         $82.97     3.50%       $42.06        3.80%       414.00         4.50%
Education & Training                      $67.54     2.80%        $51.21       4.60%      646.00          7.00%
Other Services                            $42.19      1.80%      $24.66        2.20%       336.00         3.60%
Arts & Recreation Services                $38.69      1.60%      $15.39        1.40%       254.00          2.70%
Information Media &                       $31.00      1.30%       $11.88        1.10%       67.00         0.70%
Telecommunications
Transport, Postal & Warehousing           $25.28      1.10%       $10.61      0.90%        109.00          1.20%
Electricity, Gas, Water & Waste           $16.42     0.70%        $8.48        0.80%        22.00         0.20%
Services
Mining                                     $9.69     0.40%        $3.94       0.40%         20.00         0.20%
Total                                  $2,394.20              $1,120.64                 9,293.00
8 Economic Insights 2018
All about Surf Coast Businesses
Business Count
The total number of businesses in the Surf Coast Number of businesses
Number 2012-2016
of businesses 2012-2016
in 2016 was 3,227.
3250 3,227
Business Counts are based on snapshots of
actively trading businesses as at June 2013, 2014 3200 3,170
and 2015 from the Australian Bureau of Statistics 3150
# of businesses
Business Register (ABSBR). The ABSBR contains 3,096
3100
counts and rates of business entries and exits 3,048
from the Australian economy as well as counts 3050 3,010
and rates pertaining to the survival of businesses. 3000
This count only includes businesses which
2950
actively traded in goods or services during the
reference period. 2900
2012 2013 2014 2015 2016
The number of businesses has grown at a rate of
3% overall on average over the past three years.
Number of Employees per business
Business Size
1%
90% of businesses in the Surf Coast Shire are 9%
NumberSurf Coast Business
of businesses Counts 2014-2016
2012-2016
micro to small businesses employing 4 people or
less. 2500
3250 3,227
1,903 1,994
Number of employees per 32002000
1,954
3,170
business
# of businesses
3150
# of businesses
1500 3,096
SoleTrader/Consultant 1,994 3100
3,048 28%
897 907
1-4 employees 907 30501000 841
3,010
5-19 275 3000
500 271 250 275
20-199 41 2950
62%
33
0 36 0 41 0
0
200+ 0 2900 Jan 14 Jan 15 Jan 16
2012 2013 2014 2015 2016
Total 3,217
1-4 employees 20-199 employees
5-19 employees SoleTrader/Consultant
The largest recent growth has been in the 20-199
employees with 11.5% growth, followed by 1-4
employees at 3.5% growth and non employing at SurfCoast
Surf CoastBusinesses
Business by
Counts 2014-2016
size 2014-2016
2.35% growth.
2500
1,903 1,954 1,994
2000
Turnover per business (%)
# of businesses
1500 3%
15% 897 907
1000 841
500 271 250 24%
275
33 36 41
0 0 0
0
Jan 14 Jan 15 Jan 16
20% Non employing 1-4 employees 5-19 20-199 200+1300
$1.248
1250
62%
1200 9
1150
1100
$ Billion
$1.049
1050 $1.010
1000 $0.979
950 $0.924
900
850
800
2013 2014 2015 2016 2017
Real GDP (June 2015 prices)
Turnover per business (%)
Turnover of business (%) Regional Comparison GRP 5 Year Average
The amount of turnover per business is a
3% 8 relatively even split across all categories
15% 7
6.74%
between
6.44% $0 to6.24%
$2m per year. Only 3% of
6 businesses are achieving a turnover higher
5
than $2m.
24% 4.40%
4 3.24%
3
2
Zero to less than $50k
20% 1
$50k to less than $100k
0
Surf Coast
$100kGeelong
to less thanG21 region
$200k Victoria Australia
$200k to less than $500k
18% $500k to less than $2m
$2m or more
20%
Business Entries and Exits 1200
1,012
In 2017, the number of Surf Coast businesses 1000
increased by 494. There were 1012 new
800
businesses actively trading businesses during
the period and 518 that ceased to be active. 600 518
The largest growth sector was in professional, 400
scientific and technical services, followed by
construction and financial & insurance services. 200
0
Entries Exists
Business Entries and Exits – Top 10 Growth sectors
Professional, Scientific & Technical Services 157 80 16%
Construction 165 95 14%
Financial & Insurance Services 119 69 10%
Health Care & Social Assistance 61 13 10%
Administrative & Support Services 78 32 9%
Retail Trade 70 25 9%
Other Services 54 22 6%
Arts & Recreation Services 40 11 6%
Rental, Hiring & Real Estate Services 53 25 6%
Education & Training 44 18 5%10 Economic Insights 2018
The Tourism Economy
Tourism Visitation and Expenditure
The Surf Coast with it’s proximity to Melbourne, its beaches, National Parks, many recreational
opportunities, major events and beautiful natural environment make it a tourism drawcard of
Regional Victoria.
Surf Coast Visitor Visitor Average Ave. Tourism
Numbers Nights Nights Expenditure Expenditure ($M)
Per Day
Day Visitors 1,235,000 $84 $ 103.7
Overnight Visitors 938,000 2,434,000 2.6 $127 $ 309.1
International Visitors 51,792 268,684 5.2 $111 $ 29.8
2,224,792 2,702,684 $442.7
In the last financial year the Surf Coast attracted they stay the longest and spend the most money
over 2.2 million visitors who expend over $442 per trip. A domestic overnight visitor will typically
million in the local economy. spend $330 per trip compared to an international
visitor who will spend $577.
Domestic overnight visitors stayed 2.6 nights Surf Coast Market Share
on average and spent the most money per Day visitors provide the least amount of yield
day ($127). This visitor segment generates that with an average expenditure per day of $84
highest level of tourism expenditure ($309m). generating $103m in total. An ideal scenario for
the Surf Coast is to identify ways to encourage
International visitors by comparison stayed 5.2
day visitors to stay overnight and to provide
nights and spent $111 per day. Although the 44% for
overnight visitors with a reason to stay longer
number of international visitors is comparatively
the benefit of the region.
small, they are the highest yielding visitor type as
56%
Regional Visitation Visitor Type
The Great Ocean Road (which starts in Torquay) 56% of all visitors to the Surf Coast are day
further cements Surf Coast Shire’s status as an visitors, followed by domestic overnight visitors
internationally renowned tourism destination. (42%) and international visitors (2%).
The Surf Coast region attracts 44% of the 5.1m
Summer and Spring are the most popular
visitors to the Great Ocean Road. Surf Coast
times to visit the Surf Coast with both quarters
Great Ocean Road
Surf Coast Market Share
accounting for 65% of total visitation.
Surf Coast Market Share
Year-round, off-beach and all weather activities
are needed to encourage more visitation during
the Autumn and Winter quarters.
Surf Coast 2% International Visitors
44%
56%
42%
Great Ocean Road Overnight
Visitors
Day Visitors 56%
Surf Coast
Great Ocean Road11
Tourism Industry Output Part Time and Visitor Population
The tourism sector is not considered a In addition the growing permanent population,
traditional industry, it is an amalgam of activities part time and visitor populations are significant.
across various industry sectors such as retail, This is due to the attractiveness of the Surf Coast
accommodation, cafes & restaurants, cultural as a tourist destination and also to the large
& recreational services. In the Surf Coast, number of non-permanent residents living in the
accommodation & food services accounts for Surf Coast part-time or owning a holiday home.
86.3% of total output in this sector followed by arts
• 47% OF PROPERTIES within Surf Coast Shire
and recreation services (17.4%).
are owned by people residing outside the
When consolidated, the tourism sector is the Shire.
second largest sector in the Surf Coast economy.
• 26% OF HOLIDAY HOUSE OWNERS have a
Selected industry sectors in Surf Coast (S) future intention of moving permanently to
ranked by Output Surf Coast Shire
• 37.5% of these intend to do so within 2-5years
Surf Coast (S) (Dec and a further 30% between 5-10 years.
2017)
Source: .id forecast, Hugo, G. and Harris, K (2013) “Time
Industry Sector $M % and Tide: moving towards an understanding of temporal
population changes in coastal Australia” (prepared for
Construction $547.575 22.9% the National Sea Change Taskforce)
Tourism $271.631 11.3%
Peak Overnight Population
Ownership of Dwellings $205.950 8.6%
During peak visitation periods, the population of
Manufacturing $159.944 6.7%
Surf Coast Shire is estimated nearly triple from its
Agriculture, Forestry & $156.061 6.5% usual population of approx. 29,402 to over 86,000.
Fishing A peak night would typically be experienced during
the highest levels of tourism visitation in Summer
Sub-Total $1,341.161 56.0%
combined with good weather and major events.
Peak Overnight Population
Area Permanent Population Population Population Peak
Population Holiday Caravan Hotels, Overnight
Homes Parks, Cabins Motels, Population
& Camping Apartments, (i)
Sites Units & B&Bs
SURF COAST SHIRE
Aireys Inlet/Fairhaven/ 1,191 5,749 362 237 7,539
Moggs Creek
Anglesea 2,548 9,986 1,676 205 14,415
Deans Marsh 265 344 N/A 15 624
Jan Juc 3,681 3,079 1,441 38 8,239
Lorne and District 1,111 7,562 4,650 1,948 15,271
Torquay (Including Bellbrae 14,259 10,461 4,722 1,763 31,205
& Bells Beach)
Winchelsea (Including 2,127 683 0 46 2,856
Winchelsea South)
Rural Balance 3,441 2157 206 124 5,928
Total Surf Coast Shire 29,402 40,022 13,057 4,376 86,077
Source: Enterprise Geelong12 Economic Insights 2018
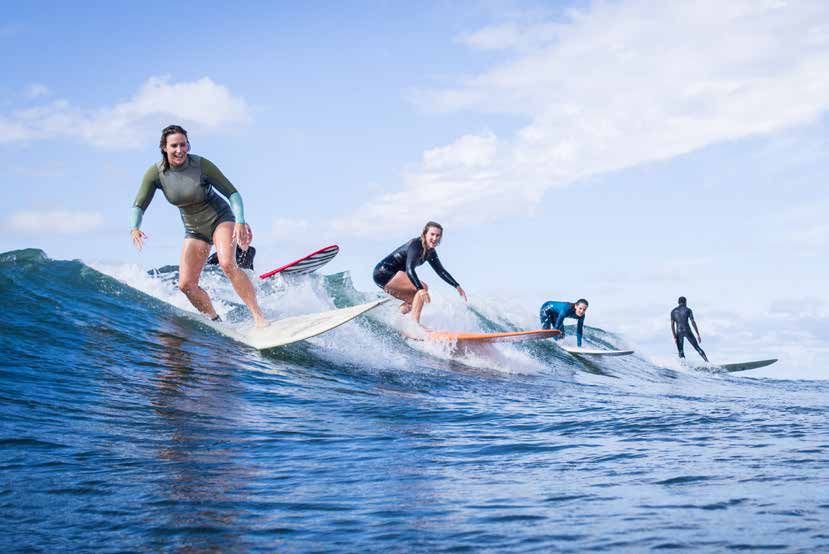
The Surfing Economy
Surf Coast, riding the economic wave of a global industry
As the location of choice for one of the world’s premier annual professional surfing events - the
Rip Curl Pro at Bells Beach - and home to internationally marketed retail surf brands, Surf Coast
Shire is a location of historical and contemporary significance to the global surfing community.
Similarly to the tourism industry, although surfing If the Surfing industry is considered as a sector, it
is not a traditional sector, the concentration represents almost 27% of all jobs (over 2,000) and
of businesses that are inspired by surfing is 26.5% ($217 million) of all Value Add activity. This
significant. makes it the number one driver of the Surf Coast
economy above even construction and tourism.
Home of the Torquay
Boardriders Club
– one of Australia’s
largest and most
active clubs of its
type.
The only accredited
surfing museum in
the world.
Global headquarters
for Rip Curl,
Quiksilver, Modom,
Bellroy, Strapper and
many more.
Attracting exciting
new small businesses
and start-ups13
The Social value of Surfing
While surfing is an identifiable aspect of the community the uniqueness of surfing has been
difficult to capture. On the one hand, it is considered a sport, yet many individuals express that
their experience of surfing goes beyond that of a sporting pursuit.
KEY FINDINGS
• Surfing strengthens family relationships - 88% • Surfing creates an opportunity for people to
of respondents highly value or value time feel connected to the environment and to be
spent surfing with their family involved in conservation efforts
• Surfing creates and enhances opportunities • 99% of respondents stated that surfing
for strong social connections and strengthened their connection to the
relationships within the community to exist environment
• 79% of respondents have a high or • 89% of respondents are highly influenced
moderate percentage of personal or influenced to conserve and protect the
relationships that have been formed environment through their involvement
through surfing in surfing
• 34% of respondents have been given • Surfing promotes a healthy and holistic
opportunities for employment through lifestyle and contributes to an overall
networks established by surfing feeling of wellbeing and happiness - 88% of
respondents are influenced by surfing to live
• Surfing creates a sense of surf community:
a more healthy and holistic lifestyle
social cohesion, feeling secure in the
community and a sense of belonging with • Significant value of surf clubs: 78% of surfing
likeminded people club members highly value or value their
involvement within a surfing club.
Source: BEYOND THE WAVES: Exploring the social value of surfing to the Surf Coast community14 Economic Insights 2017
The Hinterland Economy
The Surf Coast Hinterland refers to all areas of the
Surf Coast Shire excluding the coastal townships
and National Parks areas. The hinterland includes
the townships of Moriac, Bellbrae, Deans Marsh and
Winchelsea. Over 4,400 businesses operate in the Surf
Coast Hinterland, with the top three sectors based on
annual output being Construction, Agriculture, Forestry
& Fishing, and Financial and Insurance Services.
wy
sH
Main Rd
nce
Pri
WINCHELSEA d
yR MORIAC
wa
Hendy
t
p eO
Anglesea Rd
Ca
ea R d
els
Fo
re
h -Winch
st
BELLBRAE
Rd
TORQUAY
ars
sM
an
BELLS BEACH
De
DEANS
MARSH
GREAT OTWAY
NATIONAL PARK ANGLESEA
Rd
an
Oce
at
e
eR
d Gr
Land use and production values
n
AIREYS INLET
Lor
rsh-
Land use in the Surf Coast Hinterland is largely
Ma
driven by soil quality and lot size. Soil quality is
s
an
De
generally poorer towards the coast and improves
towards the north west of the shire. Lot sizes follow
LORNE
a similar trend, with a higher concentration of
smaller lot sizes towards the coast and larger, broad
scale agricultural lots in the north west.
Agribusiness snapshot
Agriculture is the second largest employer and has
the second largest output of Surf Coast Hinterland,
contributing 512 jobs (15.9%) to total employment. More
than half of the agricultural businesses in the Surf Coast
involve livestock production, including dairy and beef
cattle, sheep, alpacas, pigs and poultry.15
Top 10 – Number of Businesses in the Surf Coast Hinterland
Sector Count %
Construction 737 16.74%
Financial & Insurance Services 620 14.08%
Agriculture, Forestry & Fishing 563 12.79%
Professional, Scientific & Technical Services 502 11.40%
Rental, Hiring & Real Estate Services 317 7.20%
Other Services 230 5.22%
Health Care & Social Assistance 218 4.95%
Retail Trade 210 4.77%
Administrative & Support Services 181 4.11%
Manufacturing 136 3.09%
Forestry & Fishing, hunting Agriculutre
Logging 1% & trapping 2% Forestry &
Fishing support
Aquaculture 1% services 12%
Other
Agriculture Sheep farming
9% (specialised) 12%
Dairy Cattle
Farming 4%
Poultry & other
Livestock 10%
Beef cattle
Other grain farming
growing 3% (specialised) 23%
Grain-sheep or Grain-
beef cattle farming 11% Sheep-Beef cattle
farming 12%
Strategic work in the hinterland Climate Ready
The Surf Coast Shire values the hinterland and has The Barwon South West region has already
a number of programs and strategies underway become warmer and drier – a climate trend
in order to support the hinterland region and
likely to continue into the future. Local residents,
assist businesses
businesses and communities are changing the
- Hinterland Futures Strategy – Guiding the way they do things in response.
planning and development of the hinterland
in line with our community’s values The impact of climate change on primary
- The Local Food Program – Supporting the production may include:
vision of the Surf Coast Shire as a healthy food • Changed fodder or pasture production
production region pattern
- The Agribusiness Strategy for the G21 Region • Changed distribution of pests and diseases
2017 – 2022 – working in conjunction with
• Heat stress on livestock and crops
the City of Greater Geelong, Colac Otway
Shire, Golden Plains Shire and The Borough of • Farm business affected by bushfire
Queenscliff • Reduced water security
• Reduced area suitable for forestry16 Economic Insights 2018
Demographics (People)
The estimated resident population as at 30 June 2016 was 30,445
Median age 41.5 years
Median Income (weekly) $938
Post School Qualifications 63.5%
Average household size 2.6
Average monthly rental payment $1519
Average monthly mortgage payment $1971
The most common type of family group in the Surf Coast are couples without children (41%) and
couples with children under 15.
45
40
35
30
25
20
15
10
5
0
Couples Couples with One parent Couples with One parent Other families
without children children under families with non-dependant families with
15 children under children non-dependant
15 children
Total Personal income (%)
0.3%
7.4%
3.7%
5.5% 26%
$1-499 per week
$500-999 per week
24.3% $1000-1999 per week
$2000-2999 per week
$3000 or more per week
Nil income
24.3% Negative income
48.6% of Surf Coast residents earn $500 - $1999 per week on average.
Australian Citizenship0.3%
7.4%
3.7%
5.5% 26% 17
Employment location of resident workers $1-499 per week 7,399, or 52.7% of Surf Coast Shire’s
$500-999 per week working residents travel outside of the
24.3%Surf Coast Shire 2016$1000-1999 per week
area to work.
Location Number$2000-2999% per week
$3000 or more per week
51% of Surf Coast Shire residents over
Live and work in the area 5,859Nil income41.7
24.3% Negative income the age of 15 participate in unpaid
Live in the area, but work outside 7,399 52.7 work. The majority of these people
No fixed place of work 789 5.6 volunteer for an organisation or group
Total employed residents in the 14,047 100.0 (54%) while 46% provide assistance,
area care
Overseas Bornor help to others.
Population
Overseas Born Population 26%
Australian Citizenship Overseas Born26%
Australians
Australian Citizenship
26% 26%
10% Not Australian Citizens
26%
26%
26%
North-West Europe
26%
Oceania
Southern and Eastern Europe
90% North-West Europe
Other
Australian citizens Oceania
90% of Surf Coast residents are Australian
Notcitizens.
Australian citizens Southern and Eastern Europe
54% of non-australian residents were born in north Other
west Europe.
Internet access
Unpaid work
Australian
Internet Citizens
access
9.9% Unpaid Work
23%
Unpaid work
23%
54%
23%
54%
83.9% Yes
No Unpaid assistance to a person with a disability
23%
Voluntary work for an organisation or group
83.9% of Surf Coast residents have internet access.
Unpaid care, help or assistance to others
Unpaid assistance to a person with a disability
Unemployment rate Voluntary work for an organisation or group
Unpaid care, help or assistance to others
The Surf Coast unemployment rate is currently 2.7%. This is well below the
Construction type
unemployment rate for Regional Victoria and Victoria overall. A measure in the
23 %is to maintain unemployment below 3.5%.
Surf Coast Shire Council Plan18 Economic Insights 2018
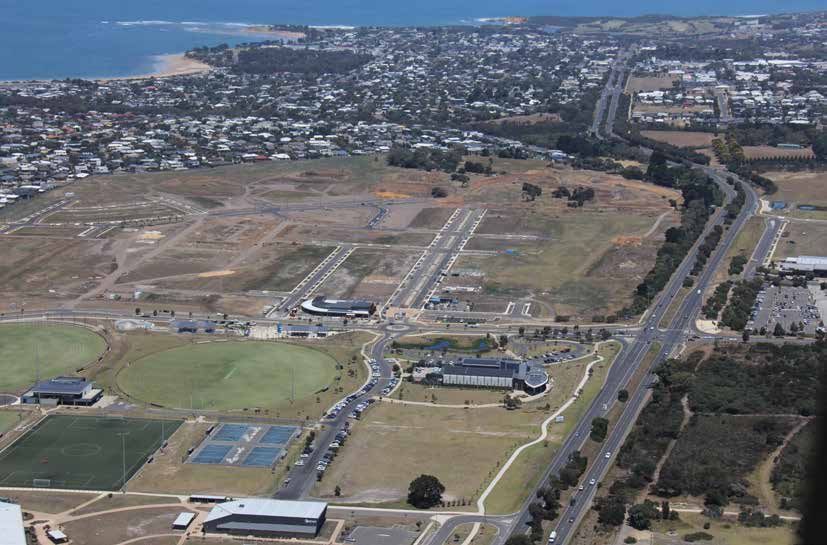
Development and growth
Matching economic growth, proximity and lifestyle continue to contribute to the Shire being one the
fastest growing municipalities in Victoria. Since 2006 the permanent population of the Shire has grown
from 22,333 to 30,445 in June 2016 and is forecast to grow to nearly 45,717 by 2036.
Population summary
Surf Coast Shire Forecast year
Change between 2016 and 2036
Area 2016 2021 2026 2031 2036 Total Avg.
change annual
%
change
Torquay North 7,379 8,980 11,021 13,154 14,691 +7,312 3.50
Torquay 13,771 16,428 19,364 22,348 25,129 +11,358 3.05
Old Torquay - Torquay West 6,392 7,448 8,342 9,195 10,438 +4,046 2.48
Winchelsea 2,089 2,335 2,632 2,928 3,216 +1,127 2.18
Jan Juc - Bellbrae - Bells 4,856 5,380 5,593 5,913 6,448 +1,592 1.43
Beach
Lorne - Aireys Inlet 2,545 2,724 2,856 2,973 3,100 +556 0.99
Anglesea 2,660 2,806 2,854 2,878 2,918 +258 0.46
Deans Marsh and Moriac 4,525 4,558 4,648 4,761 4,906 +382 0.41
Districts
Top 15 Growth areas of Victoria Regional population growth
Considering the level of population growth in
forecast comparison
Victorian regions, if Torquay was a municipality it According to State Government forecasts Surf
would be Victoria’s 6th fastest growth area. Coast Shire will be in regional Victoria’s top 5
fastest growing municipalities from 2011 to
Over the past 5 years Surf Coast Shire has been
2031.
Victoria’s 10th fastest growing municipality by
percentage growth of population.
In the next 20 years, the majority of population
Outside of metro Melbourne, Surf Coast is Victoria’s growth in the Surf Coast Shire is expected in
third fastest growing municipality over the past 5 Torquay. Winchelsea is the second highest
years. forecast growth area.19
Median House Price - 2016
Prelim 2016 Growth PA
Locality Median
AIREYS INLET $ 797,500 4.9
ANGLESEA $ 730,000 4.7
FAIRHAVEN $ 947,500 4.9
JAN JUC $ 825,000 7.2
LORNE $ 1,125,000 0.8
MOGGS CREEK $ 959,000 6.5
TORQUAY $ 705,000 5.6
WINCHELSEA $ 305,000 2.4
Source: Property and Land Titles Office, June Quarter, released December 2017.
Construction activity Median House Price
The total value of building approvals in the Surf The Median House price in the Surf Coast
Coast to June 2016 was $267 million. Shire was $811,250 as at June 2016. Lorne has
the highest median house price followed by
Although the Surf Coast Shire is considered a
Moggs Creek and Fairhaven. Winchelsea had the
‘rural council’, the value of construction is on
cheapest median house price at $305,000.
par with Victorian cities of Bendigo, Ballarat and
Latrobe and exceeds any of the Victorian regional The highest growth per annum in the past 10
cities including Mildura, Wodonga, Warrnambool years has been in Jan Juc (7.2%) followed by
and more. Moggs Creek (6.5%) and Torquay (5.6%). Lorne
had the lowest median house price growth.
Residential construction accounts for 77% of the
total construction in the Surf Coast worth $192m
while non-residential building and heavy/civil
engineering is only 23% of construction activity
with a value of $57.4m.
Construction services is the largest component
of the sector worth $297.7m. This category
includes all of the associated trade activity such
as land subdivision, site preparation, concreting,
plumbing, electrical, carpentry, glazing, etc.Economic Development Unit
Council’s Economic Development and Tourism
unit has collated a range of statistics to assist
businesses in making strategic decisions about
expanding or relocating to Surf Coast Shire
including:
• Economic Snapshot
• Surf Industry Mapping
• Visitor Insights
• Economic Impact of Events
Contact the unit for business support
and information.
Surf Coast Shire Council
1 Merrijig Drive (PO Box 350)
Torquay VIC 3228
p. 03 5261 0600
e. info@surfcoast.vic.gov.au
surfcoast.vic.gov.auYou can also read