Economic Outlook 2019-2021
←
→
Page content transcription
If your browser does not render page correctly, please read the page content below

34 Oakland County th

                  Economic
                   Outlook       2019-2021                       SUMMARY

                   Presented by:
                   Dr. Gabriel Ehrlich and Donald R. Grimes,
                   Research Seminar in Quantitative Economics,
                   University of Michigan

                   Final Report Available June 2019 at:
                   AdvantageOakland.com

                                                                                     MiCareerQuest
                                                                                     Southeast 2018

                                                                   Planet Rock,
                                                                   Madison Heights

   Topgolf,
   Auburn Hills

Topgolf, Auburn Hills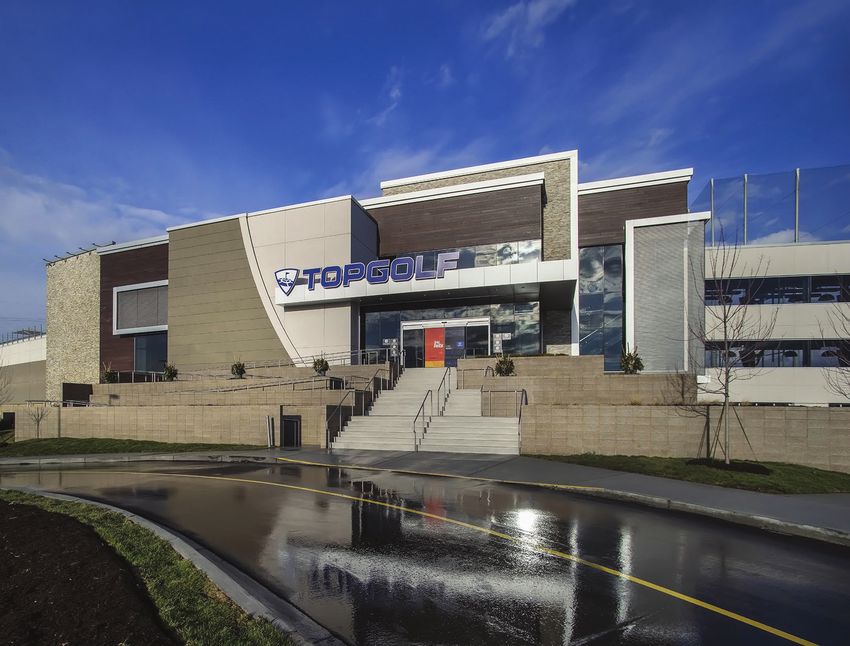
SUMMARY INTRODUCTION
    L. BROOKS PATTERSON
    OAKLAND COUNTY EXECUTIVE

                                 Welcome to our 34th annual Oakland County
                                 Economic Outlook luncheon.
 BOND RATING SINCE 1998          Welcome to our 34th annual Oakland County Economic Outlook
Oakland County is a fiscally     luncheon. We are proud of the work we do and appreciate your
   responsible government        interest in Oakland County.
  partner with resources to      Chase and Oakland Community College, along with our Department of
     support your success.       Economic Development & Community Affairs, have co-hosted this event for
                                 more than three decades. I thank them and our other sponsors who help ensure
                                 the luncheon’s success as well as the Oakland County Board of Commissioners for
                                 its continued support of our economic development programming. We are grateful
                                 for these long-standing relationships.

                                 We welcome back respected economists Dr. Gabriel Ehrlich, director of the Research
                                 Seminar in Quantitative Economics at the University of Michigan, and longtime contributor
                                 Donald R. Grimes to provide business, education and government leaders in southeast
                                 Michigan with a three-year projection of economic growth for the area. Of course, Dr. Ehrlich’s
                                 predecessor, Dr. George Fulton, will be making his annual appearance this year, his 34th. Mention
                                 “free lunch” and George drops everything. Welcome back George.

                                 Oakland County remains an economic powerhouse for Michigan. We don’t compare ourselves to other
                                 counties, our benchmark is other states. Consider the following:

                                 • In 2017, total wages paid by Oakland County companies for their employees were about $45 billion
                                     – which is greater than total wages earned in 16 states
                                 • During the same period, more than 728,000 people were employed in Oakland County – a sum
                                     larger than 13 states
                                 • Exports from Oakland County in 2017 exceeded $14.4 billion, surpassing the export totals of 25
                                     states; a quarter of all exports from Michigan come from Oakland County
                                 • In 2018, our Emerging Sectors® business diversification strategy topped $5 billion of total
                                     investment since inception in 2004, resulting in more than 500 successes – either new companies or
                                     business expansions – creating or retaining 89,000 jobs
                                 •   Our budget is balanced through 2023 as we continue to be among a select few counties nationally
                                     to have a AAA bond rating, saving taxpayers millions of dollars
                                 We are on a roll.

                                 Oakland County gives businesses and entrepreneurs the tools and opportunity to succeed: a skilled
                                 and educated workforce, a business-friendly environment, access to capital and an unmatched quality
                                 of life for our residents.

                                 To the business community in Oakland County and Michigan, thank you for your hard work and for
                                 the dollars you put at risk. More importantly, thank you for the shimmering horizon of good economic
                                 news that we continue to enjoy.

  The Economic Outlook Summary is             2019 SPONSORS
           presented at a luncheon by         Automation Alley | Beaumont | Bishop International Airport | Citizens Commercial Banking
     Dr. Gabriel Ehrlich and Donald R.        Construction Association of Michigan | DTE Energy | Genisys Credit Union
                                              Huron Valley State Bank | ITC Holdings Corp. | McLaren Oakland
     Grimes, University of Michigan’s
                                              Oakland County Michigan Works! | Oakland County Michigan Works! Troy
    Research Seminar in Quantitative          Oakland University | PNC Bank
      Economics. Along with Oakland
 County, the event is hosted by Chase
    and Oakland Community College.
34 Oakland County  th

  Economic
   Outlook        2019-2021                      SUMMARY

               PRESENTED BY
                Dr. Gabriel M. Ehrlich
                and Donald R. Grimes
                University of Michigan

                    APRIL 2019
                                                       Gabriel Ehrlich     Donald Grimes

              OVERVIEW OF CONTENTS
Track Record for Forecasts over the Years               Outlook for Oakland County through 2021, including:
Job Growth and Unemployment Rates in Recent History     • Employment Growth by Industry Division

Recent Job Growth by Wage Categories                    • Job Growth by Wage Categories
                                                        • Oakland Employment Growth Compared with Michigan’s
Comparisons with Other U.S. Counties of Similar Size
                                                        • Local Unemployment and Inflation Rates
Overview of the U.S. Economic Outlook
County GDP Statistics

      The full report will be available in June on the web (updated annually) at:
  AdvantageOakland.com | lsa.umich.edu/econ/rsqe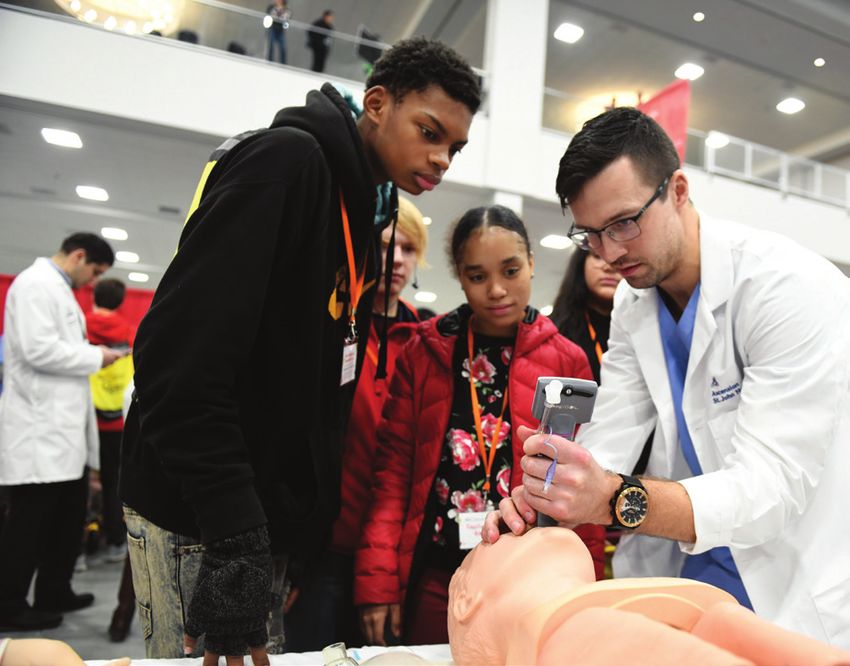
Research Seminar in Quantitative Economics (RSQE)
The Research Seminar in Quantitative Economics (RSQE) is a modeling and forecasting unit that has been in operation at the
University of Michigan since 1952. Four times per year, RSQE provides forecasts of both the U.S. economy and the Michigan
economy. RSQE hosts the University of Michigan’s Annual Economic Outlook Conference, the longest-running such event in
the U.S., in Ann Arbor each November. RSQE has twice received the prestigious Blue Chip Annual Economic Forecasting Award
(AEFA) recognizing “accuracy, timeliness, and professionalism” in economic forecasting.

Dr. Gabriel M. Ehrlich                                          Dr. Michael R. McWilliams
received his Ph.D. in economics from the University of          received his Ph.D. in economics from the University of
Michigan. He is the director of the University’s Research       Michigan. He is a Michigan forecasting specialist at the
Seminar in Quantitative Economics (RSQE). His research          Research Seminar in Quantitative Economics (RSQE). His
focuses on several areas of housing and land economics          research focuses on a range of topics in environmental and
as well as the effects of wage rigidity on labor market         natural resource economics, including land use change and
outcomes. His work has been published recently in the New       its causes and environmental consequences, regulation of
England Journal of Medicine, the Review of Economics            light-duty vehicles, and the impact of the ethanol mandates.
and Statistics, and the Journal of Urban Economics.             His work has been published in the Proceedings of the
                                                                National Academy of Sciences and Energy Policy.
Prior to joining RSQE, Dr. Ehrlich worked in the Financial
Analysis Division at the Congressional Budget Office            Dr. McWilliams assists with RSQE’s forecasts of the Michigan
(CBO), where he forecast interest rates and conducted           economy and tax revenues four times per year, and he recently
analysis on monetary policy and the mortgage finance            coauthored The Michigan Economic Outlook for 2019–2020.
system. He has also worked as a financial analyst in the
mortgage banking industry. He earned his undergraduate          Jacob T. Burton
degrees in finance and economics at the University of           is the newest member of the team at the University of
Maryland, where he was chosen by the faculty as the             Michigan’s Research Seminar in Quantitative Economics
outstanding graduate in finance during his senior year.         (RSQE), where he contributes to the Michigan and U.S.
                                                                forecasts four times per year. He is currently finishing his
Dr. Ehrlich testifies twice per year to the state legislature   master’s degree in applied economics from Eastern Michigan
on Michigan’s fiscal and economic prospects, which              University. He recently coauthored The United States Economic
the state uses as a guide to determining expected               Outlook for 2019–2020 and The Michigan Economic Outlook
future revenues. He recently coauthored The United              for 2019–2020. His primary fields of interests are in economic
States Economic Outlook for 2019–2020 and The                   forecasting and energy economics.
Michigan Economic Outlook for 2019–2020.

Donald R. Grimes
received his master’s degree in economics from the                 lsa.umich.edu/econ/rsqe
University of Michigan. He is a senior research area
specialist at the University’s Research Seminar in
Quantitative Economics (RSQE) and at the Economic Growth
Institute, where he is assistant director of the Center for
Labor Market Research. His primary research interests
are in labor economics and economic forecasting.

For 40 years, he has been engaged in economic forecasting
for state and local governments and is frequently called
upon for policy advice. He has worked for many years with
the Michigan departments of Transportation and Treasury
and the Michigan Economic Development Corporation on
policy analysis and evaluating economic strategies. He is
co-director of a project to generate long-term economic
and demographic projections for all of the counties of
Michigan. His past research includes a study looking at
Michigan’s industrial structure with a view to identifying
sectors that will promote economic growth in the future.

He has been involved in research projects sponsored by
the U.S. Department of Commerce, the U.S. Department of
Labor, the Federal Reserve Bank of Chicago, and the Robert
Wood Johnson Foundation. His work has been published
recently in the Economic Development Quarterly and the
New England Journal of Medicine. He recently coauthored
The Michigan Economic Outlook for 2019–2020.
Table 1
        Track Record over the Years
          Year of       % Forecast Error          Year of      % Forecast Error           Year of      % Forecast Error
         Forecast     for Total Private Jobs     Forecast    for Total Private Jobs      Forecast    for Total Private Jobs
           1986               + 1.4                1997               + 0.6               2008                 + 2.3
           1987               + 0.7                1998               + 1.3               2009                 + 5.5
           1988               – 1.8                1999               – 1.2               2010                 – 1.7
           1989               – 1.9                2000               + 0.6               2011                 – 2.5
           1990               + 2.2                2001               + 1.9               2012                 – 2.6
           1991               + 3.9                2002               + 3.2               2013                 – 1.1
           1992               – 2.0                2003               + 1.5               2014                 – 0.3
           1993               + 0.5                2004               + 2.6               2015                 – 0.1
           1994               – 1.3                2005               + 1.4               2016                 – 0.1
           1995               + 0.2                2006               + 3.4               2017                 + 1.1
           1996               – 0.5                2007                  0.0              2018                 + 0.4
        (Positive numbers indicate that the forecast was too high; negative numbers indicate that it was too low.)

                                         Average absolute forecast error 1986–2018: 1.6%

                                                                 Forecast 2018               Actual 2018
                      Unemployment rate                              3.4%                        3.3%
                      Consumer inflation rate                        2.3%                        2.4%

        Forecast Date: April 2018

              In last year’s report, we forecast that Oakland                 Our forecast for the government sector was
              County’s private sector would add 11,713 jobs                   also a little too high. We anticipated job growth
              in 2018, for a growth rate of 1.7 percent. We                   of 1.1 percent in 2018; instead, government
              now estimate that the county gained 8,861 new                   employment increased by only 0.8 percent.
              jobs last year, or 1.3 percent, resulting in an
              overshoot of 0.4 percentage points, or four                     We had forecast that the unemployment rate
              workers per 1,000.                                              would decline by 0.1 percentage points, from
                                                                              3.5 percent in 2017 to 3.4 percent in 2018. We
              That forecast error is well below our average                   were spot on in terms of the change, but the
              absolute error of 1.6 percent since 1986.                       starting point was revised. The unemployment
                                                                              rate for Oakland County did decline by 0.1
              Among the major industry divisions, the largest                 percentage points, from a revised value of 3.4
              shortfall in our forecast was in leisure and                    percent in 2017 to 3.3 percent in 2018.
              hospitality services. We expected that industry
              division to grow by 1,514 jobs (2.1 percent),                   Our forecast for inflation was also very close.
              whereas we now estimate that it added only                      We underestimated local consumer inflation by
              252 jobs (0.4 percent). We believe the                          0.1 percentage points. Local prices increased
              weakness in this sector is temporary and that                   by 2.4 percent in 2018 instead of the 2.3
              growth will bounce back in 2019.                                percent we had forecast.

Presentation Review                                                                                                           3
Figure 1
Job Growth in Oakland County, 1991–2018

      Oakland County’s economy grew vigorously            The acceleration in Oakland County’s job
      during the 1990s. The county added 182,700          growth is a heartening sign this far into the
      jobs from 1990 to 2000, an average pace of 2.8      county’s recovery period. It is especially
      percent per year.                                   impressive given the recent softness in Detroit
                                                          Three light vehicle sales, which have declined
      The county gave up the majority of that growth      in each of the past three years.
      during the 2000s, shedding 156,500 jobs. That
      came to an average rate of decline of 2.2           In our view, Oakland’s recent success reflects
      percent annually. In total, the county lost 86      the ongoing diversification of the county’s
      percent of the jobs it had gained in the            economy toward future growth sectors, which
      preceding decade.                                   has been enabled by the county’s well-
                                                          educated labor force.
      The 2010s have seen a return to growth in
      Oakland County. We estimate that through            Oakland County’s job gains in 2018 were
      2018, the county has added back 126,500 jobs,       concentrated in three major industry divisions.
      registering an average growth rate of 2.1           In order, they were: professional and business
      percent per year.                                   services; private education and health services;
                                                          and trade, transportation, and utilities.
      Job growth in the county slipped to a 1.0           Together, these industries accounted for over
      percent annual pace in 2017, its slowest rate       four-fifths of the county’s job gains for the year.
      during the current recovery period.
                                                          The government sector has continued to lag the
      Based on the currently available data, it           private sector since returning to job growth in
      appears that growth bounced back nicely in          2016. The sector grew at a 0.8 percent pace in
      2018. We now estimate that the county added         2018, half a percentage point slower than the
      9,300 jobs for the year, a growth rate of 1.3       private sector.
      percent.

 4                                                     2019–2021 Economic Outlook for Oakland County
Table 2
 Job Change in Oakland County by Industry Wage Category, 2010–2018
                                                                                     Change         % Change
                                                          2010         2018         2010–2018       2010–2018
 Total all industries                                    611,142     737,602          126,460           20.7
 Higher-wage industries ($75,000 or more)                196,912     246,854           49,943           25.4
 Middle-wage industries ($35,000 to $74,999)             278,566     321,722           43,156           15.5
 Lower-wage industries (under $35,000)                   135,665     169,026           33,361           24.6

Source: BLS, Quarterly Census of Employment and Wages. Higher-wage industries have an average wage in
2017 at least 35 percent above the U.S. average ($55,390) and lower-wage industries at least 35 percent below
the U.S. average.

       We have broken out job growth in Oakland                    Middle-wage industries grew more slowly in
       County over the recovery period into three                  Oakland County on a percentage basis, 15.5
       categories based on the average wages paid in               percent. Because the 2010 employment level in
       each of the 151 unique industries in our                    middle-wage industries was so large, however,
       dataset.                                                    that growth rate translated into 43,156 job
                                                                   additions, only slightly less than the number of
       The three categories are higher-wage                        jobs in the higher-wage industries.
       industries, which paid an average of $75,000 or
       more in 2017; middle-wage industries, which                 Lower-wage industries added 33,361 jobs in
       paid on average between $35,000 and                         Oakland County from 2010 to 2018, the fewest
       $74,999; and lower-wage industries, which                   of the three wage categories. However,
       paid less than $35,000 on average.                          because the 2010 employment level in lower-
                                                                   wage industries was relatively small, that
       For comparison, the average annual wage in                  translated into a healthy growth rate of 24.6
       the United States was $55,390 in 2017, versus               percent.
       $61,536 in Oakland.
                                                                   An important factor behind the relatively slow
       Higher-wage industries grew faster than                     growth in the middle-wage industries in
       average on a percentage basis in Oakland                    Oakland County during this time is job losses in
       County from 2010 to 2018. The 49,943 job                    the government sector.
       additions in this category came to total growth
       of 25.4 percent.

Presentation Review                                                                                              5
Figure 2
Unemployment Rates for Oakland County and for the United States, 1990–2018
Oakland County’s unemployment rate climbed Oakland’s unemployment rate averaged 3.3
to 7.5 percent in 1991, its peak level during the percent in 2018. That was only one-tenth of a
early 1990s recession. It declined over the percentage point lower than the 2017 average,
remainder of the 1990s, reaching a low point of but it was still a move in the right direction. It
2.6 percent in 2000. was also the lowest annual unemployment rate
the county had recorded since the all-time low
Oakland’s unemployment rate climbed to 6.6 achieved in 2000. The U.S. unemployment rate
percent in 2008, before spiking during the Great averaged 3.9 percent in 2018, six-tenths of a
Recession to 13.0 percent in 2009 and 11.8 percentage point above Oakland County’s
percent in 2010. The national unemployment unemployment rate for the year.
rates for those years were 5.8, 9.3, and 9.6
percent, respectively. Growth in the county’s labor force came almost
to a standstill in 2018, at 0.1 percentage points.
Oakland County’s unemployment rate has We believe that slowdown reflects a balancing
come down sharply since the Great Recession. act between a strong labor market, which is
Oakland’s rate fell below the national rate in drawing more workers into the labor force, and
2015, and has stayed there every year since a powerful downward pull from demographics,
then. as baby boomers increasingly reach the normal
retirement age.
6 2019–2021 Economic Outlook for Oakland CountyTable 3
Oakland County Compared with its Peers*
Associate's Median High-Income
Population Degree or Child Family Persons Aged 65 Managerial, Sum of Rank of
County State 2017 More Poverty Income** or Older Professional Rankings Sum
Fairfax VA 1,148,433 1 8 1 1 1 12 1
Montgomery MD 1,058,810 2 7 3 2 2 16 2
Collin TX 969,603 5 1 2 12 3 23 3
Nassau NY 1,369,514 10 3 6 3 13 35 4
DuPage IL 930,128 6 4 4 11 11 36 5
Oakland MI 1,250,836 8 6 5 14 5 38 6
Bergen NJ 948,406 9 2 13 8 9 41 7
Westchester NY 980,244 11 9 9 5 10 44 8
Wake NC 1,072,203 3 15 7 15 4 44 8
Hennepin MN 1,252,024 4 17 8 16 7 52 10
Fairfield CT 949,921 15 13 11 6 14 59 11
Travis TX 1,226,698 14 18 10 10 8 60 12
Contra Costa CA 1,147,439 17 14 15 4 17 67 13
Fulton GA 1,041,423 7 25 12 18 6 68 14
Suffolk NY 1,492,953 20 5 14 9 22 70 15
St. Louis MO 996,726 16 16 16 19 15 82 16
Mecklenburg NC 1,076,837 13 22 17 24 16 92 17
Allegheny PA 1,223,048 12 19 18 32 12 93 18
Salt Lake UT 1,135,649 24 11 19 20 19 93 18
Prince George's MD 912,756 35 12 20 7 23 97 20
Honolulu HI 988,650 22 10 24 13 36 105 21
Gwinnett GA 920,260 23 21 21 23 27 115 22
Franklin OH 1,291,981 21 30 22 25 18 116 23
Erie NY 925,528 18 27 23 27 26 121 24
Palm Beach FL 1,471,150 25 23 29 17 32 126 25
Sacramento CA 1,530,615 32 24 25 21 25 127 26
Pinellas FL 970,637 28 20 27 29 29 133 27
Hillsborough FL 1,408,566 26 26 30 28 24 134 28
Pima AZ 1,022,769 29 29 32 22 28 140 29
Cuyahoga OH 1,248,514 27 34 26 33 20 140 29
Orange FL 1,348,975 19 28 35 34 31 147 31
Duval FL 937,934 31 31 28 30 30 150 32
Shelby TN 936,961 34 36 31 26 35 162 33
Marion IN 950,082 30 32 34 35 33 164 34
Philadelphia PA 1,580,863 36 37 37 38 21 169 35
Milwaukee WI 952,085 33 33 33 36 34 169 35
Fresno CA 989,255 37 35 36 31 37 176 37
Bronx NY 1,471,160 38 38 38 37 38 189 38
*All counties in the United States with a population between 900,000 and 1,600,000 in 2017
**Adjusted for cost of living
Source: American Community Survey 2017. Census Bureau Population Estimates, April 2018.
Presentation Review 7It is useful to compare Oakland County’s Notably, Oakland ranks 5th in professional
economic structure and outcomes with those of occupations, 5th in median family income, and
similar counties in order to forecast Oakland’s 6th in child poverty. Oakland’s placement in
future. Oakland County ranks near the top on a these categories has helped it maintain and
number of economic metrics when compared to improve its position compared to its peers. This
its peer counties. is an impressive achievement considering that
a number of these counties contain some of the
We ranked Oakland County among its peers on top-rated local economies in the nation.
five measures that we consider to be
informative of future economic prospects. We After last year’s forecast presentation, we were
considered all counties in the United States asked about the distribution of child poverty
with populations between 900,000 and 1.6 within the county. Data for communities within
million residents in 2017. A total of 37 other the county are not available for the year 2017,
counties matched this description, with but 5-
Oakland’s population of 1.25 million in the are available. Those statistics show dispersion
middle of the pack. in the level of child poverty across communities
within Oakland County. Some communities
A lower number for a rank indicates a better have reported child poverty rates of zero
position among the counties: a rank of 1 is the percent, while others report levels above 40
best and 38 is the worst. Oakland County ranks percent. Oakland’s average level of child
between 5th and 14th across the various poverty has fallen in every year since 2011,
measures. Oakland’s status in every measure however.
has improved since our previous forecast.
Oakland’s lowest ranking came in the share of
In Table 2, we arrange the 38 counties by the high-income seniors, but the county’s ranking
sum of their rankings across the various of 14th on this metric still placed the county well
measures to calculate an overall ranking. into the top half of its peer group.
Oakland places 6th overall, up three places
from its ranking a year ago. We believe Oakland County’s strong overall
performance in these measures suggest it is
The measures we consider are: (1) educational securely positioned now and for the future. The
attainment—share of the population aged 25 to combination of an educated populace, a high
64 with at least an associate’s degree in 2017; share of managerial and professional jobs, and
(2) child poverty—share of the population aged an attractive standard of living should provide a
17 and under who lived within families whose solid foundation for economic prosperity over
income was below the poverty level in 2017; (3) our forecast period and in the years to come.
median family income adjusted for the cost of
living in 2017; (4) high income seniors—share
of persons aged 65 and older with income at
least five times the poverty line in 2017; and (5)
professional occupations—share of employed
county residents working in professional and
managerial occupations in 2017.
8 2019–2021 Economic Outlook for Oakland CountyFigure 3
County-Level Real GDP
The Bureau of Economic Analysis recently The right-hand map above shows 2015 real
released prototype statistics for annual Gross GDP divided by the number of payroll
Domestic Product (GDP) by county covering employees, or output per worker, for each of
the years 2012–2015. The left-hand map above Michigan’s counties. Oakland County’s output
shows 2015 real GDP for each of the 83 per worker was $143,100 in 2015, about 32
counties in Michigan. percent higher than the state average.
Oakland’s level ranked fourth out of the state’s
GDP measures the value of all of the goods and counties.
services produced in a particular location over
a specific time period. Real GDP adjusts that The three counties with higher levels of output
measure for inflation, in this case to be per worker in 2015 were Kalkasa, Luce, and
expressed in 2012 dollars. Mackinac, each of which had fewer than 5,000
payroll employees. We believe that the small
Oakland County’s real GDP was $101 billion in sizes of those counties’ workforces mean their
2015. That was the largest GDP out of all of the rankings on this measure should be taken with
counties in Michigan, about 25 percent larger a grain of salt.
than the next-largest level, in neighboring
Wayne County. In fact, Oakland County Wayne County had real output per worker of
accounted for 23 percent of Michigan’s real $115,400 in 2015, which was 19.4 percent
GDP in 2015. lower than Oakland’s level. Kent, Macomb, and
Washtenaw Counties, with the state’s third-
Private service-producing industries accounted through fifth-largest economies, all had real
for 76.1 percent of Oakland County’s real GDP output per worker near $100,000, roughly 30
in 2015. Private goods-producing industries percent lower than Oakland’s.
accounted for 19.8 percent, while government
accounted for just 4.2 percent. Relative to Private sector output per worker in Oakland
Michigan overall, a higher share of Oakland County was even higher in 2015 than the
County’s GDP comes from private-sector overall level, at $146,400. In the government
service industries and a lower share comes sector, output per worker was $95,200.
from government.
Presentation Review 9Figure 4
Growth in U.S. Real GDP, 2017–2021
Oakland County’s economic future is deeply We expect the Federal Reserve to slow its
intertwined with the overall health of the recent pace of monetary tightening going
national economy. forward. We foresee one additional increase in
the range for the federal funds rate this year
U.S. real GDP grew by 2.9 percent in 2018, on and one more in 2020 followed by a flat path in
par with 2015 as the strongest performance of 2021.
this business cycle expansion. Growth slowed
during the course of 2018, however, from an Overall, we are projecting annual real GDP
annual rate of 4.2 percent in the second quarter growth to register 2.4 percent in 2019, 1.8
to 2.2 percent in the fourth quarter. percent in 2020, and 1.5 percent in 2021.
Based on the high-frequency data so far, we Our forecast assumes a relatively rosy scenario
expect growth in the first quarter of 2019 to for international trade relations, with no further
register a disappointing annualized pace of 1.4 tariffs imposed by the United States or
percent, but we judge that pace to be below the retaliatory tariffs by other nations. If trade
economy’s current trend. Growth bounces back tensions begin to worsen again, our forecast
to around 2.4 percent in the second quarter. could prove to be too optimistic.
We then expect GDP growth to decelerate over Although we are projecting growth to slow down
the next few years, as the temporary boost from over the next few years, our baseline outlook
the tax cuts in the Tax Cuts and Jobs Act of does not include a national recession over the
2017 and the extra federal spending from the forecast horizon. We believe that the Fed will
fiscal 2018 and 2019 budgets both fade. be able to engineer a so-called “soft landing,”
with growth slowing but not venturing into
negative territory.
10 2019–2021 Economic Outlook for Oakland CountyFigure 5
U.S. Light Vehicle Sales, 1990–2021
As economic growth slows over the forecast We are projecting light vehicle sales to total
horizon, so do U.S. light vehicle sales. 16.9 million this year before sliding to 16.8
million in 2020 and 16.5 million in 2021.
Total light vehicle sales set an all-time high of
17.5 million units in 2016, but that pace now The decline is driven by automobiles, as light
feels like a hazy memory. Sales fell to 17.2 truck sales, which include minivans, SUVs, and
million units in 2018. CUVs, continue to grow at a moderate pace.
We see the light truck share of vehicle sales
edging up to 76 percent of the market in 2021.
Presentation Review 11Figure 6
Real U.S. Light Vehicle Output, 1990–2021
The decline in unit sales of light vehicles over We expect total real U.S. light vehicle output to
our forecast period obscures a more heartening grow from 546 billion chained 2012 dollars in
trend, which is that real U.S. light vehicle output 2018 to 565 billion dollars in 2021, for a modest
continues to inch up. average growth rate of 1.2 percent per year.
The difference between the trends for sales and That growth is better than the declines we
real output, or value added, arises from the expect for unit sales, but it is still slower than
diverging fortunes of automobiles and light the average annual growth rate of 5.6 percent
trucks. recorded between 2011 and 2018.
Since light trucks contain much more value
added than automobiles, the continued growth
of light truck sales outweighs the decline in auto
sales when it comes to vehicle output. We
forecast average growth of 2.2 percent per year
in real output of light trucks from 2018 to 2021,
compared with an average decline of 6.5
percent per year in automobiles.
12 2019–2021 Economic Outlook for Oakland CountyFigure 7
U.S. Light Vehicle Sales, Total vs. Detroit Three, 2017–2021
The Detroit Three’s share of the light vehicle Detroit Three sales fall from 7.2 million units per
market fell from 42 percent in 2017 to 41.7 year in 2017 and 2018 to 7.0 million units per
percent last year as the overall market eked out year in each of 2019 and 2020. They then fall a
a small gain. bit further to 6.8 million units in 2021.
We see the Detroit Three share dipping a bit Our forecast makes several relatively optimistic
further to 41.4 percent in 2019 before nudging assumptions: that this year’s contract
back up to 41.5 percent in 2020 and 2021. negotiations between the United Autoworkers
and the Detroit Three automakers are
When combined with our outlook for the total completed without a prolonged work stoppage;
light vehicle market, this projections yields a the United States-Mexico-Canada Agreement
declining profile for Detroit Three sales. is ratified successfully in all three nations; the
Trump administration does not impose new
tariffs on automotive imports from the
European Union; and the trade tensions with
China do not result in any substantial new
tariffs.
Presentation Review 13Figure 8
Inflation Rate, Detroit CPI, 1990–2021
We measure local inflation by the growth rate Energy prices tumbled toward the end of 2018
of the Detroit Consumer Price Index (CPI), as and the start of 2019, which should cause
county-level consumer price data are not inflation to dip this year. We are forecasting
available. Since 1990, Detroit CPI inflation has national inflation of 1.8 percent and local
averaged 2.2 percent per year, about three- inflation of only 1.5 percent for the year.
tenths of a percentage point lower than the
average U.S. rate of 2.5 percent. Inflation then inches back up toward the
Federal Reserve’s target of 2.0 percent as
Local and national inflation both registered 2.4 energy prices stabilize. We are forecasting
percent in 2018, pushed upward by a large local inflation of 1.8 percent per year in 2020
increase in energy prices that persisted through and 2021. National inflation runs one-tenth of a
most of the year. That was the highest level percentage point higher than local inflation in
since 2011, when Detroit CPI inflation each of those years.
registered 3.3 percent and national CPI
inflation clocked in at 3.1 percent.
14 2019–2021 Economic Outlook for Oakland CountyFigure 9
Job Growth in Oakland County, 1991–2021
On a quarterly basis, using our estimate for the We expect growth of 1.4 percent in 2019, 1.5
end of 2018, Oakland County has now percent in 2020, and 1.4 percent in 2021. That
completed nine consecutive years of job growth growth translates into gains of 10,300 jobs this
since the recession’s low point at the end of year, 10,900 in 2020, and 10,300 in 2021.
2009. (The small number of job losses recorded
in 2010 is a statistical artifact that results from In total, we are forecasting 31,600 job additions
calendar-year averaging. The county actually over our forecast period, an average pace of
gained jobs in each quarter of the year, but not 1.4 percent per year. That is a substantially
quickly enough to take the annual average faster pace than we currently anticipate for the
above its level in the previous year.) United States or the state of Michigan over our
forecast period.
Job growth accelerated from 1.0 percent in
2017 to 1.3 percent in 2018.
Presentation Review 15Figure 10
Total Jobs in Oakland County vs. Michigan, Seasonally Adjusted, First Quarter of
2000 to Fourth Quarter of 2021
To put Oakland County’s recovery from the We forecast that Oakland County will create an
Great Recession in perspective, we plot the additional 32,100 jobs from the end of 2018 to
quarterly path of the county’s total employment the end of 2021. (That total differs slightly than
from the beginning of 2000 to the end of our the total using calendar-year averages reported
forecast period in 2021. We include the same alongside Figure 9 because it is from the end of
path for the state of Michigan. We index both 2018 to the end of 2021.)
employment paths to equal 100 in the second
quarter of 2000, when Michigan reached its In our forecast, Oakland County sets a new
peak employment level. Oakland reached its employment peak in the summer of 2021. By
peak employment level one quarter later, in the contrast, the state as a whole is forecast to
third quarter of 2000. remain four percentage points below its peak
employment level in that quarter.
Oakland County lost 166,500 jobs from then
until the fourth quarter of 2009, its Great The more vigorous job growth we are projecting
Recession-era low point. That was 21.6 for Oakland County relative to Michigan overall
percent of its peak level. means that the gap between the two index lines
in the figure continues to grow, from 1.8 index
Oakland’s decline was more severe points at the end of 2018 to 4.0 points at the
proportionally than Michigan’s peak-to-trough end of 2021.
decline from the second quarter of 2000 to the
third quarter of 2009. Michigan lost 859,100
jobs in that time, 18.3 percent of its peak level.
Oakland’s labor market has recovered more
vigorously from the recession than Michigan’s
overall. We estimate that Oakland recovered
136,100 jobs from the end of 2009 to the end of
2018, which translates to nearly two index
points more than the state of Michigan.
16 2019–2021 Economic Outlook for Oakland CountyTable 4
Job Change in Oakland County by Industry Category, 2018–2021
Change % Change
2018 2021 2018–2021 2018–2021
Total all industries 737,602 769,172 31,570 4.3
Higher-wage industries ($75,000 or more) 246,854 257,684 10,830 4.4
Middle-wage industries ($35,000 to $74,999) 321,722 335,012 13,290 4.1
Lower-wage industries (under $35,000) 169,026 176,476 7,450 4.4
Source: BLS, Quarterly Census of Employment and Wages. Higher-wage industries have an average wage in
2017 at least 35 percent above the U.S. average ($55,390) and lower-wage industries at least 35 percent below
the U.S. average.
This table splits job growth in Oakland County One factor we see boosting growth in the
over the forecast period into the same industry middle-wage industries is the government
categories based on average wages as in sector’s return to growth in Oakland County.
Table 2. Government employment started increasing in
the county in 2016, and we expect its growth to
On a percentage basis, we are forecasting that continue at a modest pace over the forecast
job growth will be similar in all industry wage period.
categories over the next three years.
Employment in both higher-wage and lower- The higher- and middle-wage industries
wage industries is expected to increase by 4.4 account for over three-quarters of the net new
percent, while employment in middle-wage jobs created in the county from 2018 to 2021.
industries will grow by 4.1 percent.
Presentation Review 17Table 5
Forecast of Jobs in Oakland County by Major Industry Division, 2018–2021*
Average
Estimate Forecast Employment Change Annual Wage
2018 2018–2019 2019–2020 2020–2021 2018–2021 2017
TOTAL JOBS (Number of persons) 737,602 10,347 10,941 10,282 31,570 61,536
(Annual percentage change) (1.3) (1.4) (1.5) (1.4) (1.4) N.A.
TOTAL GOVERNMENT 45,417 459 940 117 1,516 53,785
TOTAL PRIVATE 692,184 9,888 10,001 10,165 30,055 62,047
GOODS-PRODUCING 94,383 1,421 1,141 936 3,499 79,414
Natural resources, mining,
construction 27,061 734 713 677 2,124 71,196
Manufacturing 67,322 688 428 259 1,375 82,674
Fabricated metal products 10,357 35 -102 -178 -245 61,646
Machinery 11,565 58 98 74 230 83,196
Transportation equipment
(motor vehicles) 21,829 272 172 125 569 105,481
Other manufacturing 23,571 323 261 237 821 70,842
PRIVATE SERVICE-PROVIDING 597,801 8,467 8,860 9,229 26,556 59,302
Trade, transportation and utilities 130,449 940 914 1,024 2,878 54,477
Wholesale trade 37,369 303 424 445 1,172 96,191
Retail trade 79,289 262 202 280 744 34,838
Transportation, warehousing
and utilities 13,792 375 289 299 963 57,402
Information 14,946 178 68 78 324 80,946
Financial activities 53,751 857 843 855 2,555 83,436
Finance and insurance 37,262 498 481 490 1,468 97,254
Real estate and rental and leasing 16,490 359 363 365 1,087 52,835
Professional and business services 187,339 2,470 2,772 2,726 7,969 76,995
Professional, scientific, and
technical 103,944 2,537 2,247 2,197 6,980 91,429
Management of companies and
enterprises 18,364 226 194 -33 387 124,769
Administrative support and waste
management 65,031 -293 331 562 601 43,089
Private education and health services 116,531 2,444 2,494 2,702 7,641 50,170
Private education services 11,118 226 115 127 467 44,851
Health care and social assistance 105,412 2,219 2,379 2,575 7,173 50,761
Leisure and hospitality 70,898 1,602 1,549 1,576 4,727 21,682
Other services 22,498 0 218 268 487 35,591
Unclassified 1,390 -25 0 0 -25 50,427
*Some subtotals do not add to totals due to rounding of annual average computations.
18 2019–2021 Economic Outlook for Oakland CountyTable 5 distributes our projected total job in 2017, but job gains slipped to only 69 in 2018.
movements for Oakland County from 2018 to 2021 Over the next three years we expect transportation
among 28 major industry divisions. equipment manufacturing to add a total of 569
jobs, due in large part to the expansion of
The government sector turned the corner to job production activity at General Motors’ Lake Orion
growth in 2016 after ten consecutive years of job assembly plant.
losses, and growth continued in 2017 and 2018.
We believe the rebound in government Employment growth in all other manufacturing
employment is here to stay. We expect job gains industries averaged 3.4 percent per year from
to average around 1.1 percent per year over the 2012 to 2017, compared with 2.5 percent per year
forecast period, for a total of 1,516 job additions in transportation equipment. Job growth in the
from 2018–2021. The path of those gains is non-auto manufacturing industries slowed to 1.0
uneven over the forecast period because percent in 2018. We expect job growth to continue
temporary workers hired to help conduct the 2020 to slow over the next three years, to 0.9 percent in
Census boost the job count for that year. 2019, 0.6 percent in 2020, and 0.3 percent in
Nonetheless, the growth that we foresee in the 2021, for a total addition of 805 jobs.
government sector through 2021 does not keep
pace with growth in the private sector. Machinery and chemicals account for over one-
half of these job gains over the forecast period,
Private-sector employment grew 3.1 percent per adding 230 and 218 jobs, respectively. The
year in the first four years of the economic fabricated metals industry is forecast to lose 245
recovery, from 2009 to 2013. The pace of growth jobs over the next three years
then slowed to 2.2 percent per year between 2013
and 2016. In 2017, the number of private-sector Employment in wholesale trade is forecast to grow
jobs in the county only grew by 1.0 percent, partly by 1.0 percent per year over the next three years,
because of statistical revisions that reassigned cumulating to 1,172 job additions. Motor vehicle
some professional and technical services jobs to and parts merchant wholesalers account for over
locations outside the county. In 2018, job growth one-half of those job gains (623).
picked up to 1.3 percent, and we are forecasting
that jobs in the private sector will expand at a rate Retail trade is a much larger sector than wholesale
of 1.4 percent in each of the next three years. trade. We are bearish on the growth prospects for
retail in light of the many job cuts and store
The construction industry accounts for 97 percent closings that have been announced recently both
of the jobs in the aggregate industry category of nationally and in Michigan. Online competition,
natural resources, mining, and construction. The technological advances, and the growth of big-box
category adds 2,124 jobs over the next three retailers that are less labor-intensive than smaller
years, as residential construction continues to pick stores all weigh on employment growth in retail
up. Specialty trades contractors account for 1,544 trade. We see growth averaging just 0.3 percent
total job additions, and residential building per year over the forecast period, for a total of 744
contractors account for another 281 job gains. new jobs. We would not be surprised if growth in
this sector turns out even weaker than we currently
Job growth in the manufacturing sector had been forecast.
slowing prior to 2016, from 5,756 job additions in
2011 to just 655 in 2015. The sector rebounded Transportation and warehousing grow at a
nicely with 2,185 new jobs in 2016 and 2,386 new relatively strong average rate of 2.4 percent per
jobs in 2017, but 2018 saw a return to slower year from 2018 to 2021, producing a total of 921
growth with only 523 job additions. We expect job new jobs. Many of these new jobs are effectively
gains in manufacturing to continue, but at a replacing jobs in brick and mortar retail stores as
modest pace of 688 in 2018, 428 in 2020, and 259 on-line shopping continues to expand.
in 2021.
The information sector adds a total of 324 jobs
Transportation equipment (motor vehicle) over the next three years, a modest pace of 0.7
manufacturing led growth in the early stages of the percent per year. Newspaper and book publishers
recovery, with a total of 5,328 job additions in 2011 lose 206 jobs between 2018 and 2021, reflecting a
and 2012 combined. Growth slowed to an average long-term decline that by 2018 had claimed sixty
of only 263 job additions per year from 2013 to percent of the industry’s jobs since its peak in
2016. The industry unexpectedly added 1,450 jobs 2003.
Presentation Review 19The finance and insurance industry was slow to Management of companies is another core part
recover in Oakland County after the Great of the white-collar auto industry in Oakland
Recession, losing 771 jobs from 2010 to 2014. County. This division grows by a relatively
Employment in the industry then grew at a modest 387 jobs from 2018 to 2021.
robust pace of 1,164 jobs (3.4 percent) per year
between 2014 and 2017. Growth slowed Administrative support and waste management
sharply in 2018 to only 300 jobs (0.8 percent). services, which includes temporary help
We expect growth to pick up a bit to an average services, grew very rapidly in the first few years
pace of 489 jobs per year over the next three of the recovery, adding jobs at an average rate
years, for a total of 1,468 jobs. We are of 6.7 percent per year between 2009 and
forecasting that depository credit 2013. Since 2013, however, employment in this
intermediation establishments, such as sector has declined by 103 jobs as local
commercial banks, will show flat employment employers decided that they needed to hire
over the next three years as rising mortgage workers on a permanent basis rather than as
interest rates take a toll. Insurance carriers, temporary employees. We are forecasting very
agencies, and other activity related to modest employment growth (0.3 percent per
insurance are expected to fare a bit better, year) in this sector over the next three years,
adding 669 jobs over the next three years. totaling to a net job gain of 601.
The real estate and rental and leasing industry Employment growth in private education
grows by a total of 1,087 jobs over the next services has been moderate since 2009,
three years, for an average growth rate of 2.2 averaging 1.0 percent per year through 2017.
percent per year, as the residential real estate In 2018, employment declined by 247 jobs. We
market continues to improve. Most real estate foresee it rebounding to growth of 1.4 percent
agents are self-employed, and thus are not per year from 2018 to 2021, or 467 total new
included in the payroll employment statistics jobs.
presented here.
Health care and social assistance adds 7,173
From 2009 to 2018, employment in the jobs over the next three years, an average
professional and business services super- growth rate of 2.2 percent per year. That pace
sector grew by 51,041 jobs, an average rate of is faster than the sector’s average annual
3.6 percent per year. This super-sector growth rate of 1.5 percent since 2009. The
accounted for 40 percent of all job gains in the aging of the baby boomers will increase
county between 2009 and 2018, almost twice demand for health care workers. We forecast
its share of total employment in 2009 (22 hospitals to add 2,800 jobs, ambulatory health
percent). This aggregate category contains care services to add 1,271 jobs, and social
three divisions: professional, scientific, and assistance to add 1,701 jobs.
technical services; management of companies
and enterprises; and administrative support The leisure and hospitality services industry
and waste management. Many of the jobs was on a tear from 2011 to 2017, growing at an
associated with the knowledge economy are in average rate of 4.0 percent per year. Growth
this sector, which in Oakland County is closely came nearly to a stop in 2018 when this
identified with the motor vehicle industry. Over industry added only 252 jobs, a growth rate of
the next three years we expect this super- 0.4 percent. We expect the good times to
sector to add 7,969 jobs. return, but at a more moderate pace, with
average growth of 2.2 percent per year from
The professional, scientific, and technical 2018 to 2021. That growth path would yield a
services division accounts for 88 percent of that total of 4,727 new jobs by 2021.
job growth: 6,980 jobs from 2018 to 2021, or 2.2
percent per year. Engineering services add The “other services” sector covers a wide
1,860 jobs in those years, while testing variety of industries: repair services (including
laboratories contribute another 2,073 jobs, auto repair), personal services (such as hair
computer systems design and related services styling and laundry services), membership
grows by 590 jobs, and specialized design organizations, and private household workers.
services add 544 jobs. We expect that this sector will expand modestly
over the forecast period, adding a total of 487
jobs.
20 2019–2021 Economic Outlook for Oakland CountyFigure 11
Unemployment Rates for Oakland County and for the United States, 1990–2021
The healthy job growth we are forecasting for There are two major forces affecting the growth
Oakland County drives unemployment to of Oakland County’s labor force. On the one
continue its decline through 2021. The local hand, the strong labor market is encouraging
unemployment rate falls from 3.3 percent in previously discouraged workers to seek out
2018 to 2.7 percent in 2019 and 2.6 percent in work. On the other hand, demographic factors,
2020 and 2021. such as retirements among the baby boomers,
put downward pressure on the labor force
The 2.6 percent unemployment rate we are participation rate. We see those two forces
forecasting in 2020 and 2021 would tie roughly offsetting each other over the next few
Oakland’s lowest rate on record, achieved in years, leading to middling growth of the labor
the year 2000. force.
The county’s labor force inched up by a tenth of Oakland’s unemployment rate of 3.3 percent
a percentage point in 2018 after averaging was six-tenths of a percentage point lower than
growth of 2.4 percent per year in 2016 and the U.S. rate of 3.9 percent in 2018. We expect
2017. We expect labor force growth to rebound that gap to widen to a full percentage point each
after 2018’s weak showing to a rate of 2.2 year from 2019 to 2021, as the unemployment
percent in 2019, after which it will slow to a rate nears historical lows in both Oakland and
more sustainable average annual rate of 1.1 the United States.
percent in 2020 and 2021.
Presentation Review 21Figure 12
Average Real Wage in Oakland County by Selected Industry Group, 1990–2021
Here we present the average real wage in From 2013 to 2017, real wages increased by an
Oakland County for the years 1990–2021, average of 1.7 percent per year, buoyed by low
adjusted for inflation and expressed in 2017 consumer price inflation, bringing average real
dollars. We display the average real wage wages to $61,536 in 2017.
across all industries as well as for three broad
industry categories: (1) traditional blue-collar Somewhat higher price inflation of 2.4 percent
industries such as manufacturing, construction, in 2018 converted a nominal wage increase of
mining, and transportation; (2) service- 3.0 percent into a real wage gain of only 0.6
providing industries that tend to employ percent.
workers with higher educational attainment,
such as government, health services, Real wage growth rebounds to 1.6 percent in
professional services and corporate 2019 with a slowdown in inflation, before
headquarters, wholesale trade, financial settling in at about a 0.7 percent annual growth
activities, and information; and (3) lower- rate in 2020 and 2021 as inflation picks up.
educational-attainment service-providing
industries such as retail trade, leisure and Over the next three years, we are forecasting
hospitality, business services such as that real wages will increase by a total of 2.8
temporary help, and repair and personal percent in blue-collar and lower-education
services. services industries, and by 2.7 percent in
higher-education services industries.
The average inflation-adjusted wage rose in all
major industry sectors from 1990 to 2000. The Despite this growth, in 2021, real wages in the
overall average real wage increased by 1.8 blue-collar industries will remain 1.4 percent
percent per year, from $52,888 in 1990 to below their 2003 peak levels, and wages in
$63,369 in 2000. lower-education services industries will remain
1.9 percent below their 2001 peak levels. On
Average real wages then entered a long period, the other hand, real wages in higher-education
from 2000 to 2013, in which they trended services industries will climb 1.3 percent above
downwards, hitting a low point of $57,622 in their previous peak levels achieved in 2000.
2013. That level was 9.1 percent lower than in
2000.
22 2019–2021 Economic Outlook for Oakland CountyAppendix A
Forecast of Jobs in Oakland County by Detailed Industry Division
Estimate Forecast Average Annual Wage
2018 2019 2020 2021 2017
TOTAL PAYROLL JOBS (Number of persons) 737,602 747,948 758,890 769,172 61,536
(Annual percentage change) 1.3 1.4 1.5 1.4 N.A.
TOTAL GOVERNMENT 45,417 45,876 46,816 46,933 53,785
Federal government 4,720 4,704 5,069 4,702 69,535
Postal service 3,782 3,791 3,820 3,850 63,934
Federal government NEC 938 913 1,250 852 92,504
State and local government 40,697 41,172 41,747 42,231 51,918
Local libraries 564 578 590 605 21,713
Local education and health services 22,360 22,559 22,912 23,177 52,581
Elementary and secondary schools 20,590 20,782 21,137 21,403 53,450
Other education and health services 1,769 1,776 1,775 1,773 43,096
Local public administration 13,102 13,333 13,495 13,650 50,226
State and other local government 4,671 4,703 4,750 4,800 57,064
TOTAL PRIVATE 692,184 702,073 712,074 722,239 62,047
GOODS-PRODUCING 94,383 95,804 96,945 97,881 79,414
Natural resources and mining 843 849 863 875 33,381
Agriculture, forestry, fishing, and hunting 677 685 699 710 26,092
Mining, quarrying, and oil and gas extraction 165 163 164 165 61,259
Construction 26,218 26,946 27,644 28,310 72,427
Construction of buildings 6,700 6,777 6,927 7,067 76,334
Residential 3,163 3,259 3,352 3,444 65,590
Nonresidential 3,537 3,519 3,574 3,622 85,634
Heavy and civil engineering construction 2,267 2,332 2,398 2,448 84,064
Specialty trade contractors 17,251 17,836 18,319 18,795 69,382
Building foundation and exterior 2,559 2,638 2,685 2,760 61,958
Building equipment 9,598 9,905 10,160 10,401 74,924
Building finishing 2,930 3,037 3,148 3,250 58,656
Other specialty trade contractors 2,164 2,257 2,326 2,385 66,823
Manufacturing 67,322 68,010 68,438 68,697 82,674
Food 1,775 1,824 1,896 1,979 39,663
Textile products 166 162 161 160 29,408
Wood products 161 158 156 155 69,831
Paper products 442 458 451 443 67,742
Printing and related support activities 2,015 2,003 1,984 1,962 65,034
Chemicals 3,744 3,823 3,894 3,961 95,690
Plastics and rubber products 3,926 3,948 3,934 3,904 53,366
Nonmetallic mineral products 1,086 1,056 1,040 1,023 68,824
Primary metals 1,380 1,371 1,363 1,354 143,509
Fabricated metals 10,357 10,392 10,290 10,112 61,646
Forging and stamping 1,185 1,214 1,226 1,231 60,162
Architectural and structural metals 665 634 626 569 54,967
Machine shops and threaded products 3,085 3,028 2,954 2,873 65,718
Coating, engraving, and heat treating metals 2,056 2,105 2,057 2,001 49,968
Other fabricated metals 1,837 1,871 1,903 1,931 67,241
Fabricated metals NEC 1,530 1,540 1,525 1,507 65,228
Machinery 11,565 11,623 11,720 11,795 83,196
Industrial machinery 714 676 669 661 87,305
Commercial and service industry machinery 858 918 969 1,021 52,919
Metalworking machinery 6,085 6,062 6,094 6,115 81,146
Turbine and power transmission equipment 488 490 484 478 82,464
Other general purpose machinery 3,146 3,209 3,240 3,259 95,701
Machinery NEC 274 268 265 261 60,709
Presentation Review 23Appendix A
Forecast of Jobs in Oakland County by Detailed Industry Division (cont’d)
Estimate Forecast Average Annual Wage
2018 2019 2020 2021 2017
Computer and electronic products 3,077 3,093 3,128 3,157 75,786
Electrical equipment, appliances, components 1,069 1,047 1,042 1,034 78,820
Transportation equipment 21,829 22,101 22,273 22,398 105,481
Motor vehicle bodies and trailers 1,048 1,068 1,087 1,112 117,229
Aerospace products and parts 1,087 1,112 1,111 1,109 82,354
Transportation equipment NEC 19,693 19,921 20,074 20,177 106,269
Furniture and related products 547 558 570 579 56,964
Miscellaneous manufacturing 3,302 3,450 3,575 3,698 58,151
Medical equipment and supplies 575 574 570 565 58,635
Other miscellaneous manufacturing 2,727 2,876 3,005 3,133 58,034
Manufacturing NEC 882 941 962 982 46,338
PRIVATE SERVICE-PROVIDING 597,801 606,268 615,128 624,357 59,302
Trade, transportation, and utilities 130,449 131,390 132,304 133,328 54,477
Wholesale trade 37,369 37,672 38,096 38,540 96,191
Merchant wholesalers, durable goods 26,994 27,264 27,619 27,993 96,673
Motor vehicles and parts 6,868 7,053 7,268 7,491 98,089
Commercial equipment 4,626 4,576 4,549 4,530 114,331
Electric goods 5,133 5,160 5,155 5,148 108,285
Machinery and supply 5,645 5,762 5,914 6,065 89,227
Merchant wholesalers, durable goods NEC 4,722 4,712 4,733 4,759 73,500
Merchant wholesalers, nondurable goods 7,501 7,560 7,639 7,721 82,566
Wholesale electronic markets, agents, brokers 2,874 2,848 2,837 2,827 113,335
Retail trade 79,289 79,551 79,753 80,033 34,838
Motor vehicle and parts dealers 11,622 11,909 12,069 12,221 63,707
Furniture and home furnishings stores 2,617 2,610 2,621 2,632 38,814
Electronics and appliance stores 4,657 4,661 4,645 4,637 53,592
Building material and garden supply dealers 6,643 6,685 6,601 6,513 40,565
Food and beverage stores 13,410 13,370 13,427 13,507 24,315
Health and personal care stores 7,179 7,388 7,508 7,626 36,242
Gasoline stations 2,269 2,270 2,298 2,326 21,163
Clothing and clothing accessories stores 7,360 7,224 7,172 7,151 20,092
Sporting goods, hobby, book, and music stores 2,852 2,804 2,788 2,784 25,985
General merchandise stores 14,572 14,419 14,320 14,256 25,024
Miscellaneous store retailers 4,884 4,976 5,067 5,142 27,375
Nonstore retailers 1,225 1,235 1,236 1,238 63,065
Transportation and warehousing 12,297 12,659 12,934 13,218 49,586
Truck transportation 3,747 3,767 3,833 3,897 59,152
Couriers and messengers 2,287 2,324 2,353 2,380 44,654
Warehousing and storage 1,511 1,582 1,604 1,624 59,576
Transportation and warehousing NEC 4,751 4,986 5,144 5,317 40,813
Utilities 1,495 1,508 1,522 1,536 118,138
Information 14,946 15,124 15,192 15,270 80,946
Publishing (except Internet) 3,843 3,870 3,835 3,786 96,490
Newspaper, book, and directory publishers 1,376 1,300 1,234 1,170 72,940
Software publishers 2,467 2,569 2,601 2,616 110,485
Motion pictures and sound recording 1,918 1,877 1,894 1,907 33,703
Motion picture and video production 447 391 382 374 68,979
Motion picture and video exhibition 1,356 1,370 1,395 1,415 12,117
Motion pictures and sound recording NEC 115 116 118 119 86,050
Broadcasting (except Internet) 1,484 1,491 1,516 1,541 93,091
Telecommunications 4,776 4,840 4,788 4,752 80,326
Data processing, hosting, and related services 1,747 1,835 1,890 1,942 84,912
Information NEC 1,179 1,212 1,268 1,342 94,827
24 2019–2021 Economic Outlook for Oakland CountyAppendix A
Forecast of Jobs in Oakland County by Detailed Industry Division (cont’d)
Estimate Forecast Average Annual Wage
2018 2019 2020 2021 2017
Financial activities 53,751 54,608 55,451 56,306 83,436
Finance and insurance 37,262 37,759 38,240 38,730 97,254
Credit intermediation and related activities 16,504 16,783 16,945 17,091 88,413
Depository credit intermediation 8,989 8,986 8,985 8,988 87,049
Commercial banking 6,751 6,755 6,758 6,765 95,160
Depository credit intermediation NEC 2,238 2,231 2,227 2,223 62,495
Nondepository credit intermediation 6,098 6,316 6,440 6,544 93,809
Real estate credit intermediation 3,177 3,341 3,442 3,528 79,324
Nondepository credit intermediation NEC 2,921 2,975 2,999 3,017 107,500
Activities related to credit intermediation 1,418 1,481 1,520 1,559 74,801
Securities, commodity contracts, investments 4,519 4,575 4,648 4,724 162,428
Insurance carriers and related activities 16,071 16,233 16,475 16,740 88,130
Insurance carriers 7,978 8,014 8,096 8,194 94,359
Direct property and casualty insurers 2,391 2,405 2,417 2,429 92,924
Insurance carriers NEC 5,588 5,608 5,679 5,764 94,960
Insurance agencies, brokerages, and related 8,093 8,219 8,379 8,546 81,482
Insurance agencies and brokerages 5,596 5,709 5,846 5,989 82,176
Other insurance-related activities 2,497 2,510 2,533 2,557 79,874
Finance and insurance NEC 167 169 172 175 121,542
Real estate and rental and leasing 16,490 16,849 17,212 17,577 52,835
Real estate 12,907 13,191 13,484 13,784 53,428
Lessors of real estate 5,331 5,346 5,394 5,443 51,083
Offices of real estate agents and brokers 1,401 1,451 1,507 1,550 53,274
Activities related to real estate 6,175 6,394 6,583 6,792 55,621
Rental and leasing services 3,423 3,496 3,562 3,622 47,668
Lessors of nonfinancial intangible assets 159 161 166 170 91,507
Professional and business services 187,339 189,809 192,582 195,307 76,995
Professional and technical services 103,944 106,481 108,728 110,925 91,429
Legal services 12,431 12,570 12,749 12,928 92,002
Accounting and bookkeeping services 6,418 6,570 6,662 6,737 69,765
Architectural and engineering services 39,433 40,674 42,071 43,485 102,085
Architectural services 1,398 1,405 1,440 1,474 86,642
Engineering services 21,281 21,906 22,537 23,142 93,987
Testing laboratories 16,221 16,814 17,531 18,294 115,003
Engineering services NEC 533 549 563 575 74,810
Specialized design services 2,673 2,813 3,006 3,217 115,446
Computer systems design and related services 22,099 22,481 22,616 22,688 89,025
Management and technical consulting services 8,738 8,898 8,986 9,077 85,253
Scientific research and development services 1,260 1,253 1,283 1,310 138,465
Advertising, PR, and related services 4,507 4,522 4,512 4,495 72,592
Other professional and technical services 6,387 6,701 6,843 6,988 60,017
Management of companies and enterprises 18,364 18,590 18,784 18,751 124,769
Administrative support and waste management 65,031 64,739 65,070 65,632 43,089
Administrative and support services 63,635 63,345 63,663 64,211 42,613
Office administrative services 4,045 4,006 4,035 4,086 55,403
Employment services 28,499 28,326 28,107 28,034 48,348
Business support services 8,473 8,650 8,804 8,955 42,977
Investigation and security services 5,385 5,334 5,394 5,454 33,155
Services to buildings and dwellings 13,176 12,927 12,994 13,126 28,621
Other support services 2,851 3,011 3,229 3,448 46,893
Administrative and support services NEC 1,206 1,091 1,100 1,108 46,159
Waste management and remediation services 1,396 1,394 1,408 1,421 64,681
Presentation Review 25You can also read