Economic Risk Assessment of Climate Change at the Urban Scale: The Case of Cape Town, South Africa - Preprints.org
←
→
Page content transcription
If your browser does not render page correctly, please read the page content below
Preprints (www.preprints.org) | NOT PEER-REVIEWED | Posted: 2 March 2021                      doi:10.20944/preprints202103.0099.v1

              Article

              Economic Risk Assessment of Climate Change at the
              Urban Scale: The Case of Cape Town, South Africa
              Martin P. de Wit 1*, Jonty Rawlins2 and Belynda Petrie3
                1 Stellenbosch University, School of Public Leadership, Private Bag X1, Matieland, 7602, South Africa;
                  mdewit@sun.ac.za
                2 Sustainable Development Africa, Cape Town, South Africa; jrawlins@outlook.com

                3 OneWorld Sustainable Investments (OneWorld), PO Box 1777, Cape Town, 8001, South Africa;

                  belynda@oneworldgroup.co.za
                * Correspondence: mdewit @sun.ac.za

              Abstract: Estimating the economic risks of climate shocks and climate stressors on spatially
              heterogeneous cities over time remain highly challenging. The purpose of this paper is to present a
              practical methodology to assess the economic risks of climate change in developing cities to inform
              spatially sensitive municipal climate response strategies. Building on a capital-based framework
              (CBF), spatially disaggregated baseline and future scenario scores for economic wealth and its
              exposure to climate change are developed for six different classes of capital and across 77 major
              suburbs in Cape Town, South Africa. Capital-at-risk was calculated by combining relative exposure
              and capital scores across different scenarios and with population impacted plotted against the major
              suburbs and the city’s 8 main planning districts. The economic risk assessment presented here
              provides a generic approach to assist investment planning and the implementation of adaptation
              options through an enhanced understanding of relative levels of capital endowment vis-à-vis relative
              levels of exposure to climate-related hazards over time. An informed climate response strategy in
              spatially heterogeneous cities need to include spatially sensitive estimates on capital-at-risk and
              populations disproportionally impacted by climate exposure over time. The economic risk
              assessment approach presented here helps in advancing to such a goal.

                Keywords: Economic risk assessment, capital-based framework, six-capital framework, climate
                response, climate adaptation, urban resilience

            © 2021 by the author(s). Distributed under a Creative Commons CC BY license.
Preprints (www.preprints.org) | NOT PEER-REVIEWED | Posted: 2 March 2021             doi:10.20944/preprints202103.0099.v1

               Author Biographies

               Martin de Wit is Professor: Environmental Governance at Stellenbosch University. He received his
               DCom degree at the University of Pretoria in 2001. His research is organised around an economic
               approach to environmental management and policy and follows an interdisciplinary approach with
               other experts in the fields of climate change, biodiversity and ecosystem services, waste
               management, energy transitions and ecological restoration. Martin serves as a regional coordinator
               for the African Association of Environmental and Resource Economists (AfAERE).

               Jonty Rawlins is a sustainable development consultant and director at Sustainable Development
               Africa. He received an MSc in Water Science, Policy and Management from Oxford University in
               2017 and an MSc in Economics from Rhodes University in 2016. His work and research are focused
               on practical and theoretical approaches to sustainable development and environmental
               management, with a particular focus on climate change, water resources management, biodiversity
               conservation, ecosystem services and equitable socio-economic development.

               Belynda Petrie is co-founder and CEO of OneWorld Sustainable Investments and a PhD candidate
               at the University of Cape Town, where she is developing a thesis on regional integration and
               transboundary water governance and security. Her works spans policy and strategy developing in
               climate change response, water and energy security, and urban resilience, across Africa and Asia.
               She serves as a member of the Science Programme Committee for World Water Week and advises
               on climate finance on various boards, including the Alliance for Global Water Adaptation, and the
               recently launched Continental Africa Water Investment Programme.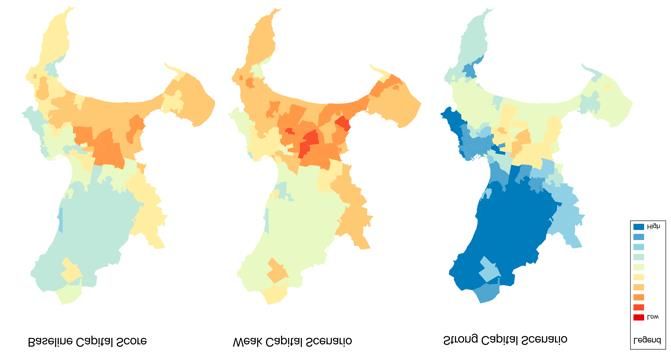
Preprints (www.preprints.org) | NOT PEER-REVIEWED | Posted: 2 March 2021                doi:10.20944/preprints202103.0099.v1

              1. Introduction

                    Risk assessment of climate variability, climate change and natural disasters tend to focus on the
              hazards itself, exposure to the hazards and vulnerability to inform disaster risk management [1].
              Climate change risk assessment focuses on the consequences, likelihood and responses to the impacts
              of climate change [2] and is conceptualized as a “fundamental interaction of the physical risk with
              the societal process of prioritizing, avoiding harm and making legitimate decisions” [2] (p.10).
              Economic assessments in urban contexts generally compare costs and benefits for the impacts of and
              responses to climate change, and have focused on specific risks such as flooding [3] and fire [4], on
              infrastructure development [5], on climate adaptation options [6,7] and on city policies to respond to
              climate change impacts [8]. Yet, of particular concern in this paper is how socioeconomic
              development at the full urban spatial scale is affected by climate change, and how this informs climate
              response strategies at the urban level - with specific reference to Cape Town. Scenario development
              is one approach that helps to construct narratives on impacts and costs for alternative futures under
              climate change, but lacks the detailed quantification of costs and spatial resolution needed for more
              directed responses [7]. As cities are confronted with a loss of economic wealth due to climate change
              impacts, economic risk assessments would theoretically require a probabilistic and spatially sensitive
              integrative modelling approach on an urban scale [9] - an approach especially relevant for spatially
              heterogenous, highly unequal and developing cities in emerging economies like Cape Town.
              Accounting for spatially sensitive interlinkages and indirect damages and losses in economic
              assessments on an urban level would require spatially sensitive macroeconomic tools, which in turn
              are reliant on updated input-output tables or social accounting matrices– all requirements that are
              not always readily available at an urban level [10], especially in developing cities. Published
              quantitative economic assessments of climate risk generally tend to focus on global, national or
              regional levels, with only a few studies attempting to examine climate risk at the urban scale [10].
              Despite some progress, “…accurate quantitative assessment of city-specific climate change risk
              remains highly challenging” [10] (p. 10). The absence of sufficient data and of reliable quantitative
              economic assessment models at an urban scale, necessitates alternative practical approaches to
              support decision-making on climate change at the urban level.

                   City managers are faced with the question of how to allocate scarce resources over space and
              time across multiple competing priorities, including climate risks. Decisions have to be made in
              contexts of high spatial heterogeneity in biophysical impact and socio-economic vulnerability, and
              climate risks that may vary significantly over time. There is thus a need for a robust, practical and
              spatially sensitive screening tool that highlights the economic wealth-at-risk under various climate
              scenarios which can be used to inform climate response strategies. The approach followed here is to
              link model results on climate exposure at the urban level with various categories of capital indicators
              as approximations for a city’s economic wealth. One of the challenges is to develop a realistic and
              balanced selection of indicators, which does bring issues of selection and weighing, but, as must be
              stated from the onset, for which there is “no scientifically valid solution” [11] (p 167).

                   A Hazard, Vulnerability and Risk Assessment (HVRA) conducted for Cape Town identified key
              climate driven risks (stressors and shocks) by modelling climate change indicators over time [12]. The
              assessment created a vulnerability index to determine different levels of risk and resilience across
              different spatial locations across Cape Town. Specifically, the HVRA anticipates a drier and warmer
              climate for the Cape Town, while the top climate-related hazards facing the city include drought, fire,
              heatwaves, floods and strong winds. The water supply system in the Western Cape Province, which
              supplies Cape Town with the majority of its bulk water requirements, faces significant risk from
              repeated drought events, with indirect impacts of a water availability crisis affecting the economy,
              environment and people of Cape Town. An earlier study on changes in rainfall and precipitation
              likewise included forecasts of a decrease in wet days, an increase in dry spells and a decrease in
              annual precipitation [13]. Combined with increased temperatures and evaporation, decreased water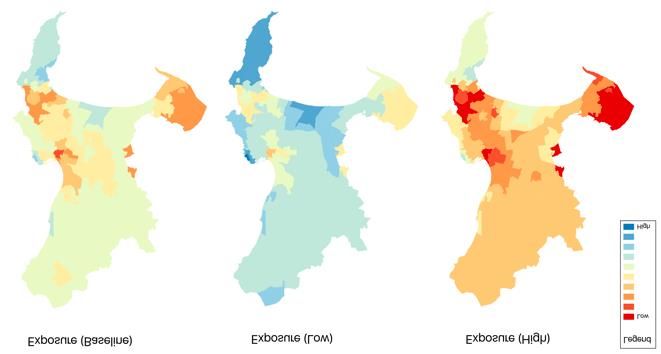
Preprints (www.preprints.org) | NOT PEER-REVIEWED | Posted: 2 March 2021                    doi:10.20944/preprints202103.0099.v1

              availability in the medium to long term is probable and changes to Cape Town’s water resource
              management regime in the light of climate change is necessary and ongoing [14]. Moreover, fires pose
              a direct impact to human life and assets. Informal settlements are also more vulnerable to increased
              flooding and risk of fires given their location and limited access to services and resources [15]. The
              climate risk to Cape Town as a coastal city further includes sea-level rise which threatens
              infrastructure as well as the real estate and tourism industries [16]. With much of Cape Town’s
              industrial, commercial and residential areas lying below 10m above sea-level, sea-level rise increases
              the vulnerability of beaches and coastal developments in the city. Improved storm water strategies
              may be necessary as sea-level rise, storm surge and heavy rainfall are projected to exacerbate water
              pollution, compromise drinking water and damage coastal treatment plants [17].

                    While the nature and physical impact of climate shocks and stressors to a city have been
              determined using a HVRA, the quantification of economic risks of climate change remains necessary.
              The methodology proposed here is to follow a “capital-based framework”[18] (CBF) in support of an
              assessment of climate risks to the urban economy as a whole. The CBF overlaps with, but differs in
              many respects from the Capital Theory Approach (CTA) advanced in economic theory [19,20], which
              has been developed into indicators for sustainability in its weak [21,22] and strong [23,24] forms and
              promoted as a tool for sustainability policy [25,26]. In such a way of thinking the urban economy is
              portrayed in terms of the different types of capital (or assets) that provide a flow of benefits or services
              to the economy and society; that is they are defined as “productive assets available to the economy”
              [27] (p, 149). Sustainability is then defined as maintaining a constant aggregate capital stock over time
              [20,28]. The decision-rule to achieve sustainability would be that once capital is used to produce or
              consume, the rents (over and above an acceptable level of profit) should be re-invested to ensure that
              the same level of capital will be available for posterity. Questions on the relative importance of
              various categories of capitals in economic growth and development, and the substitutability between
              these capitals has dominated much of the literature on the CTA to sustainability and its critics [27,28].
              In this paper we start with the same premise as in the CTA, namely that certain productive assets are
              available to the economy but argue for a more inclusive and comprehensive representation of all
              capital asset categories in advancing our ability to respond to climate risks in urban economies. As
              market prices often do not include the damages caused by excessive productivity in one capital
              category on others (e.g. environmental damage or decline in social fabric as a result of excessive
              financial accumulation or exploitative labour practices), market prices cannot be treated as a
              satisfactory benchmark for calculating the aggregate value for each type of capital. It follows that the
              relative importance of each of the capitals cannot singularly be derived from a particular model of
              the economy. Furthermore, as we are not following a modelling approach in this paper, the otherwise
              very important question on substitutability between the capitals over time is excluded from our
              analysis. Therefore, although there are important overlaps with the CTA, most notably that the stocks
              of capital need to be maintained over time to achieve sustainability, our approach cannot be
              categorized as such.

                    Our study applied a six capitals framework (financial, manufactured, human, intellectual, social,
              natural) to provide a holistic view of economic wealth at risk due to climate events and stressors. The
              six capitals framework has been developed conceptually in the field of integrated accounting [29] and
              applied in various forms in fields such as corporate social responsibility (CSR) [30] and rural
              development [31]. In the field of climate adaptation, multiple capital framework approaches have
              been applied to measuring coping and adaptive capacity in cities before [32].

                   The purpose of this paper is to develop a practical and spatially sensitive economic risk
              assessment approach to climate change at an urban scale. This will be achieved by developing a set
              of spatially sensitive indicators on six capitals at risk in an urban context, coupled with scenarios on
              how they are likely to be affected across various levels of climate exposure. We expect that the
              development of such an approach will enhance decision-making on climate risk at an urban scale,
              especially in cities characterized by large spatial and socio-economic inequalities.
Preprints (www.preprints.org) | NOT PEER-REVIEWED | Posted: 2 March 2021 doi:10.20944/preprints202103.0099.v1
2. Materials and Methods
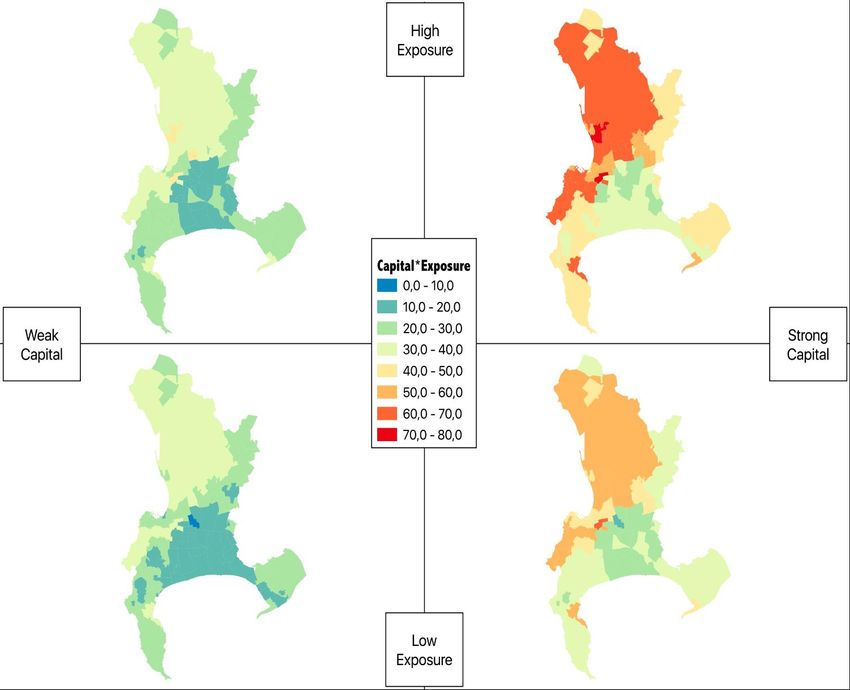
2.1 Case study: Cape Town
The city of Cape Town, located on the south-western tip of South Africa, is the country’s second
most populous city and the economic hub of the Western Cape Province (See Fig. 1 for a map). Cape
Town is well-known for its harbour, natural environment (within the world-renowned Cape Floristic
Region), and for landmarks such as Table Mountain and Cape Point. However, like most of South
Africa, the socio-economic dynamics of Cape Town present a story of stark inequality. According to
Statistics South Africa, almost 36% of the population of the city live below of the poverty line, with a
dependency ratio in excess of 43% [33]. These inequalities manifest clearly in the spatial distribution of
the population, a legacy of the Apartheid era spatial planning policies. Cape Town also faces a variety
of climate change challenges including significant increases in temperature, long-term decreases in
rainfall, changes in rainfall seasonality, more extreme heat days and heatwaves, and coastal erosion
[12]. The combination of these climate change threats and the prevailing socio-economic dynamics
present a complex risk scenario exacerbated by climate change.
Figure 1: Map of Cape Town
Source: Esri, CGIAR | Esri South Africa, Esri, HERE, Garmin, FAO, METI/NASA, USGS.
2.2 Scenarios used
Climate change related hazards occur at two distinct time scales, namely as events and
disasters in the short term (climate shocks) and as gradual changes over longer time periods
(climate stressors). Future risk pathways between climate change and the economy are
conceptualized to include both climate exposure (incl. climate shocks and stressors) as well asPreprints (www.preprints.org) | NOT PEER-REVIEWED | Posted: 2 March 2021 doi:10.20944/preprints202103.0099.v1
projections of economic wealth at risk as measured on a scale of weakest to strongest indicators
for each of the six capitals and their equally weighted aggregates. The outcome is that four
spatially explicit scenarios are used to illustrate alternative futures for (i) high and low bound
climate exposure and (ii) weak and strong capital projections.
2.3 Indicators and data used
The following six forms of capital are included in our economic risk assessment:
• Financial capital: The pool of funds available including debt, equity and grants
generated through private and public operations and investments.
• Manufactured (durable) capital: Includes tools, machinery, buildings, equipment and
other infrastructure (roads, bridges, ports, railways, and water and treatment plants).
• Human capital: Investment in skills, education and training determining the
individual’s competencies, capabilities, training and overall productivity.
• Intellectual capital: Intellectual property (patents, software, copyrights and licenses),
organizational capital (tacit knowledge, protocols and systems) and other intangibles
(city brand and reputation).
• Social capital: Institutions and customs organizing economic activity (shared norms,
common values, non-physical culture, trust and willingness to engage).
• Natural capital: Natural systems including atmosphere, lithosphere, hydrosphere and
biosphere.
Typical indicators and metrics for each of the six types of capitals were developed and are
included in Appendix A. As not all indicators were equally well spatially developed in the City of
Cape Town’s databases, a representative set of indicators were tested and adopted with participants
from the City of Cape Town’s management. The main indicators that were selected and how they are
measured for each capital category are included in Table 1.
2.4 Economic Risk Assessment
2.4.1 Economic Risk Analysis Methodology
Risk assessment traditionally involves an estimation of the magnitude of potential consequences
or the levels of impacts, and the likelihood or the levels of probability of such impacts happening. The
spatial and temporal extent of the risks can also be evaluated in such an assessment. We assessed
economic risks based on the outcomes of results from the spatially explicit HVRA [12]. For each climate
shock and stressor (or composite of such stressors and events, i.e. exposure) impacting on the capitals
used in the economy, the economic risks needed to be assessed. The following stepwise approach was
followed:
Step 1: Develop a “baseline” of capitals that are already functional in the city. The output in the
productive economy is dependent on the well-functioning of these six categories of capitals as
measured by selected indicators as indicated in Table 1.
Table 1: Metrics and Projections for Six Capital Indicators
Projections
Capital Main Indicator(s) Measure
(strong/weak)
Total Budget Expenditure
Financial Total Revenue ↑ 2.4 %; ↓ 2.4 %
(Rands)
Human Employment # of Employed People ↑ 5 %; ↑ 2 %Preprints (www.preprints.org) | NOT PEER-REVIEWED | Posted: 2 March 2021 doi:10.20944/preprints202103.0099.v1
Natural Ecosystem Functioning Ecosystem Services Index* ↑ 3 %; ↓ 3 %
Social Crime Rate # of crimes ↓ 2 %; ↑ 2 %
Residential Property
Mean Property Value (Rands) ↑ 10 %; ↑ 5 %
Value
Commercial and
Manufactured Mean Property Value (Rands) ↑ 10 %; ↑ 5 %
Industrial Property Value
Access to Critical Mean Travel Time to Hospitals
↑ 2 %; ↓ 2 %
Infrastructure and Fire Stations (Minutes)
# of People with Higher
Intellectual Education Levels ↑ 3 %; ↑ 1 %
Education
Note: *An index value was used to represent natural capital rather than an individual lead
indicator because of the variety of ecosystem types that function within the urban extent of
Cape Town. This index represents a combination of ecosystem intactness and integrity
indicators for biodiversity, forestry and watercourses and wetlands.
Step 2: Develop alternative futures for the capitals on a continuum of relatively weak capital
functioning to strong capital functioning over time. Two future projections were generated for each
capital indicator to represent a realistic ‘strong’ and ‘weak’ capital future. The last column in Table 1
illustrates the strong and weak projections for the six capital categories. The projections were based
on historical trends for these variables and the extent of realistic worst case and best-case projections.
The data used to represent each capital metric was projected until 2030 and normalized against a
range from 0 – 1, to ensure commensurability of the different metrics. An overall capital score was
derived by equally weighing the six capital scores. To ensure spatial commensurability and to ensure
that the spatial dimensions align closely with the approach followed in the HVRA, all capital scores
were computed at the ‘Major Suburb’ level in Cape Town. A map of the ‘Major Suburbs’ in Cape
Town is included in Appendix B (Normalized capital scores per major suburb are included in the
Supplementary Material to this paper).
Step 3: Overlay projections on alternative climate change exposure futures with projections on
alternative capital futures to identify areas where the economy, as measured through the indicators for
capitals, is at relatively higher and lower risk in the short to medium future. The overall weighted
capital score was combined with the medium term-future exposure index variables (derived from [12])
to indicate the areas where capital is most at risk within Cape Town. Table 2 outlines the different
exposure variables that determines the exposure index, as well as approximated high and low bounds
of uncertainty associated with mid-term future projections on these exposures. Uncertainty bounds
were used to develop measures of high and low exposure for the mid-term future.
Table 2: Exposure Index Variables and Medium-Term Exposure Bounds
Medium Term Exposure
Exposure Variables
High Bound Low Bound
Average, maximum and
↑ 3 °C ↑ 1 °C
minimum temperature
Very hot days ↑ 20 Days ↑ 0 Days
Heat-wave days ↑ 10 Days ↑ 0 Days
High fire-danger days ↑ 20 Days ↑ 0 Days
Rainfall ↓ 120 mm ↓ 60 mm
Extreme rainfall ↓ 3 Days ↓ 0 Days
Source: Based on [12]Preprints (www.preprints.org) | NOT PEER-REVIEWED | Posted: 2 March 2021 doi:10.20944/preprints202103.0099.v1
Step 4: A combined capital and exposure assessment was undertaken for four different
spatially explicit scenarios, namely:
- scenario 1: high bound climate exposure; weak capitals
- scenario 2: high bound climate exposure; strong capitals
- scenario 3: low bound climate exposure; weak capitals
- scenario 4: low bound climate exposure; strong capitals
2.4.2 Capital-at-Risk
Capital-at-Risk for each of the ‘Major Suburbs’ was derived by combining relative exposure and
capital scores for all scenarios as per the following equation:
Capital-at-Risk = Exposure Score * Capital Score (1)
3. Results
3.1 Six Capitals Assessment
Figure 2 shows the maps illustrating the aggregate result for the relative strength of all capital
types across baseline, weak and strong capital projections for each of the 77 ‘Major Suburbs’ in Cape
Town. Appendix C presents both the baseline capital and exposure scores classified from high to
medium to low.
A broad pattern of higher baseline capital scores across the Western and Atlantic seaboards
from Cape Farms North down to Cape Point occurs. In contrast, the central and eastern areas of
Cape Town display generally lower capital scores. In future projections of weak and strong growth
in the various capitals, the rank order of suburbs remains largely the same over time.
Figure 2: Baseline and Medium-Term Future Capital Scores by Major Suburb in Cape Town
Baseline Capital Score Weak Capital Projection Strong Capital ProjectionPreprints (www.preprints.org) | NOT PEER-REVIEWED | Posted: 2 March 2021 doi:10.20944/preprints202103.0099.v1
It is interesting to note which capitals score the highest in the various suburbs as depicted in
Table 3. Much variation occurs between the types of capital that dominate in the various suburbs,
highlighting the value of utilising a holistic six capital framework in the assessment.
Table 3: Top 5 baseline capital scores per suburb
Score
Human Natural Social Manufactured Intellectual
Rank
Table
Simons Town Observatory
1 Langa (0,5) Mountain Table View (0,82)
(0,8) (0,72)
(0,85)
Signall Hill/
Melkbosch
2 Delft (0,35) Lion’s Head Cape Town (0,61) Blouberg (0,55)
Strand (0,56)
(0,82)
Cape Farms Cape Point
3 Gugulethu (0,33) Sea Point (0,61) Plattekloof (0,5)
South (0,79) (0,32)
Cape Point Cape Farms Rondebosch
4 Blue Downs (0,30) Pinelands (0,51)
(0,77) North (0,17) (0,43)
Kalksteenfontein Camp’s Bay Durbanville Paarden Eiland
5 Newlands (0,42)
(0,30) (0,7) (0,16) (0,5)
Note: Financial capital excluded (for full listing for each of capitals across the 77 major suburbs see the
Supplementary Material).
3.2 Climate Exposure Assessment
Different capital stocks throughout Cape Town are exposed to relatively different levels of
climate stressors and shocks in space and over time. Figure 3 depicts relative levels of exposure to
climate change for the baseline and medium-term future projections respectively. It is important to
note that the variance in climate exposure is relatively small in absolute terms across Cape Town.
As with the aggregate capital scores, exposure is a function of multiple metrics which influence
aggregate levels differently [12]. Broadly, the southern peninsula is less exposed while the central
and eastern areas are more exposed.Preprints (www.preprints.org) | NOT PEER-REVIEWED | Posted: 2 March 2021 doi:10.20944/preprints202103.0099.v1
Figure 3: Baseline and Medium-Term Future Climate Exposure Scores by Major Suburb in Cape Town
High
Low
Note: The colour spectrum used to represent data was chosen to clearly illustrate small discrepancies in climate exposure.
3.3 Capital-at-Risk
Capital-at-Risk combined relative exposure and capital scores in one aggregate score
(aggregate data and descriptive statistics are included in the Supplementary Material). The results
for various scenarios are displayed in Figure 4, presenting the relative spatial distribution of four
scenarios for combined capital and climate exposure scores. Highest capital-at-risk scores are on the
Western and Atlantic seaboards from Cape Farms North down to Hout Bay and Simon’s Town as
well as Gordon’s Bay in the east. In contrast, the central eastern areas of Cape Town display
generally lower capital-at-risk scores. These scenarios represent the best and worst mid-term future
positions based on currently available data. Intuitively, scenario 3 (weak capital growth and a low
exposure to climate change) leads to the least risk to capital across the city, whilst scenario 4 (strong
capital growth and a high exposure to climate change) leads to the greatest risk to capital.
Appendix C provides further detail on the baseline capital scores and exposure across each of the
Major Suburbs in Cape Town.
Figure 4: Capital-at-Risk Across Capital and Exposure ScenariosPreprints (www.preprints.org) | NOT PEER-REVIEWED | Posted: 2 March 2021 doi:10.20944/preprints202103.0099.v1
When explicitly disaggregating on a ‘Major Suburb’ level, Figure 5 presents Capital-at-Risk as a
scatter plot of baseline capital scores and baseline levels of exposure to climate change. The size of
the circles indicates relative population densities in each of the 77 ‘Major Suburbs’ colour-coded for
each of the 8 planning districts in the City of Cape Town. There is a clear general trend across the city
showing areas of higher population (depicted by relatively larger circles) correlating with lower
capital scores and medium to higher levels of exposure.
Figure 5: Capital-at-Risk by Major Suburb in Cape TownPreprints (www.preprints.org) | NOT PEER-REVIEWED | Posted: 2 March 2021 doi:10.20944/preprints202103.0099.v1
4. Discussion and conclusion
Accurate quantitative economic assessments of urban scale climate risk in spatially
heterogeneous settings remains highly challenging. Our aim was to develop a practical and spatially
sensitive approach to economic risk assessment of climate change at the urban scale that informs
decision-making on climate responses in spatially heterogeneous cities - with specific reference to
Cape Town. We believe that the approach presented here is conceptually simple, flexible and broadly
implementable if (i) climate exposure is understood at the city scale and (ii) if spatial datasets on
selected indicators for the six identified capitals are available across city delineations at sufficiently
high resolution – in our case a listing of major suburbs and key planning districts. Assessing the
economic risks of climate change over time is essential for an effective climate response strategy. The
capital-at-risk analysis presented here is designed to provide a spatially robust departure point for
more detailed assessments on how economic risks of climate change may manifest across space and
time. The approach presented is based on best available climate modelling evidence of climate
exposure at the Cape Town urban level [12] and the results have already been used as input to thePreprints (www.preprints.org) | NOT PEER-REVIEWED | Posted: 2 March 2021 doi:10.20944/preprints202103.0099.v1
formulation of Cape Town’s climate response strategy [34]. Here we discuss the main results,
highlight some of the limitations of our approach and make recommendations for future work.
Spatially the suburbs with the highest levels of capital generally have high levels of financial
capital, but with much variation in the levels of manufactured, social, natural, human and intellectual
capital (Table 3 and Supplementary Material). The suburbs with the highest baseline capital score are
generally on the Western seaboard (geographically from Cape Farms North across Table View and
Cape Town to Cape Point in the south). Manufactured capital scores are highest in areas all along
this geographic area, namely Observatory, Cape Town CBD, Sea Point, Pinelands and Paarden
Eiland. When the various capitals are analysed further several notable exceptions to this trend do
appear though. The suburb of Langa has the highest human capital (number of employed people) of
all the suburbs, but relative low levels of all other types of capital (except financial capital reflecting
high levels of budget expenditure in this suburb). Delft, Gugulethu, Blue Downs and
Kalksteenfontein are all suburbs geographically placed towards the entre of Cape Town and score
low on overall capital scores, but are in the top 5 list of human capital in Cape Town. The highest
natural capital scores in the city are to be found in suburbs spanning across Cape Town’s iconic Table
Mountain to Cape Point mountain range as well as on Cape Farms South, but also to the east at
Stellenbosch Farms and Gordon’s Bay. The highest intellectual capital in the city is in Table View and
Blouberg, but also in other areas such as Plattekloof in Tygerberg and Rondebosch and Newlands in
the Southern suburbs. Social capital tends to be relatively low in the city, with Simon’s Town and
Melkbosch Strand and to some extent Cape Point as notable exceptions. What these observations
reveal is that capitals other than financial or manufactured capital are often distributed spatially
differently.
The results on capital-at-risk on a major suburb level clearly indicate where currently the highest
aggregate capital scores overlay with the highest relative climate exposure (upper right area in Figure
5). From an economic risk perspective these are the areas where capital-at-risk is the highest and
which would accordingly inform a spatially sensitive climate response strategy. These areas coincide
strongest with the Blaauwberg, Table Bay and Northern planning districts. As we have
conceptualized a holistic vision of various capitals, it is insightful to note that certain areas with very
high human capital (e.g. Langa) and certain areas with very high natural capital (Table Mountain)
also come out as areas with medium to high capital-at-risk to climate exposure. Cape Farms South
also has very high levels of natural capital, but lower overall capital baseline scores. As these
examples illustrate, investing in the productive value of the economy to minimize risks of climate
exposure would not only focus on protecting infrastructure and maintaining property values, but
would also include investing in the workforce and in a city’s natural assets.
Another important result illustrated in Figure 5 is that a people-centered approach to risk
management would have to recognize not only the productive value of the economy (as measured
through the capitals), but also the population at risk to climate shocks and stressors. In the spatially
heterogeneous city of Cape Town, the results indicate that areas with relative higher population
(indicated by larger circles) are correlated with lower overall capital scores and medium to high
climate exposure (lower half in Figure 5). These areas coincide strongest with the Cape Flats,
Tygerberg and Mitchell’s Plain/Khayelitsha planning districts. The pattern is largely the result of
South Africa’s history of population separation which is still evident in population distributions and
settlement patterns today. These areas have attracted relatively less investment in infrastructure, are
often not formally planned and do not have access to much social or natural capital. Although
government investment in these areas has been increasing over time (as measured by the financial
capital indicator), these areas remain with infrastructure deficits and attract relatively little private
investment. These areas also suffer from relatively higher levels of crime. Not surprisingly, many of
these areas also exhibit low levels of overall resilience to climate change and other crises[12].
Increasing the resilience of a population to climate change is an important part of any climate
response strategy, but on a practical level does raise issues for climate adaptation strategies aimingPreprints (www.preprints.org) | NOT PEER-REVIEWED | Posted: 2 March 2021 doi:10.20944/preprints202103.0099.v1
to be developmental and inclusive [34]. Our approach to view capital holistically rather than
narrowly focused on financial or manufactured capital, is one attempt to ameliorate the gap between
managing the risks to a productive economy and improving the resilience of the people. The "right
kind of growth" and development is needed, namely an inclusive and resilient growth strategy that
reduces the risks of and vulnerability to climate change [35]. For example, investments in property
and infrastructure do need to recognize climate risks, as well as the viability of ecosystem based
adaptations to climate change [7,36].
Although a spatial assessment as presented here gives more granularity for planning purposes
than what the sectoral or economy-wide approaches of macro-economic assessments would allow, a
main limitation of our approach is that it does not account for the myriad of interlinkages and
interdependencies which limit or reinforce the impacts of climate change throughout the economy.
Climate change shocks such as floods, fires and heatwaves present immediate impacts to several
economic activities in sectors as diverse as agriculture, transport and water & electricity and with
multiple risk pathways into the rest of the economy. A city economy is not fragmented in spatial
suburban units but operate as an integrated system with linkages to regional, national and
international economies. One of the implications is that it is not necessary for all suburbs to have
equally high scores of all capital types as trade and exchange is a normal feature of wealth creation
and risk management in a modern economy.
It is important to note that this analysis is designed to provide a departure point for more
detailed assessments of how risks may manifest differently across space and time. For example, an
area may exhibit high levels of capital-at-risk, but investigating the underlying data might reveal that
the area is exposed only to expected increases in temperature, which could be ameliorated to a certain
degree by investing in stronger natural capital through interventions such as ecological restoration
[36,37]. Certain climate related risks would pose greater threats to different types of capital, for
example fire would pose a significant risk to natural capital, and floods would pose a greater risk to
manufactured capital such as infrastructure. Much more work remains in developing specific viable
options to manage the economic risks of climate change in specific suburban contexts.
A key assumption of the Economic Risk Assessment is that the chosen leading indicators and/or
composite indicators are representative of the specific capital distribution throughout the city.
Although the indicators were tested with City of Cape Town’s managers and the associated future
scenarios are based on historical trends and scientific projections, the choice of indicator metrics was
heavily influenced by available data at suitable spatial scales. Different cities may choose different
indicators. A further limitation of the assessment presented here is the choice of indicator variable for
financial and social capital. Total budget expenditure only represents the available financial capital
available to the municipality and does not incorporate the productivity of the broader economy (e.g.
private sector financial capital). Certain areas are invested in more by the municipality than others,
these are often areas that experience service delivery deficits and are generally lower income areas.
Thus, this may in some cases act to narrow the gap in aggregate scores between areas of higher capital
and lower capital because higher investment in those areas is considered as a relatively higher
financial capital score. Moreover, the inverse of the crime rate is a proxy for social capital in some
respects, but this assumption is likely not to hold in all cases (e.g. higher rates of crime in some areas
might result in improved social cohesion in response to the crime).
5. Conclusions
In conclusion, the practical and flexible methodology for economic risk assessment at an urban
scale as presented here may especially hold value to city managers of spatially heterogeneous cities
faced with climate change stressors and shocks now and in the foreseeable future. The expanded
definition of capital introduced here allows for support of a growth and development strategy
focused on productivity, inclusiveness and resilience of people to climate change.Preprints (www.preprints.org) | NOT PEER-REVIEWED | Posted: 2 March 2021 doi:10.20944/preprints202103.0099.v1
References
1. Walter, L.F. Climate Change and Disaster Risk Management; Springer: Berlin and Heidelberg, 2012.
2. Adger, W.N.; Brown, I.; Surminski, S.; Adger, W.N. Advances in risk assessment for climate change
adaptation policy. Philos. Trans. A 2018, 376, 1–13, doi:https://doi.org/10.1098/rsta.2018.0106.
3. Zhou, Q.; Mikkelsen, P.S.; Halsnæs, K.; Arnbjerg-Nielsen, K. Framework for economic pluvial flood risk
assessment considering climate change effects and adaptation benefits. J. Hydrol. 2012, 414–415, 539–549,
doi:10.1016/j.jhydrol.2011.11.031.
4. Michael, Y.; Lensky, I.M.; Brenner, S.; Tchetchik, A.; Tessler, N.; Helman, D. Economic Assessment of
Fire Damage to Urban Forest in the Wildland – Urban Interface Using Planet Satellites Constellation
Images. Remote Sens. 2018, 10, 1–23, doi:10.3390/rs10091479.
5. Sharma, A.K.; Grant, A.L.; Grant, T.; Pamminger, F.; Opray, L. Environmental and economic assessment
of urban water services for a greenfield development. Environ. Eng. Sci. 2009, 26, 921–934,
doi:10.1089/ees.2008.0063.
6. Zhou, Q.; Halsnæs, K.; Arnbjerg-Nielsen, K. Economic assessment of climate adaptation options for
urban drainage design in Odense, Denmark. Water Sci. Technol. 2012, 66, 1812–1820,
doi:10.2166/wst.2012.386.
7. Cartwright, A.; Blignaut, J.; De Wit, M.; Goldberg, K.; Mander, M.; O’Donoghue, S.; Roberts, D.
Economics of climate change adaptation at the local scale under conditions of uncertainty and resource
constraints: The case of Durban, South Africa. Environ. Urban. 2013, 25, 139–156,
doi:10.1177/0956247813477814.
8. Estrada, F.; Wouter Botzen, W.J.; Tol, R.S.J. A global economic assessment of city policies to reduce
climate change impacts. Nat. Clim. Chang. 2017, 7, 403–408, doi:10.1038/NCLIMATE3301.
9. Lindley, S.J.; Handley, J.F.; Theuray, N.; Peet, E.; Mcevoy, D. Adaptation Strategies for Climate Change
in the Urban Environment: Assessing Climate Change Related Risk in UK Urban Areas. J. Risk Res. 2007,
9, 543–568, doi:10.1080/13669870600798020.
10. Ye, B.; Jiang, J.; Liu, J.; Zheng, Y.; Zhou, N. Research on quantitative assessment of climate change risk
at an urban scale : Review of recent progress and outlook of future direction. Renew. Sustain. Energy Rev.
2021, 135, 110415, doi:10.1016/j.rser.2020.110415.
11. Dahl, A.L. Integrated Assessment and Indicators. In Sustainability Indicators. A Scientific Assessment; Hák,
T., Moldan, B., Dahl, A.L., Eds.; Island Press: Washington, Covelo, London, 2007; pp. 163–176.
12. Petrie, B.; Rawlins, J.; Engelbrecht, F.; Davies, R. Vulnerability and Hazard Assessment Report. Elaboration of
a “Climate Change Hazard, Vulnerability and Risk Assessment”; OneWorld Sustainable Investments, Cape
Town, South Africa, 2019.
13. Abiodun, B.J.; Adegoke, J.; Abatan, A.A.; Ibe, C.A.; Egbebiyi, T.S.; Engelbrecht, F.; Pinto, I. Potential
impacts of climate change on extreme precipitation over four African coastal cities. Clim. Change 2017,
143, 399–413, doi:10.1007/s10584-017-2001-5.
14. City of Cape Town. Our Shared Water Future. Cape Town’s Water Strategy; City of Cape Town, Cape Town,
2020.
15. Mukheibir, P.; Ziervogel, G. Framework for Adaptation to Climate Change in the City of Cape Town (FAC 4
T); City of Cape Town, Cape Town, 2006.
16. Colenbrander, D.; Cartwright, A.; Taylor, A. Drawing a line in the sand: Managing coastal risks in the
City of Cape Town. South African Geogr. J. 2015, 97, 1–17, doi:10.1080/03736245.2014.924865.
17. Kessler, R. Stormwater strategies: cities prepare aging infrastructure for climate change. Environ. HealthPreprints (www.preprints.org) | NOT PEER-REVIEWED | Posted: 2 March 2021 doi:10.20944/preprints202103.0099.v1
Perspect. 2011, 119, A514-A519, doi:10.1289/ehp.119-a514.
18. Wu, J.; Wu, T. Sustainability Indicators and Indices: An Overview. In Handbook of Sustainable
Management; Madu, C.N.; Kuei, C. Eds.; Imperial College Press: London, 2012; pp. 65–86.
19. Solow, R.M. On the Intergenerational Allocation of Natural Resources. Scand. J. Econ. 1986, 88, 141–149,
doi:10.2307/3440280.
20. Hartwick; M, J. Intergenerational Equity and the Investing of Rents from Exhaustible Resources. Am.
Econ. Rev. 1977, 67, 972–974.
21. Hamilton, K.; Clemens, M. Genuine Savings Rates in Developing Countries. World Bank Econ. Rev. 1999,
13, 333–356.
22. Pearce, D.W.; Atkinson, G.D. Capital theory and the measurement of sustainable development: an
indicator of “weak” sustainability. Ecol. Econ. 1993, 8, 103–108, doi:10.1016/0921-8009(93)90039-9.
23. Costanza, R.; Daly, H.E. Natural Capital and Sustainable Development. Conserv. Biol. 1992, 6, 37–46.
24. Ekins, P.; Simon, S.; Deutsch, L.; Folke, C.; De Groot, R. A framework for the practical application of the
concepts of critical natural capital and strong sustainability. Ecol. Econ. 2003, 44, 165–185,
doi:10.1016/S0921-8009(02)00272-0.
25. Tzachor, A. A capital theory approach should guide national sustainability policies. Cambridge J. Sci.
Policy 2020, 1, 1–12.
26. Lange, G.-M.; Wodon, Q.; Carey, K. Building a Sustainable Future The Changing Wealth of Nations 2018;
Washington D.C., 2018..
27. Stern, D.I. The Capital Theory Approach to Sustainability: A Critical Appraisal. J. Econ. Issues 1997, 31,
145–174, doi:10.1080/00213624.1997.11505895.
28. De Wit, M.P.; Blignaut, J.N. A critical evaluation of the capital theory approach to sustainable
development. Agrekon 2000, 39, 111-125, doi:10.1080/03031853.2000.9523572.
29. Ardisa, A. The Six Capitals Framework. A Discussion of International Integrated Reporting Council’s Model.
Monash University, no date.
30. Fordham, A.E.; Robinson, G.M.; Cleary, J.; Dirk Blackwell, B.; Van Leeuwen, J. Use of a multiple capital
framework to identify improvements in the CSR strategies of Australian resource companies. J. Clean.
Prod. 2018, 200, 704–730, doi:10.1016/j.jclepro.2018.07.184.
31. Mikulcak, F.; Haider, J.L.; Abson, D.J.; Newig, J.; Fischer, J. Applying a capitals approach to understand
rural development traps: A case study from post-socialist Romania. Land use policy 2015, 43, 248–258,
doi:10.1016/j.landusepol.2014.10.024.
32. Tinch, R.; Jäger, J.; Omann, I.; Harrison, P.A.; Wesely, J.; Dunford, R. Applying a capitals framework to
measuring coping and adaptive capacity in integrated assessment models. Clim. Change 2015, 128, 323–
337, doi:10.1007/s10584-014-1299-5.
33. Statistics South Africa. Local Municipality Statistics: City of Cape Town. Available online:
http://www.statssa.gov.za/?page_id=993&id=city-of-cape-town-municipality (accessed on Feb 25, 2021).
34. City of Cape Town. City of Cape Town Climate Change Strategy Draft for Public Participation; 2020.
35. Bowen, A.; Cochrane, S.; Fankhauser, S. Climate change, adaptation and economic growth. Clim. Change
2012, 113, 95–106, doi:10.1007/s10584-011-0346-8.
36. Prober, S.M.; Byrne, M.; McLean, E.H.; Steane, D.A.; Potts, B.M.; Vaillancourt, R.E.; Stock, W.D. Climate-
adjusted provenancing: A strategy for climate-resilient ecological restoration. Front. Ecol. Evol. 2015, 3,
1–5, doi:10.3389/fevo.2015.00065.
37. Bustamante, M.M.C.; Silva, J.S.; Scariot, A.; Sampaio, A.B.; Mascia, D.L.; Garcia, E.; Sano, E.; Fernandes,
G.W.; Durigan, G.; Roitman, I.; et al. Ecological restoration as a strategy for mitigating and adapting toPreprints (www.preprints.org) | NOT PEER-REVIEWED | Posted: 2 March 2021 doi:10.20944/preprints202103.0099.v1
climate change: lessons and challenges from Brazil. Mitig. Adapt. Strateg. Glob. Chang. 2019, 24, 1249–
1270, doi:10.1007/s11027-018-9837-5.Preprints (www.preprints.org) | NOT PEER-REVIEWED | Posted: 2 March 2021 doi:10.20944/preprints202103.0099.v1
Supplementary Materials: The following supplementary material is available online at www.mdpi.com/xxx:
Table 1 - Exposure and Capital Data Descriptive Statistics .xlsx, Table 2 - Normalised Exposure and Capital
Data.xlsx, Figure S1 - Baseline Capital Score Map.pdf, Figure S2 - Strong Capital Score Map.pdf, Figure S3 - Weak
Capital Score Map.pdf, Figure S4 - Baseline Exposure Score Map.pdf, Figure S5 - High Exposure Score Map.pdf,
Figure S6 - Low Exposure Score Map.pdf, Figure S7 - Exposure Capital Matrix.pdf, Figure S8 - Baseline Financial
Capital Map.pdf, Figure S9 - Strong Financial Capital Map.pdf, Figure S10 - Weak Financial Capital Map.pdf,
Figure S11 - Baseline Human Capital Map.pdf, Figure S12 - Strong Human Capital Map.pdf, Figure S13 - Weak
Human Capital Map.pdf, Figure S14 - Baseline Intellectual Capital Map.pdf, Figure S15 - Strong Intellectual
Capital Map.pdf, Figure S16 - Weak Intellectual Capital Map.pdf, Figure S17 - Baseline Manufactured Capital
Map.pdf, Figure S18 - Strong Manufactured Capital Map.pdf, Figure S19 - Weak Manufactured Capital Map.pdf,
Figure S20 - Baseline Natural Capital Map.pdf, Figure S21 - Strong Natural Capital Map.pdf, Figure S22 - Weak
Natural Capital Map.pdf, Figure S23 - Baseline Social Capital Map.pdf, Figure S24 - Strong Social Capital
Map.pdf, Figure S25 - Weak Social Capital Map.pdf
Author Contributions: The different contributions from the authors are as follows (MdW = Martin de Wit; JR =
Jonty Rawlins; BP = Belynda Petrie): Conceptualization, MdW, JR and BP; Methodology, MdW and JR;
Validation, MdW, JR and BP; Formal data analysis, JR and MdW; Investigation, MdW and JR; Resources, MdW
and JR; Data curation, JR and MdW; Writing - original draft preparation, MdW and JR; Writing - review and
editing, MdW, JR and BP; Visualization, JR; Supervision, MdW; Project administration, JR and BP; Funding
acquisition, BP and JR. All authors have read and agreed to the published version of the manuscript.
Funding: This research was funded by the Agence Française de Développement (AFD) for the benefit of the City
of Cape Town, grant number AFD: CZZ2197/MS/2017/03, under the project Accord-Cadre de prestations
d’études et d’assistance technique pour l’initiative Villes et Changement climatique en Afrique subsaharienne
(CICLIA), AFD/DOE/EBC/CLD | ACH-2017-026.
Acknowledgments: The authors would like to acknowledge Amy Davison of the City of Cape Town (Head –
Climate Change – Environmental Management Department) for her immeasurable support of this project and
research, including overall project coordination, facilitating data access and stakeholder engagement, and
verifying and validating the findings and outputs.
Conflicts of Interest: The authors declare no conflict of interest.Preprints (www.preprints.org) | NOT PEER-REVIEWED | Posted: 2 March 2021 doi:10.20944/preprints202103.0099.v1
Appendix A: Indicators for the six types of capital
Capital Type Indicator Data/ Measurement
Service charges, property rates, government
Operating cost (actual/budget) of city
grants, other own revenue, investment revenue
Financial
Borrowing, internally generated funds, national
Capital costs (actual/budget) of city
grants, provincial grants, public donations
Areas and property values over various
Median freehold residential property values,
built environment categories (e.g.
properties by suburb (770 units) and value band
commercial, industry, residential)
Roads, bus-roads, railways Kilometres of roads, bus-roads, railways
Manufactured
Vehicles over various categories Number of households with motorcars
Proxy of travel time to critical infrastructure and
Critical infrastructure service centres (e.g. fire departments, police
stations)
Number employed, unemployed, discouraged
Economically active population
and non-active persons
Number (un)employed, median household
Indicators of (un)employment, poverty
income, income range by suburb, households
and inequality
with cell phone/internet access
Percentage of population with no schooling
Educational attainment across age
Human (aged 20+), with matric (20+), with higher
groups
education (20+)
Pneumonia incidence and malnutrition incidence
(under 5), hepatitis A incidence, typhoid
Health indices
incidence, HIV incidence, percentage positive TB
tests
Informal settlements Percentage area of informality
Size of knowledge sector Number of people with higher education
Money spent on research and
R&D as percentage of GDP
development
Intellectual Brand awareness Brand perception
Science outputs Number of publications
Number and value of knowledge,
Number of patents
technology patents
Area of land declares urban conservation areas,
Area of land across natural categories as nature reserves, as urban conservation areas,
designated as wetland
Water stocks and use Average monthly household water use
Measures of biodiversity integrity and Percentage of suburb area that are critical
resilience biodiversity and protected areas
Natural
Pollution metrics Water, air and solid pollution
Percentage of households with no rubbish
Waste metrics
collection
Ecosystem services metrics SANBI ecosystem status (mean)
Valuation of environmental quality of air,
Value of ecosystem services
land, water, biological systems
Measures of trust, reciprocity and
Racial integration index
Social cohesion
Indicators of livelihoods and dependency Household dependency ratioPreprints (www.preprints.org) | NOT PEER-REVIEWED | Posted: 2 March 2021 doi:10.20944/preprints202103.0099.v1
Number of street people
Metrics of involvement in social and
Number of early childhood development forums
cultural initiatives
Percentage of people who voted for governing
Metrics of citizen satisfaction party
Number of service requests lodged
Access to piped water, electricity
Housing owned/paid off
Metrics of social wellbeing
Population density
Incidences of crime
Appendix B: Locality of the 77 ‘Major Suburbs’ in Cape TownPreprints (www.preprints.org) | NOT PEER-REVIEWED | Posted: 2 March 2021 doi:10.20944/preprints202103.0099.v1
Preprints (www.preprints.org) | NOT PEER-REVIEWED | Posted: 2 March 2021             doi:10.20944/preprints202103.0099.v1

              Appendix C: Capital Scores and Exposure across 77 Major Suburbs in Cape Town
                 Further detail on the relative baseline capital scores and exposure across Major Suburbs in Cape
              Town is provided here. The scores are determined as follows:
                      • High > 75th percentile
                      • Medium < 75th percentile & >25th percentile
                      • Low < 25th percentile

                   Major Suburb                 Baseline Capital                    Baseline Exposure

               AIRPORT                                 Low                                Medium
               ATHLONE                                 Low                                Medium
               ATLANTIS                              Medium                               Medium
               BELLVILLE                               Low                                Medium
               BERGVLIET                             Medium                               Medium
               BISHOP LAVIS                            Low                                Medium
               BLACKHEATH                              Low                                  Low
               BLOUBERG                                High                                 Low
               BLUE DOWNS                            Medium                                 Low
               BRACKENFELL                           Medium                                 Low
               BROOKLYN                              Medium                                 High
               CAMPS BAY                               High                                 Low
               CAPE FARMS NORTH                        High                               Medium
               CAPE FARMS SOUTH                      Medium                                 High
               CAPE POINT                            Medium                                 Low
               CAPE TOWN                               High                               Medium
               CONSTANTIA                            Medium                               Medium
               DELFT                                   Low                                Medium
               DURBANVILLE                             High                               Medium
               EERSTE RIVER                            Low                                Medium
               ELSIES RIVER                            Low                                Medium
               EPPING                                  Low                                  High
               EVERSDAL                              Medium                               Medium
               FALSE BAY COASTAL PARK                Medium                               Medium
               FISH HOEK                             Medium                               Medium
               GOODWOOD                              Medium                               Medium
               GORDONS BAY                           Medium                                 High
               GRASSY PARK                           Medium                                 High
               GREEN POINT                             High                                 Low
               GUGULETU                                Low                                Medium
               HANOVER PARK                            Low                                Medium
               HOUT BAY                                High                                 Low
               JOOSTENBERG VLAKTE                    Medium                               Medium
Preprints (www.preprints.org) | NOT PEER-REVIEWED | Posted: 2 March 2021 doi:10.20944/preprints202103.0099.v1
KALK BAY Medium Low
KALKSTEENFONTEIN Low Medium
KENRIDGE Medium Medium
KHAYELITSHA Low Low
KOMMETJIE Medium Low
KRAAIFONTEIN Medium Medium
KUILS RIVER Low Low
LANGA High High
MACASSAR Medium Medium
MAITLAND Medium High
MALMESBURY FARMS Medium Medium
MAMRE Medium Low
MANENBERG Low Medium
MELKBOSCH STRAND High Low
MILNERTON High High
MITCHELLS PLAIN Medium Low
MUIZENBERG Medium High
NEWLANDS Medium High
NOORDHOEK Medium High
OBSERVATORY High High
OCEAN VIEW Medium Medium
OTTERY Low Medium
PAARDEN EILAND Medium High
PAROW Low Medium
PELIKAN PARK Medium Low
PHILIPPI Low Low
PINELANDS High High
PLATTEKLOOF High Medium
PLUMSTEAD Medium Medium
RETREAT Low High
RONDEBOSCH High High
SEA POINT High Low
SIGNAL HILL/LIONS HEAD High Low
SIMONS TOWN High Low
SIR LOWRY'S PASS Medium High
SOMERSET WEST Medium High
STELLENBOSCH FARMS Medium High
STRAND Low High
TABLE MOUNTAIN High Medium
TABLE VIEW High MediumPreprints (www.preprints.org) | NOT PEER-REVIEWED | Posted: 2 March 2021 doi:10.20944/preprints202103.0099.v1
TOKAI Medium Medium
VREDEKLOOF Medium Medium
WELGEMOED High Medium
WYNBERG Medium MediumYou can also read