Economics of Utility-Scale Solar in Aotearoa New Zealand
←
→
Page content transcription
If your browser does not render page correctly, please read the page content below

Economics of Utility-Scale Solar in
 Aotearoa New Zealand
 Forecasting Transmission and Distribution Network Connected
 1 MW to 200 MW Utility-Scale Photovoltaic Solar to 2060

 May 2020

 Prepared for the Ministry of Business, Innovation and Employment

 Prepared by Dr Allan Miller

 www.millercl.co.nz
Acknowledgements
The following people and organisations have provided assistance with this study:

• Scott Lemon for his research of annual PV generation by location, the Land Cover Database, New
 Zealand topography, grid exit point (GXP) locations and zone substations.

• The Ministry of Business, Innovation and Employment (MBIE) for providing scenario parameters
 and reviewing preliminary results and this report.

• Transpower for providing GXP import capacity, providing information on substation connection
 costs and transmission line build costs, and reviewing preliminary results and this report.

• Powerco for providing information on medium voltage distribution and sub-transmission line
 build costs.

This study utilised the following data resources:

• The Electricity Authority’s EMI database from which final price and load data were obtained for
 each GXP.

• Energy Link’s monthly EnergyTrendz summary and the ASX electricity futures for an
 understanding of future electricity prices at the Benmore reference node.

• The NIWA CliFlo Climate Database (hourly global horizontal irradiance and direct and diffuse
 irradiance) and Solarview.

• Land Cover Database v5.0 of mainland New Zealand, sourced from the Land Resource
 Information Systems (LRIS) Portal provided by Landcare Research (https://lris.scinfo.org.nz/) and
 licensed by AMCL for re-use under the Creative Commons Attribution 4.0 International licence
 (https://creativecommons.org/licenses/by/4.0/).

• Sourced from the LINZ Data Service (https://data.linz.govt.nz/) and licensed by AMCL for re-use
 under the Creative Commons Attribution 4.0 International licence
 (https://creativecommons.org/licenses/by/4.0/).

 - A shape file giving polygons of the New Zealand coastline and islands

 - A shape file giving New Zealand lakes. Filtered to only include lakes of area > 0.001.

 - A shape file giving polygons of populated areas (577) in New Zealand. Filtered to 576 to
 remove the Chatham Islands.

 - A shape file giving power lines across New Zealand

 - A shape file giving roads throughout New Zealand

Economics of Utility-Scale Solar in Aotearoa New Zealand ii
• Further resources used in modelling irradiance:

 - Reanalysis data (MERRA-2) is from the Global Modeling and Assimilation Office
 (GMAO) via the Goddard Earth Sciences Data and Information Services Center (GES
 DISC) (https://gmao.gsfc.nasa.gov/reanalysis/MERRA-2/).

 - Satellite imagery data is from the Center for Environmental Remote Sensing
 Research, Chiba University (https://www.cr.chiba-u.jp/japanese/database.html) and
 relicensed by NOAA under an open data license.

 - Elevation data (SRTM 30 m) is from the U.S. Geological Survey (USGS) Earth
 Resources Observation and Science (EROS) Center
 (https://www.usgs.gov/centers/eros/science/usgs-eros-archive-digital-elevation-
 shuttle-radar-topography-mission-srtm-1-arc).

 - Annual results were checked against data obtained from the “Global Solar Atlas 2.0,
 a free, web-based application is developed and operated by the company Solargis
 s.r.o. on behalf of the World Bank Group, utilizing Solargis data, with funding
 provided by the Energy Sector Management Assistance Program (ESMAP). For
 additional information: https://globalsolaratlas.info Global Solar Atlas
 (https://globalsolaratlas.info). This data is also licensed under CC BY 4.0.”

Economics of Utility-Scale Solar in Aotearoa New Zealand iii
Glossary (terms used)
Many of these terms are introduced in the text and are collated here to provide an overview
understanding.

Term Meaning
8,760 The number of hours in a year, used to combine capacity of a solar
 system with its capacity factor to determine energy generated per
 annum.
Array Multiple PV modules connected together.
Capacity The size of a PV generation plant, usually on the AC side, given in Wp.
Capacity factor Capacity factor of a renewable generator is the measure of the resource
 available to it and the ability of its capacity (measured in MW) to convert
 that resource into saleable energy (measured in MWh). It is the ratio of
 the actual energy output of a generator to its energy output assuming it
 operates continuously at its maximum rated power.
Capital cost The cost of building a PV generation plant, given in $/Wp.
Cell Refers to each 1 kilometre by 1 kilometre land cell covering New Zealand.
 Note that this is distinct from a PV solar cell; the only use of cell to refer
 to a PV solar cell in this report is in the discussion about module
 efficiency and in the definition of module.
Clipping Related to inverter loading ratio, clipping occurs when the output power
 of the PV array is greater than the rated input power of the inverter. This
 requires the inverter to either increase the DC voltage (above the
 maximum power point), or to clip the AC power output (referred to as
 self-limiting). Inverters may also self-limit for other reasons, such as high
 temperatures. Clipping is also referred to as ‘inverter saturation’.
Crystalline silicon (c-Si) Refers to silicon crystals made of solar grade silicon.
Dual-axis tracking A PV system where the modules are mounted on control equipment that
 tracks the sun’s position from east to west across each day (azimuth) and
 adjusts the panel tilt to track the sun’s angle across a year (elevation
 tracking).
First-generation Refers to mature solar generating technology that has been in mass
 production for a number of years and makes up the majority of solar
 technology produced (Schwartfeger & Miller 2015).
Fixed angle A PV system where the modules are fixed in position (they do not track
 the sun’s position).
Generation stack A detailed list of potential future electricity generation projects in New
 Zealand covering information such as technology, size, location and cost
 of each project.
Global horizontal Solar power, or irradiance, received by a horizontal surface on the Earth
irradiance (GHI) (W/m2). This takes into account all constituents of the atmosphere (that
 might attenuate some parts of the sun’s spectrum) and includes direct
 horizontal, diffuse horizontal and reflected components of solar power.
 The diffuse horizontal component includes reflected irradiance that has
 been scattered by clouds and backscattered by the atmosphere onto the
 surface. Reflected irradiation refers to solar power typically reflected by
 the ground.
Global tilted irradiance Irradiance received by a surface with a defined tilt and orientation
(GTI) (azimuth). It is the sum of direct, diffuse and reflected radiation.

Economics of Utility-Scale Solar in Aotearoa New Zealand iv

Term Meaning
Ground mounted A solar system mounted on the ground, either by driven piles or concrete
 pads, depending on the soil.
Inverter A device used to convert direct current to alternating current. In this
 report it refers to a PV inverter, which specifically interfaces to PV
 modules to maximise energy capture from the modules (using maximum
 power point tracking), and to the electricity grid where it provides certain
 protection functions such as anti-islanding, ability to ride-through voltage
 and frequency deviations, cut-off at sustained over or under voltages,
 and advanced power quality response for voltage control.
Inverter loading ratio The ratio of nominal PV array capacity (Wp) to inverter capacity (W). An
 inverter loading ratio of greater than one (where the array of modules is
 oversized) results in the inverter being loaded closer to its capacity for a
 greater percentage of the day. As a result, more of the sun’s energy is
 collected throughout a day.
Irradiance In this report irradiance refers to solar terrestrial irradiance. This is the
 power from the sun landing on the Earth’s surface at each point in time,
 measured in watts per square metre (W/m2).
Irradiation Cumulative energy from the sun landing on the Earth’s surface over a
 period of time, measured in watt-hours per square metre per annum for
 example.
Land use efficiency The capacity of a ground mounted solar system per square metre,
 effectively giving the land area required for a system of given capacity.
 Measured in Wp-ac/m2.
Learning curve Also known as the ‘learning rate’ or ‘experience curve’, gives the
 reduction in a product cost for each doubling in production of that
 product.
Location factor The ratio of nodal spot price at a GXP location on the transmission grid to
 nodal spot price at a reference node.
Longlist A list of all potential utility-scale solar systems that have an acceptable
 rate of return, after considering the cost of transmission or sub-
 transmission to the nearest GXP or zone-substation with sufficient
 capacity to connect a solar system of the given capacity. However, total
 GXP, zone-substation or MV line capacity from all potentially connected
 solar systems is not considered. This provides information on all
 economically viable solar potential by location, capacity and timing.
Module A PV module (sometimes called a panel), comprising multiple PV solar
 cells with contacts and wiring connecting the cells in series, able to be
 interfaced to external wiring to connect to other modules (making an
 array) and an inverter/inverters. The multiple cells and wiring are
 packaged in a support structure to provide mechanical strength and anti-
 reflective coating for mounting on either a roof or ground mounting
 system. Packaging also protects from external pollutants (dust and bird
 soiling) and projectiles such as rain and hail. Modules are mass produced
 and typically range in size from around 250 Wp to 400 Wp. Mass
 production has led to a commodity market for modules with prices
 ($/Wp) monitored and reported with other energy commodities.

Economics of Utility-Scale Solar in Aotearoa New Zealand v
Term Meaning
Mono-crystalline PV Also called single-crystalline. The manufacture of mono-crystalline silicon
 is such that a crystal of the same type is reproduced. Efficiency of a
 mono-crystalline cell is typically slightly higher than multi-crystalline, but
 manufacturing cost has traditionally been higher. See Schwartfeger &
 Miller, 2015.
Multi-crystalline PV Also called poly-crystalline. The manufacture of multi-crystalline cells is
 such that a block of silicon crystal of varying structure is formed. See
 Schwartfeger & Miller, 2015.
Multi-junction The use of two or more different PV cells, each responsive to a different
 portion of the sun’s spectrum, to produce electric current. Multi-junction
 devices achieve a higher total conversion efficiency than first-generation
 single junction PV cells because they can convert more of the sun’s
 spectrum of light into electrical energy. They are a third-generation solar
 technology.
N-1 and N Refers to the level of redundancy at a substation or electrical installation.
 N-1 means that supply is maintained despite the loss of an asset, such as
 a transformer or transmission/sub-transmission line fault, or removal for
 maintenance. N means that supply is dependent on single assets, and
 supply will be lost if one of those assets fails or is taken out of service.
Nodal spot price The half-hourly price at a GXP location on the transmission grid used to
 buy and sell electrical energy (with units of $/MWh).
Organics A relatively new third-generation solar technology.
Perovskites A relatively new fourth-generation solar technology, not in production
 and still subject to instability, but showing promise in rapidly increasing
 cell efficiencies since its discovery.
Photovoltaic (PV) Photovoltaics is the process of converting light into electricity using solar
 cells, made of materials that exhibit the photoelectric effect. This causes
 them to absorb light and release electrons. The capture of the free
 electrons in the treated semi-conducting material gives rise to an electric
 current, which can in turn provide electrical energy. The effectiveness of
 a PV cell is limited to a narrow part of the sun’s spectrum.
Populated area One of 576 populated areas in the North and South Islands of New
 Zealand, including major, large, medium and small urban centres and
 rural settlements. Areas range in size from 0.1 square kilometres to over
 600 square kilometres. Populations range from about 100 people to
 about 1.7 million people.
Population centre Same definition as populated area.
Price scenarios The scenarios used to determine PV forecasts, with each scenario giving
 combinations of reference node electricity price, general price inflation,
 electricity price inflation, wage inflation, discount rate and required rate
 of return of a PV system.
Production Scenario 0 The scenario of PV capital costs based on worldwide PV module
 production continuing to grow at the same rate as that from 2010 to
 2018 until 2024, after which growth begins to slow.
Production Scenario 1 The scenario of PV capital costs based on worldwide PV module
 production beginning to slow from 2019.
Reference node A GXP location on the transmission grid used to determine location
 factors. In this study the Benmore GXP is used as the reference node.

Economics of Utility-Scale Solar in Aotearoa New Zealand vi
Term Meaning
Second-generation Refers to solar generating technology that has entered production and
 the supply chain as a competing technology more recently than the first-
 generation, although it has a much lower production capacity
 (Schwartfeger & Miller 2015).
Shortlist A list of potential utility-scale PV solar systems with the highest rate of
 return that are within GXP, zone sub-station or MV line capacity. The
 shortlist leads directly to a forecast of PV solar.
Single-axis tracking A PV system where the modules are mounted on control equipment that
 tracks the sun’s position from east to west across each day (also referred
 to as azimuth tracking).
Spectral mismatch The mismatch between the spectrum of light used to assess PV cell
 performance under ideal test conditions and the spectrum of light from
 the sun incident on a PV module. This is relevant as a PV module converts
 sunlight energy from a narrow frequency range (spectrum) into energy.
Spur line A line built from a utility-scale solar system to the nearest medium
 voltage distribution line.
Thin film solar cell A second-generation PV technology which is typically flexible – able to be
 bent over a surface. Thin film makes up approximately 10% of worldwide
 PV sales.
Third- or fourth- Refers to very new solar generating technology that is still in research
generation and development or possibly at small-scale manufacture, but not in mass
 production (Schwartfeger & Miller 2015).
Zone-substation A substation owned and operated by an electricity distribution business,
 typically connected by 33 kV or 66 kV sub-transmission lines, and usually
 with 11 kV or 22 kV distribution feeders distributing electrical energy
 close to consumers.

Economics of Utility-Scale Solar in Aotearoa New Zealand vii
Abbreviations (acronyms and units)
Abbreviation/acronym/unit Meaning
$/MWh The price or cost of electrical energy (dollars per MWh unit of energy).
$/Wp Price (in the given currency) per peak power output of a PV module.
 Currency used in this report is NZD.
$/Wp-ac Price (in the given currency) per peak power output of a PV system at
 the AC side of a solar system (i.e. it includes all components including
 the inverter). Currency used in this report is NZD.
1 km x 1 km 1 kilometre by 1 kilometre, used to refer to the dimensions of a land
 cell.
AC Alternating current. In this report this usually refers to the
 transmission or distribution network side of a grid-connected solar
 system, connected via an inverter.
BOS Balance of system, refers to components in addition to the PV
 modules and inverter that make up a PV system, such as wiring,
 ducting, and structural mounting components.
CdTe Cadmium telluride
CIGS Copper indium gallium selenide
DC Direct current. In this report this usually refers to the PV modules
 (array) side of a solar system, connected to an inverter/inverters.
EDGS Electricity demand and generation scenarios
EPC Engineering, procurement and construction of a utility-scale PV
 system.
GIP Grid injection point
GWh Electrical energy in gigawatt hours, given as the average power
 flowing over an hour.
GWp GWp is the peak power in gigawatts that can be produced by a solar
 energy system, under ideal sunlight and temperature conditions. The
 actual power produced will vary substantially from the peak power as
 sunlight (irradiation) varies and module efficiency varies with
 temperature, shading, surface cleanliness, and degradation over time.
 Note that the report, and some quoted reports such as those by
 IRENA, sometimes refers to PV capacity in GW, MW, kW or W without
 the ‘p’ subscript; the ‘p’ subscript is implied in these cases.
GXP Grid exit point
ha Hectare
HV High voltage (usually 33 kV or 66 kV sub-transmission or 110 kV or 220
 kV transmission).
HVDC High voltage direct current, and in this report refers to the inter-island
 transmission link between Benmore Power Station located in the
 Waitaki Valley and Haywards substation north of Wellington.
IEA International Energy Agency
IRENA International Renewable Energy Association
IRR Internal rate of return
km Kilometre
km x km Same definition as 1 km x 1 km
kV Kilovolts
kVA Kilovolt-Amps
kWh Electrical energy in kilowatt hours.

Economics of Utility-Scale Solar in Aotearoa New Zealand viii
Abbreviation/acronym/unit Meaning
kWp Peak power in kilo watts of a solar energy system (see GWp).
LBNL Lawrence Berkeley National Laboratory (U.S.A.)
LCDB Land cover database v5.0 of mainland New Zealand, developed by
 Landcare Research.
LCOE Levelised cost of energy
LINZ Land Information New Zealand
LRMC Long run marginal cost
LV Low voltage
MBIE Ministry of Business, Innovation and Employment
MV Medium voltage (usually 11 kV, possibly 22 kV)
MWh Electrical energy in megawatt hours.
MWp Peak power in megawatts of a solar energy system (see GWp).
NIWA National Institute of Water and Atmospheric Research
NPV Net present value
NREL National Renewable Energy Laboratory (U.S.A.)
PV Photovoltaic
RBNZ Reserve Bank of New Zealand
SRTM Shuttle Radar Topography Mission
TWh Electrical energy in terawatt hours.
V Volts
Wp Peak power in watts of a solar energy system (see GWp).
Wp-ac/m2 Wp-ac refers to the peak capacity on the AC (electricity grid
 connection) side of a utility-scale solar system, noting that the DC
 capacity may be higher from over sizing array capacity (an inverter
 loading ratio above 1). Wp-ac/m2, watts peak per square metre, gives
 the units of land use efficiency of a utility-scale solar system.

Economics of Utility-Scale Solar in Aotearoa New Zealand ix
Contents
Executive Summary................................................................................................................................. 1
1. Introduction .................................................................................................................................... 8
2. Solar Forecast Model .................................................................................................................... 10
 2.1 Model construction and review of other modelling worldwide ........................................... 10
 2.2 Land information resources unique to Aotearoa New Zealand and model inputs .............. 11
 2.3 Search for suitable utility-scale solar sites ............................................................................ 13
 2.3.1 Transmission connected utility-scale solar system search ........................................... 15
 2.3.2 Distribution connected utility-scale solar system search ............................................. 16
 2.3.3 Selection based on suitable rate of return ................................................................... 17
 2.4 Core economic model ........................................................................................................... 18
 2.4.1 Net present value (NPV) and levelised cost of energy (LCOE) definition ..................... 19
 2.4.2 Assessing model sensitivity to parameters ................................................................... 21
 2.4.3 Scenarios ....................................................................................................................... 24
 2.5 Revenue model ..................................................................................................................... 26
 2.6 Utility-scale solar system costs ............................................................................................. 29
 2.6.1 Capital cost component modelling approach and literature review ............................ 30
 2.7 Transmission and distribution costs ..................................................................................... 37
 2.7.1 Transmission costs ........................................................................................................ 37
 2.7.2 Distribution costs .......................................................................................................... 39
 2.8 Suitable land and its cost ...................................................................................................... 41
 2.9 Operation and maintenance cost ......................................................................................... 42
 2.10 Wholesale market and trading costs .................................................................................... 42
3. Forecast Results and Discussion ................................................................................................... 44
 3.1 Transmission connected utility-scale solar forecast ............................................................. 48
 3.2 Distribution connected utility-scale solar forecast ............................................................... 57
 3.3 Discussion.............................................................................................................................. 63
4. Appendix – Developing the capital cost component model into a time series ............................ 66
 4.1 Cumulative module production ............................................................................................ 68
 4.2 Developing the capital cost component model into a time series with learning curves...... 70
5. References .................................................................................................................................... 73

Economics of Utility-Scale Solar in Aotearoa New Zealand x
Disclaimer

This report gives forecasts of transmission grid and electricity distribution network connected utility-
scale photovoltaic solar capacity and energy using a model developed by the author and described
herein. The forecast results and model description are supplied in good faith and reflect the
expertise and experience of the author. The model is subject to assumptions and limitations referred
to in the description. Furthermore, the model is subject to many inputs and assumptions provided
by MBIE and others, including scenario parameters and international projections. Importantly, it
uses the configuration and development of the transmission grid, electricity distribution networks,
load and generation at the time of writing. Any reliance on the forecasts is a matter for the
recipient’s own commercial judgement, taking into account the stated inputs, assumptions and
limitations. AMCL accepts no responsibility for any loss by any person acting or otherwise as a result
of reliance on the forecasts provided in this report.

Economics of Utility-Scale Solar in Aotearoa New Zealand xi
Executive Summary
This study contributes to the Ministry of Business, Innovation and Employment’s development of the
Electricity Demand and Generation Scenarios (EDGS). It does so by providing a forecast of potential
utility-scale photovoltaic (PV) solar electricity generation in New Zealand, with accompanying
detailed information such as size, location, and cost of each project. This provides an evidence base
to inform energy sector and climate change policy, infrastructure providers, and the wider modelling
community.

For a given location and design, utility-scale PV solar rate of return is most sensitive to electricity
price and capital cost to build. From the absence of utility-scale solar development in New Zealand
to date, the combination of electricity price and capital cost appear to have not guaranteed a
suitable rate of return as yet. However, as the forecasts in this report show, capital costs for utility-
scale solar are reducing and are now close to a point where rate of return becomes acceptable to
consider building such plant. The forecasts also show that once that point is reached, the
development of utility-scale solar could be extensive and rapid.

Utility-scale solar capital cost reduction is fuelled by a substantial worldwide PV industry that in 2018
produced and installed 103 GWp of solar modules – enough to meet New Zealand’s annual
electricity requirement by more than 3 ½ times.1 This industry has grown substantially in the past 15
years and is expected to continue to grow according to International Renewable Energy Agency
(IRENA) and International Energy Agency (IEA) forecasts. As the industry continues to grow, it
improves production and installation techniques, leading to a lower module and system capital cost.
Indeed, dramatic cost reductions are predicted by IRENA.

The exact timing of utility-scale solar development in New Zealand depends on several other factors
in addition to electricity price and capital cost. These include:

 • Location - irradiance varies substantially depending on location, mainly due to weather
 conditions but also due to latitude and topographic shading, and land availability in those
 locations (while there is ample land suitable for utility-scale solar systems, its availability will
 be constrained by alternative uses).

 • Utility-scale solar system design - it is now economic to incorporate tracking systems to track
 the sun throughout a day, and to over-size module capacity to improve the inverter loading
 ratio and offset module degradation, thereby improving system capacity factor.

 • Suitable electricity transmission or distribution infrastructure.

 • Cost of capital and desired rate of return.

The scenarios investigated in this report illustrate the potential utility-scale solar build outcomes
from changes in and optimisation of some of these factors. The modelling approach assumes that

1
 GWp is the peak power in giga watts that can be produced by a solar energy system, under ideal sunlight and
temperature conditions. The actual power produced will vary substantially from the peak power as sunlight
(irradiation) varies and module efficiency varies with temperature, shading, surface cleanliness, and
degradation over time.

Economics of Utility-Scale Solar in Aotearoa New Zealand -1-
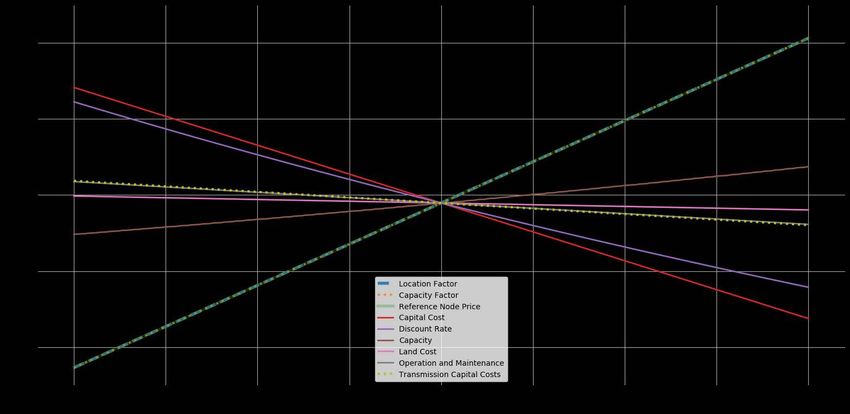
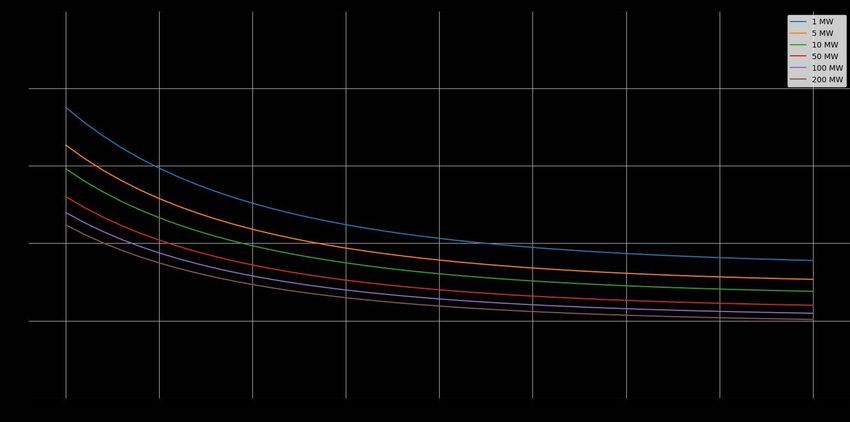
utility-scale solar is built if it is economic. This approach does not compare utility-scale solar with
other generation technologies, so in that sense it is not a forecast of build, but rather a forecast of
potential build. Scenarios were designed to primarily test sensitivity to electricity price and rate of
return. The core scenarios, pertaining to results in this Executive Summary, are shown in the table
below.

Price scenario parameters for the results shown in this Executive Summary - three core price scenarios consistent with the
Ministry of Business, Innovation and Employment’s Electricity Demand and Generation Scenarios.

 Benmore Average
 General Price Electricity price Land value O&M price Wage Nominal Nominal IRR criteria for
 Price (CY2020),
 Inflation inflation inflation inflation inflation discount rate selecting potential site
ID Name $/MWh
 3 EDGS Base Case 85 2% 2% 5% 2% 3% 7% 8.5%
 4 EDGS Scenario One 85 2% 1% 8% 2% 3% 8% 9.5%
 5 EDGS Scenario Two 85 2% 3% 3.5% 2% 3% 5% 6.5%

The rationale for the scenario parameters is explained in detail in the report. Briefly: (i) the 2017
electricity price from the 2019 EDGS scenarios is used with inflation adjustment. This is based on the
long run marginal cost of new generation entering the market in the 2019 electricity demand and
generation reference scenario; (ii) the Base Case scenario (ID 3) assumes electricity price increases at
the same rate as inflation – and therefore the real price remains constant in 2020 dollars, consistent
with the wholesale price indicator in the 2019 EDGS scenarios; (iii) land price inflation is set above
the average dairy farm land price increases from 1978-2015 of 2.6% per annum; and (iv) the nominal
discount rate is assumed to be 7% in the Base Case which is consistent with that used in the wind
generation stack update report for EDGS. Since this study is exploratory in nature, parameters
chosen for EDGS Scenario One and Two (ID 4 and ID 5) are quite extreme in order to provide a broad
range of estimates of the potential solar sites.

Projections of solar capital costs are based on international studies of component cost by utility-
scale solar system size, projected production and historical learning curves. Although worldwide
solar module production has increased exponentially historically, this analysis assumes that the rate
of increase will start to slow sometime in the next 10 years. As a result, capital costs reductions are
also expected to slow. Two ‘production scenarios’ for this effect are included, with the slowing
beginning at different years (from 2019 or from 2024). The reason for this is to investigate the
forecast sensitivity to slowing worldwide solar production and the slowing of expected capital cost
reductions.

The following chart shows build forecasts for both transmission and distribution connected solar for
the three price scenarios in the above table. In the chart the Base Case (solid green bar) requires a
rate of return of 8.5% and incorporates strong land price inflation and medium electricity price
inflation. Scenario One (solid red bar) requires a rate of return of 9.5%, has high land price inflation
and low electricity price inflation. The Scenario Two (solid blue bar) requires a rate of return of 6.5%
with moderate land price inflation and high electricity price inflation. The patterned bars are the
same scenarios but with worldwide PV module production slowing from 2019. In all forecasts the
capacity of distribution connected solar is about 5-15% of transmission connected solar.

Economics of Utility-Scale Solar in Aotearoa New Zealand -2-
Transmission and distribution connected cumulative utility-scale solar system capacity. In all forecasts the capacity of
distribution connected solar is about 5-15% of transmission connected solar.

As shown in this chart, the potential build differs significantly between scenarios, illustrating the
sensitivity of utility-scale solar build to the economic assumptions. Nevertheless, it is worth noting
that if and when utility-scale solar does become economically feasible, growth could be rapid, with
major development possible in the space of 5-10 years.

The approach used has considered utility-scale solar plant on a site-by-site basis, so by its nature has
also examined where and when in New Zealand utility-scale solar systems are forecast to locate. This
varies slightly between scenarios due to land price and electricity price difference. In general, the
first forecast transmission connected utility-scale solar systems are forecast to locate (i.e. become
economic) in the Mackenzie District and Tasman District, followed by Marlborough, Waikato,
Hawke’s Bay, Bay of Plenty and Central Otago as shown below. The first forecast distribution
connected utility-scale solar systems locate (i.e. become economic) in the Far North District, Tasman
and Marlborough, followed by the Bay of Plenty, Hawke’s Bay, Waikato and Canterbury, as shown
below.

Economics of Utility-Scale Solar in Aotearoa New Zealand -3-
Populated area
 Potential solar site
 Grid Exit Point

Transmission connected forecast utility-scale solar system locations in 2025 (left) and 2030 (right) EDGS Base Case scenario
(the solid green bar of the above chart). This illustrates the areas where transmission connected utility-scale solar systems
are most likely to locate first, due to a combination of high solar resource, higher location factors, suitable land at an
acceptable price, and transmission grid. Solar capacity is represented by the size of the green dot (largest is 200 MWp).

 Populated area
 Potential solar site
 Grid Exit Point

Transmission connected forecast utility-scale solar system locations in 2020 (left) and 2025 (right) EDGS Scenario Two (the
solid blue bar of the above chart). This illustrates the areas where transmission connected utility-scale solar systems are
most likely to locate first in this scenario of lower cost of capital. Solar capacity is represented by the size of the green dot
(largest is 200 MWp).

Economics of Utility-Scale Solar in Aotearoa New Zealand -4-
Populated area
 Potential solar site
 Zone substation

Distribution connected forecast utility-scale solar system locations in 2030 (left) and 2035 (right) EDGS Base Case scenario
(the solid green bar of the above chart). This illustrates the areas where distribution connected utility-scale solar systems
are most likely to locate first, due to a combination of high solar resource, higher location factors, suitable land at an
acceptable price, and proximity to distribution network infrastructure with suitable capacity. Solar capacity is represented
by the size of the green dots (largest is 20 MWp).

 Populated area
 Potential solar site
 Zone substation

Distribution connected forecast utility-scale solar system locations in 2025 (left) and 2030 (right) EDGS Scenario Two (the
solid blue bar of the above chart). This illustrates the areas where distribution connected utility-scale solar systems are most
likely to locate first in this scenario of lower cost of capital. Solar capacity is represented by the size of the green dots
(largest is 20 MWp).

Economics of Utility-Scale Solar in Aotearoa New Zealand -5-
The forecasts also show very high solar development in some scenarios, even with transmission and
distribution capacity constraints accounted for. It may be questionable whether the wider electricity
system could accommodate such solar capacity (for example, in terms of technical integration and
managing and storing the daily and seasonal solar generation profile). This effect is being observed
in Australia now, where there are far more new solar generation plants wanting to connect to the
state grids than the distribution and transmission companies can deal with administratively and that
the national System Operator is comfortable connecting. However, as mentioned above, a rapid rate
of growth when the balance tips towards utility-scale solar systems becoming economic suggests the
need for preparedness by network owners and operators.

When considering the forecasts in this report the following should be considered alongside them:

 1. Capacity factor of a renewable generator is a particularly important consideration. Capacity
 factor is the measure of the resource available to a renewable generator, and its efficiency in
 converting that resource into saleable energy. For this it employs solar generating plant
 which comes at a considerable cost. Capacity factor is closely related to the solar resource,
 solar module efficiency and inverter characteristics. As discussed above, utility-scale solar
 system design can improve capacity factor; this study assumes all solar systems will employ
 increased inverter loading ratios and single-axis tracking. With these improvements the
 capacity factors of solar modelled throughout New Zealand range, conservatively, from
 about 0.12 to 0.20.

 2. The forecasts must be viewed in conjunction with possible medium- to long-term electricity
 infrastructure changes. Infrastructure changes that will permanently increase or lower price
 and/or location factors are particularly important.

 3. The large influx of solar capacity shown in some forecasts may also depress the wholesale
 electricity price at times when solar is generating, negating the incentive to develop a utility-
 scale solar project. While the forecasts do incorporate the reduction in location factor at a
 location from increased generation resulting in lower transmission losses, they do not
 incorporate the entire wholesale electricity market, and the effect of increased generation
 on real-time wholesale price. For these reasons, the very high forecast scenarios (the blue
 bar in the above chart / Scenarios 0, 2, 3, 5 and 8 in the report) are unlikely to eventuate.

 4. The rates of return of utility-scale solar projects in other jurisdictions may be greater than
 what can be achieved in New Zealand. Solar projects in countries with better solar resource,
 such as Australia, California, the Middle East and northern Africa will produce more energy,
 potentially increasing rates of return. This is relevant, as the forecasts are based on utility-
 scale solar projects meeting an acceptable rate of return. For this reason, a range of rates of
 return are tested in the scenarios.

 5. However, as solar development becomes saturated in other countries, solar
 investors/developers may look to New Zealand for development. Even if those countries are
 a long way off saturation, increasing solar deployment will drive more module production,
 reducing PV system prices further and thereby increasing rates of return in New Zealand. As
 discussed earlier, utility-scale solar forecasts are very sensitive to capital cost.

Economics of Utility-Scale Solar in Aotearoa New Zealand -6-
6. There is also the possibility that the cost of capital will decrease substantially in the near- to
 medium-term largely as a result of the coronavirus (COVID-19) pandemic declared while this
 study was being conducted. Consideration was given to adjusting some scenario parameters
 to account for economic disruption from the pandemic. However, this is a long-term study to
 2060 and the parameters were therefore retained. Nevertheless, the report does investigate
 some of the forecast outcomes that may eventuate in a low cost of capital and electricity
 price inflation environment. Countering cost of capital reductions could be disruptions to
 supply chains of solar equipment resulting from the pandemic, possibly increasing its capital
 cost. While investigations of more recent capital costs show ongoing reductions in PV
 module and inverter costs, more recent data was not available at the time of writing to
 understand the impacts from the pandemic.

 7. Since many PV components are imported, fluctuations in the New Zealand dollar could
 change the cost of systems in New Zealand. This may counter reducing rate of return
 requirements, although other generation technologies are likely to be similarly affected by
 exchange rate fluctuations.

 8. Ongoing advances in other generation technologies, such as wind and geothermal, may see
 reductions in their capital costs. In turn they will continue to compete with utility-scale solar,
 and therefore the very large forecasts indicated in this report may not eventuate.

 9. The lifespan and analysis of utility-scale solar used in this study was 25 years. This is a
 conservative assumption, as lifespans of modern modules are more likely to be in the range
 of 30 years, but they may attract a price premium.

 10. The HVDC link transmission charges solely to South Island generators was removed as per
 the proposed new transmission pricing methodology published by the Electricity Authority in
 July 2019.

One of the key findings from this study is how rapidly utility-scale solar development could become
economic in New Zealand. For example, if all economic utility-scale solar systems were built within
the existing grid capacity, there could be several gigawatts of development in the space of 5-10
years. This growth would be fuelled primarily by the exponential growth in module production (a
consequence of the large and growing solar industry). Moreover, such rapid growth could begin any
time in the next 10 years.

Finally, further investigation of solar forecasts with a lower electricity price inflation combined with a
lower cost of capital environment, shows lower overall solar capacity development. Nevertheless,
the development may still be rapid and occur in the next 10-15 years.

Economics of Utility-Scale Solar in Aotearoa New Zealand -7-
1. Introduction
The purpose of this study is to contribute to the Ministry of Business, Innovation and Employment’s
(MBIE’s) published data on New Zealand’s ‘generation stack’. In turn these will contribute to its
electricity demand and generation scenarios (EDGS). The generation stack is a detailed list of
potential future electricity generation projects in New Zealand covering information such as
technology, size, location and cost of each project. This provides an evidence base that informs
energy sector and climate change policy, informs infrastructure providers such as Transpower and
distributors, and is used by the wider modelling community.

For this study MBIE specifically requested a forecast of utility-scale photovoltaic (PV) solar electricity
generation in New Zealand to 2060. The starting point to develop a utility-scale PV solar generation
forecast is to forecast utility-scale PV solar capacity, then convert that to energy. In this report
utility-scale refers to PV solar generation directly connected to the electricity grid, either via an
electricity distribution network or Transpower’s high voltage (HV) network. For the purpose of this
study utility-scale solar systems of capacity between 1 MW and 200 MW are considered. The
systems considered would typically involve dedicated land purchased or be leased for the purpose of
solar generation, utilise ground mounted modules, and in this study employ single-axis PV module
tracking to maximise energy capture across each day.

The study specifically considers PV solar rather than thermal-solar such as solar concentrator
systems that focus the sun’s energy to produce steam and drive a turbine. This is because of the
widespread production and application of PV solar systems and the lower irradiance conditions in
New Zealand. Crystalline-silicon-based photovoltaic solar technology is specifically considered,
rather than other technologies such as thin film (commonly referred to as second-generation
photovoltaics), again because of the widespread production and application of crystalline-silicon-
based PV solar – this report expands on this in more detail in Section 2.6.

The study uses models that convert solar irradiance (power from the sun landing on the Earth’s
surface at each point in time, measured in watts per square metre) to utility-scale solar output in
watts. This is required over a time span of a year to understand annual energy generation from a
solar system. Models developed by the author and associates are used for this assessment. Solar
irradiance does vary from year-to-year, depending on cloud cover for example. Hence typical
meteorological conditions are used in assessing irradiance. No forecast of changing irradiance is
made, as might result from a changing climate.

Also excluded from this study is the analysis of integration of solar into the broader electrical power
generation and transmission system and energy system (other than some technical and capacity
constraints of the existing grid). For example, excluded are: analysis of all generation options in the
same model with pricing implications; and electricity system security of supply with short- and long-
term implications as the generation mix changes towards solar. Modelling of these would expand
the scope considerably. Moreover, this study provides an input to future modelling of this nature.

This report is divided into two sections. The first section describes the model developed for
forecasting utility-scale solar capacity by time and location. The description identifies input
parameters to which the model output, and therefore forecast, is sensitive, and how these

Economics of Utility-Scale Solar in Aotearoa New Zealand -8-
parameters were determined or are used in the model. This section also describes the operation of
the model to identify, optimise and select potential utility-scale solar system sites for distribution
and transmission connected systems. The model relies on various other models developed by the
author and associate, which are documented in separate ‘commercial in confidence’ design notes.
The second section presents and discusses forecasts of utility-scale solar capacity and generation
resulting from the model.

Economics of Utility-Scale Solar in Aotearoa New Zealand -9-
2. Solar Forecast Model
One of the challenges in forecasting utility-scale solar uptake in New Zealand is the absence of any
built schemes from which to draw insights and to benchmark potential forecast schemes against.
When the research for this forecast started in late 2019 there was at least one officially announced
scheme of 26 MW capacity at the Marsden Point Oil Refinery (Energy News, 2019), and a few
potential schemes known to the author. During the research, Genesis Energy announced they were
in discussions with a developer to develop a 300 MW solar farm in the Waikato (Energy News, 2020).
However, no utility-scale solar systems have been built and are operational in New Zealand. There
are obviously many schemes in other countries, but the economic incentives, electricity markets and
electricity prices and solar irradiance in those countries are quite different to New Zealand’s.

Given that there are no utility-scale solar installations in New Zealand to date, and due to the
scarcity of information about utility-scale solar in New Zealand, it was proposed to consider the
problem using a combined land use, solar resource, economic and grid capacity approach. This
would consider suitable land types throughout New Zealand and the solar irradiance and utility-scale
solar system output at each location. In addition, it would consider the main inputs to solar
economics and assume that investors will make decisions based on acceptable rates of return. It
would also consider proximity to electricity grid infrastructure (both transmission and distribution)
and its capacity to connect PV solar. By default, the distribution model would also consider proximity
to roading infrastructure. From that, a shortlist of potential utility-scale PV solar systems with the
highest rate of return that are within grid capacity would be developed. The shortlist would lead
directly to a forecast of PV solar. In addition, the model would consider PV solar potential using just
a land-use, solar irradiance/ utility-scale solar system output and economic model, without grid
connection constraints. The output of this would provide a longlist of potential utility-scale solar
systems, and thereby provide information on all economically viable solar potential by location,
capacity and timing.

 2.1 Model construction and review of other modelling worldwide

To develop such a model the many components that feed into the economics of a solar scheme had
to be deconstructed, then assembled into the single model. The forecast would inherently rely on:
solar resource and utility-scale solar system generation by location; suitable land type, its location,
and land values; wholesale electricity price; PV system capital costs and new or appropriate solar
technology; operating and maintenance costs; transmission or distribution connection costs; and
forecasts of inputs, such as cost of capital. Therefore, the forecast would need to give a range to
accommodate uncertainties in these inputs.

A starting point was to assess what had been done elsewhere in the world. Studies examining land
availability and suitability for solar and potential uptake have been undertaken previously. One such
study is that by Hernandez et al. (Hernandez, Hoffacker, & Field, 2015). Hernandez et al.’s study
makes a useful assessment of the potential PV solar uptake in California, U.S.A. However, it uses
data specific to the U.S.A. which makes it difficult to apply to New Zealand. Moreover, it only goes as
far as assessing the potential based on land type. It considers neither the economic potential nor

Economics of Utility-Scale Solar in Aotearoa New Zealand -10-
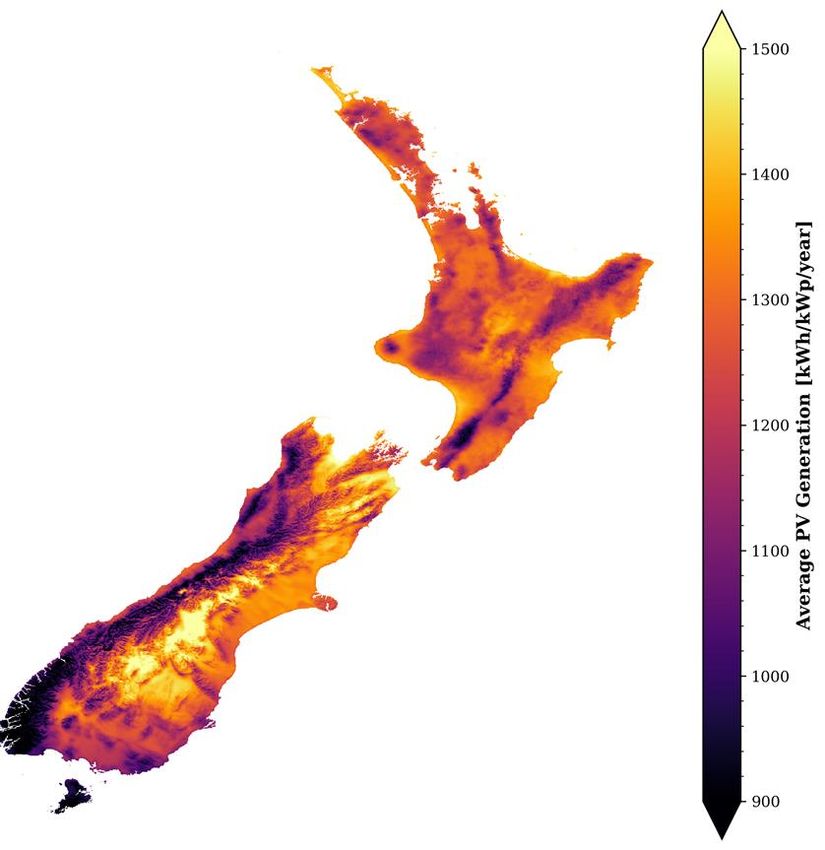
grid capacity to connect potential utility-scale solar systems. Another study by authors from the
National Renewable Energy Laboratory (NREL) (Ong, Campbell, Denholm, Margolis, & Heath, 2013)
also investigated land use requirements for ground mounted PV solar and solar concentrators. This
study was also U.S.A. based and only assessed land use requirements. Both studies did provide
guidance on land use efficiency that should be used in this forecast study, with both broadly
agreeing on about 35 Wp-ac/m2 land use efficiency after taking into account tracking equipment,
access roads, inverter equipment and placement and terrain to avoid shading.2 A further study that
investigated land-use is that undertaken by Wu et al. (Wu, Torn, & Williams, 2015). However, Wu et
al.’s study does not investigate the economics of PV solar either, nor the transmission grid capacity
to connect PV solar.

One other study from Spain (Martin-Chivelet, 2016) investigates both PV potential and land use but
concentrates on roof-top solar. New Zealand specific research has already been undertaken on solar
resource and conversion to electrical energy, with proprietary models used in this study.
Greenpeace has also commissioned studies in Spain on renewable potential of the Iberian Peninsula,
documented by Dominguez-Bravo et al. (Dominguez-Bravo, Garcia-Casals, & Pinedo-Pascua, 2007).
However, like the U.S.A. studies, these considered land type but neither the economics nor grid
capacity to connect potential.

Numerous studies that investigate technical aspects of integrating PV solar into electricity grids have
been undertaken. One such study that also incorporates a geographical component in terms of
location connecting to the Californian electricity network is that by Tabone et al. (Tabone, Goebel, &
Gallaway, 2016). Such technical investigations would be necessary in siting PV plant in New Zealand.
They are implicitly required for distribution connected PV solar through Part 6 of the Electricity
Industry Participation Code 2010, and extensive studies would be expected for transmission
connected PV solar. However, it does highlight an area of further investigation required beyond this
study, which only investigates grid connection from a capacity point of view. That is of grid stability
if, for example, grid connected solar was to cluster in an area. While Transpower has undertaken
studies, mainly with rooftop solar, the results of this study will provide insights and timing needs for
further studies, as it will identify areas where there is particularly strong utility-scale solar potential
and will give an indication of possible uptake by time. Another area of further investigation is how
electricity supply reliability would be maintained if there was a large development of solar
generation in New Zealand, in terms of seasonal and annual solar irradiation variability and
interaction with other generation and storage. Again, this study will shed light on this through
providing utility-scale solar forecasts.

 2.2 Land information resources unique to Aotearoa New Zealand and
 model inputs

Developing a land-use based model for New Zealand required insights into New Zealand land
suitability. A review of information available identified the ‘land cover database v5.0 of mainland

2
 Wp-ac refers to the peak capacity on the AC (electricity grid connection) side of a utility-scale solar system,
noting that the DC capacity may be higher from over sizing array capacity (an inverter loading ratio above 1).
Wp-ac/m2, watts peak per square metre, gives the units of land use efficiency of a utility-scale solar system.

Economics of Utility-Scale Solar in Aotearoa New Zealand -11-
New Zealand’ (LCDB), sourced from the Land Resource Information System (LRIS) portal and
developed by Landcare Research. This provides a set of vectors in a shapefile, which were converted
into a grid of km x km cells (267,535 cells in all) that cover New Zealand (using the NZTM 2000
projection). The LCDB gives the proportion of 34 different land types, which after the conversion
described give the proportion within each cell. From this, land suitable for utility-scale solar systems
could be identified. Combined with proprietary utility-scale solar system models that use global-
horizontal irradiance data specifically covering New Zealand, the solar generation potential from
that land could then be determined. Combining that with electricity prices closest to the land could
then give an indication of the revenue potential of a system at each cell of suitable land. This gives a
key element of an economic model: the revenue potential.

The other key element of an economic model is the cost, both initial investment and ongoing. The
initial investment in a utility-scale solar system involves the land purchase, acquiring and
constructing the solar generating plant and building transmission or distribution to the appropriate
electricity transmission or distribution network. Ongoing costs involve annual operation and
maintenance of the PV solar generating plant, annual operation and maintenance of the
transmission or distribution interconnection assets and annual tax costs. These are identified in the
model represented conceptually in Figure 1.

Economics of Utility-Scale Solar in Aotearoa New Zealand -12-
All New Zealand North and South
 Islands by 267,535 km x km cells

 Land classes suitable for utility- Solar generating potential (capacity
 scale solar by km x km land cells factor) by km x km land cells

 Electricity prices by
 Cost model of land based on land
 location
 class and proximity to population
 centres
 Economic
 assumptions

 Combines in a single model of a utility-scale solar system, indicating rate of
 return for solar systems of various sizes at each land cell identified at points of
 time in the future. Output is a location and time specific capacity and
 generation forecast.

 PV system
 capital costs
 Proximity of each km x km land cell to
 suitable electricity transmission grid (GXP)
 or distribution network (MV lines)
 infrastructure including cost of connection PV system operation and
 and maintenance maintenance costs

Figure 1: Conceptual model employed in this study to develop utility-scale PV solar forecasts.

 2.3 Search for suitable utility-scale solar sites

Essentially the solar forecast model depicted in Figure 1 acts as a filter with multiple stages,
beginning with the entire country and progressively filtering it to a set of potential utility-scale solar
systems that could be realised. From this a forecast is developed. This process is depicted in Figure 2.

Economics of Utility-Scale Solar in Aotearoa New Zealand -13-
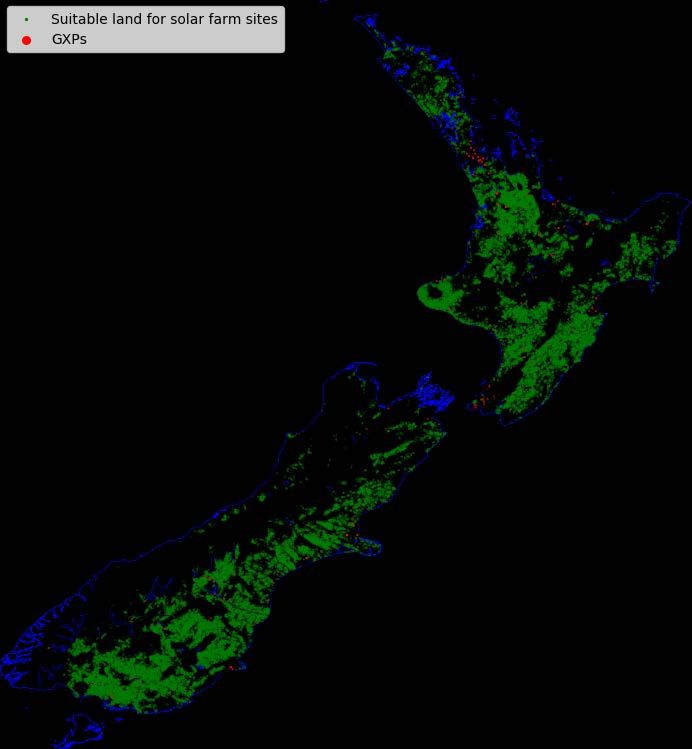
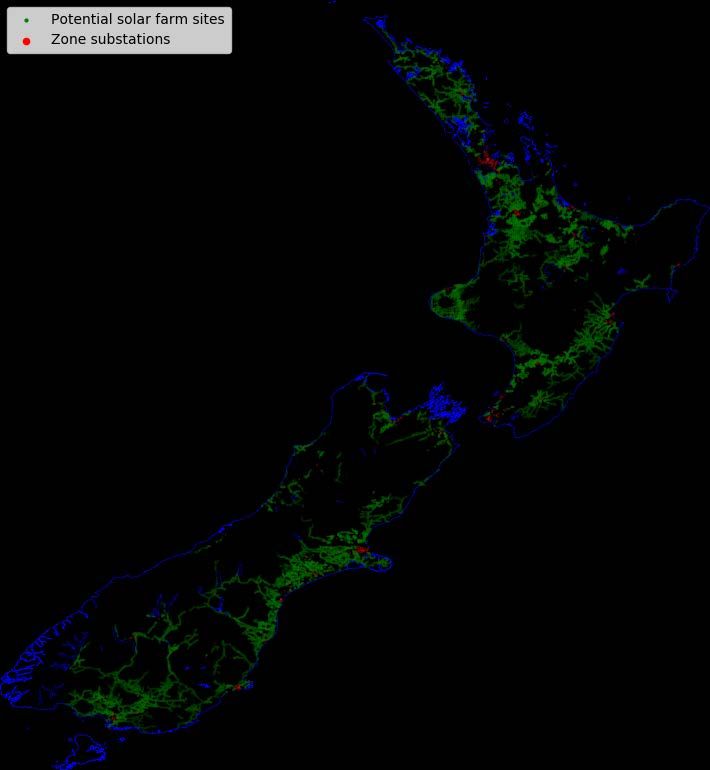
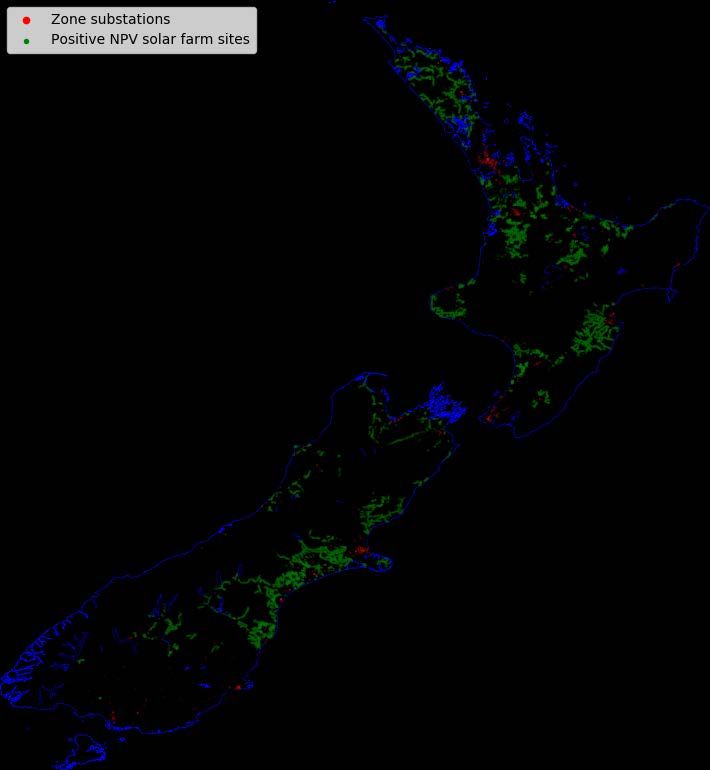
All New Zealand North and South
 Islands by 267,535 km x km cells

 Select cells of suitable land type
 (162,000 cells)

 Assess suitability for transmission Assess suitability for distribution
 connected utility-scale solar based connected utility-scale solar based on
 on sufficient size and adjacent size and proximity to medium voltage
 cells (43,207 cells, Figure 3(a)) (MV) distribution lines and zone
 substations (33,092 cells, Figure 3(b))

 Assess suitability based on a potential
 utility-scale solar system centred at a
 cell achieving a suitable rate of return

 Longlist of potential transmission Longlist of potential distribution
 connected systems by scenario connected systems by scenario
 (from 0 to 38,972 across all years (from 0 to 27,797 across all years
 depending on the scenario) depending on the scenario)

 Shortlist of potential transmission Shortlist of potential distribution
 connected systems by scenario connected systems by scenario
 that are within the existing that are within the existing
 capacity of GXPs (up to 70 across capacity of zone substations (up to
 all years) 312 across all years)

 Develop capacity and generation Develop capacity and generation
 forecast by 9 x 2 scenarios forecast by 9 x 2 scenarios

 Combined capacity and generation
 forecast by 9 x 2 scenarios

Figure 2: The overarching search for potential utility-scale solar systems from which to develop a capacity and energy
forecast.

Economics of Utility-Scale Solar in Aotearoa New Zealand -14-
You can also read