Economy and Property Update - South Region Committee Dr Ronnie O'Toole, Department of Finance - Institute of Banking
←
→
Page content transcription
If your browser does not render page correctly, please read the page content below

South Region Committee

Economy and Property Update

    • Dr Ronnie O’Toole, Department of Finance

    • Peter O’Flynn, DTZ Sherry FitzGerald Cork

                                     23 April 2015
Dr Ronnie O’Toole
Programme Manager, National Payments Plan
      Department of Finance

                                            2
The Institute of Banking

Economy Update
Dr. Ronnie O’Toole                     23rd April 2015
Department of Finance                  Rochestown Park

3 | ECONOMIC AND FISCAL OUTLOOK 2015   23rd April 2015

4 | ECONOMIC AND FISCAL OUTLOOK 2015 29 January 2015
Trading partner performance is improving
Key Points
US – benefitting from a
tighter labour market
and lower energy prices
despite stronger dollar
UK – solid recovery
driven by domestic
demand and lower oil
prices
Euro area – supported
by lower oil prices,
quantitative easing and
euro depreciation
Euro area, US and UK
combined represent
about two-thirds of Irish
exports
5 | ECONOMIC DEVELOPMENTS 2015
Currency effect is positive
Key Points
Euro has declined
considerably over the last year
against USD and sterling
This is the first-round impact of
ECB’s quantitative easing
programme
Ireland’s nominal effective
exchange rate has fallen
considerably, boosting
competitiveness
Will boost exports as Ireland
trades disproportionately with
the UK and US
6 | ECONOMIC DEVELOPMENTS 2015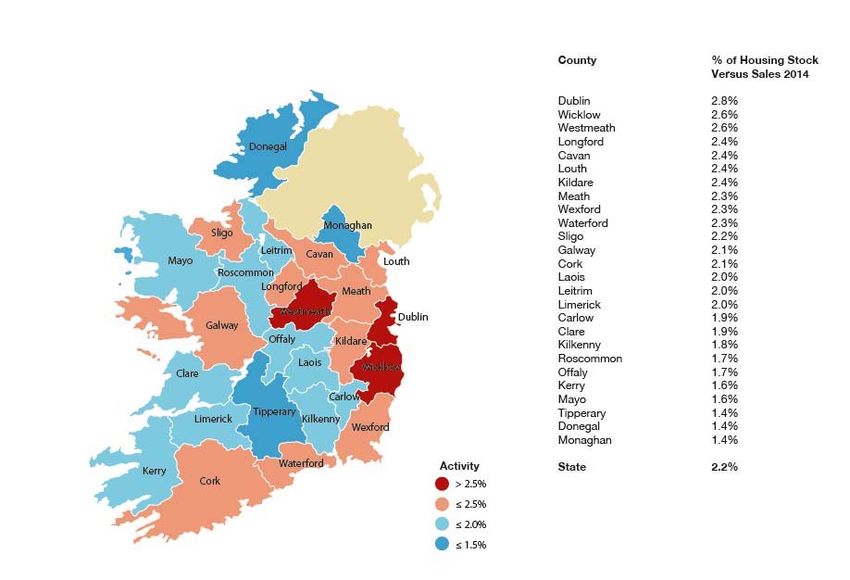
Falling oil prices weighing on inflation
Key Points
3.5
Headline inflation 3.0
averaging -0.4 v core 2.5
inflation +1.0 in YTD 2.0
Significant fall in oil 1.5
prices contributed to this 1.0
fall 0.5
0.0
Depreciation of euro -0.5
against sterling should -1.0
lead to modest increases -1.5
in prices -2.0
Q1 2012
Q2 2012
Q3 2012
Q4 2012
Q1 2013
Q2 2013
Q3 2013
Q4 2013
Q1 2014
Q2 2014
Q3 2014
Q4 2014
Q1 2015
Service prices continue
to increase and boosted unprocessed food
services
processed food
HICP
NEIG
Core HICP
energy
by water charges in
January
7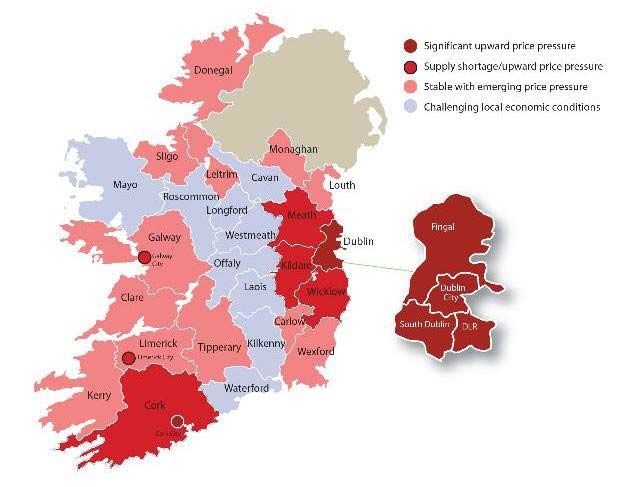
Export growth has rebounded
Key Points
Export growth of 14 per
cent recorded in Q4 –
split evenly between
goods and services
Services exports are
rising rapidly – mainly
ICT services. Strong
FDI pipeline
Goods exports have
bounced back from the
pharma ‘patent cliff’
effect of 2012-13
8 | ECONOMIC DEVELOPMENTS 2015
Domestic economy performing strongly too
Key Points
Retail sales grew by
over 6% in 2014
Car sales very strong,
but ‘core’ sales still up
3.7% last year
Tax impact is visible –
VAT rose by just under
9% in 2014
This has pushed
though to 2015. Growth
of 8% recorded in
February
9 | ECONOMIC DEVELOPMENTS 2015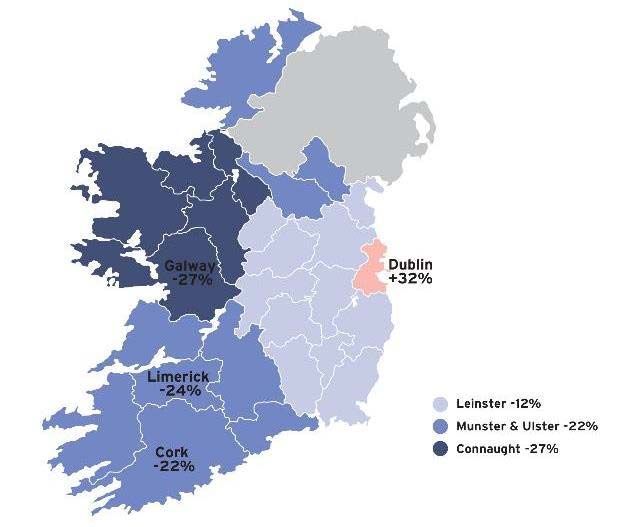
Unemployment now below euro area average
Key Points
Irish employment
increased by 1.7% in
2014
Unemployment rate at
10% in March, below
euro area average since
last summer
Employment growth is
broad-based across
sectors
10 | ECONOMIC DEVELOPMENTS 2015Fiscal performance strong in 2014
Key Points
Full-year 2014 tax
performance
impressive
Tax revenue rose by
just over 9 per cent in
2014
Performance above
target across a range of
categories: labour
taxation, corporation
tax, consumption tax
Performance into 2015
is very strong. Up 13%
y-o-y in Q1
11 | PUBLIC FINANCES 2015Yields on Irish debt continue to fall
Key Points
Irish yields have
continued to fall right
into 2015
10-year yield is down
well below 1% from a
peak of 14% in July
2011
Investor sentiment
remains positive with
new record lending
rates in recent weeks
No sign of contagion
effect from Greece
12 | PUBLIC FINANCES 2015Irish Economy - Highlights
Key Points
Growth of 4.8% recorded in 2014. This makes Ireland the fastest-
growing economy in the EU last year
Consensus expectations of 4% GDP growth this year
Exports are at an all-time high, driven by both goods and services
Recovery in traded sector driven by:
Competitiveness: unit labour costs converged 20% vis-à-vis euro area since 2008. Wage
moderation has accompanied productivity improvements
Continued inflows of FDI, particularly in ICT sector
Educated workforce and openness to inward migration of skilled workers
Unemployment remains unacceptably high at 10% but has fallen from
15% in just three years. Momentum is positive
Last few years of growth driven by the export sector
Domestic economy now recovering, set to drive GDP in near term
Cost of government borrowing at an all-time low
13 | ECONOMIC DEVELOPMENTS 201514 | ECONOMIC AND FISCAL OUTLOOK 2015 29 January 2015
Department of Finance
Government Buildings
Upper Merrion Street
Dublin 2
Ireland
www.finance.gov.ie
    @IRLDeptFinance

This presentation is for informational purposes only.
No person should place reliance on the accuracy of the data and should not act solely on the basis of the presentation itself.
The Department of Finance does not guarantee the accuracy or completeness of information which is contained in this document and which is
stated to have been obtained from or is based upon trade and statistical services or other third party sources. Any data on past performance
contained herein is no indication as to future performance.
No representation is made as to the reasonableness of the assumptions made within or the accuracy or completeness of any modelling, scenario
analysis or back-testing.
All opinions and estimates are given as of the date hereof and are subject to change.
The information in this document is not intended to predict actual results and no assurances are given with respect thereto.
Peter O’Flynn
Director
DTZ Sherry FitzGerald Cork
16Outlook 2015 How will Ireland's residential and commercial property markets perform this year … and beyond? 23 April 2015
Economy, An Overview

 % Change                       2011    2012    2013    2014    2015 f   2016 f   2017 f   2018 f

 Real GNP                       -1.6%   1.8%    3.3%    4.1%    3.6%     3.1%     3.1%     3.1%

 Real GDP                       2.2%    0.2%    0.2%    4.7%    3.9%     3.4%     3.4%     3.4%

 Exports                        5.4%    1.6%    1.1%    8.3%    4.8%     4.3%     4.3%     4.7%

 Investment                     -2.9%   5.0%    -2.4%   14.6%   12.7%    7.6%     7.5%     5.1%

 Consumption                    -1.6%   -0.3%   -0.8%   1.7%    2.7%     1.4%     1.3%     1.3%

 Unemploymen                    14.6%   14.7%   13.1%   11.4%   10.2%    9.4%     8.9%     8.1%
 t Rate

Source: Department of Finance

 GDP forecast to grow by 4.7% in 2014                                                               1
Quantitative Easing

   Stimulus package of €1.1trillion by September 2016 to purchase Government
   Bonds and asset-backed securities
   Economic impact
     • Devalue the Euro
     • Fall in Interest Rates
     • Increased Credit
     • Inflationary

   Property Impact
     • Reduce bond yields
     • Boosting European Property Appeal,
       yield compression
     • Beyond 2016, European property
       attractiveness will begin to diminish
     • Increase in yields in Euro area in
       general

QE – Stimulus
                                                                               2
Central Bank
Loan to Value (LTV) for principal Loan to Value (LTV) for Buy to Loan to Income (LTI) for PDH
dwelling houses (PDH)
Let mortgages (BTLs) mortgages
• PDH mortgages for non‐first
time buyers are subject to a BTL mortgages are subject to a PDH mortgage loans are subject
limit of 80 per cent LTV. limit of 70 per cent LTV. to a limit of 3.5 times loan to
• For first time buyers of gross income.
properties valued up to This limit can only be exceeded
€220,000, a maximum LTV of by no more than 10 per cent of This limit should not be
90 per cent will apply.
the euro value of all housing exceeded by more than 20 per
• For first time buyers of loans for non PDH purposes cent of the euro value of all
properties over €220,000 a 90
per cent limit will apply on the during an annual period. housing loans for PDH purposes
first €220,000 value of a during an annual period.
property and an 80 per cent
limit will apply on any excess
value over this amount.
The cumulative monetary value of
loans for principal dwelling
purposes which breach either of
these limits should not exceed 15
per cent of the euro value of all
PDH loans on an annual basis.
3SENTIMENTS SURVEY
Survey sent to 4,000 people on our Database of buyers. Early results
indicate …
• Looking at the overall results there is quite an amount of uncertainty as to
what the effects of the new Central Bank Requirement will be.
• 50% of the total sample think that the Central Bank requirements are fair.
• 74% of FTB feel that the new regulations will have a negative effect on
people buying a property.
• 70% overall feel the new requirements will have a negative effect on
people buying a property.
• 30% of FTB feel it will mean they will delay purchasing a property and
a further 15% are unsure.
• Of those FTB with mortgage approval, 60% believe it will not delay them.
Source: Sherry FitzGerald Research
4Residential Market
County by County analysis of Market Activity, 2014
Source: Sherry FitzGerald Research
5% Change in Available Property Jan 2014 – Jan 2015
Galway
‐27%
Source: Sherry FitzGerald Research
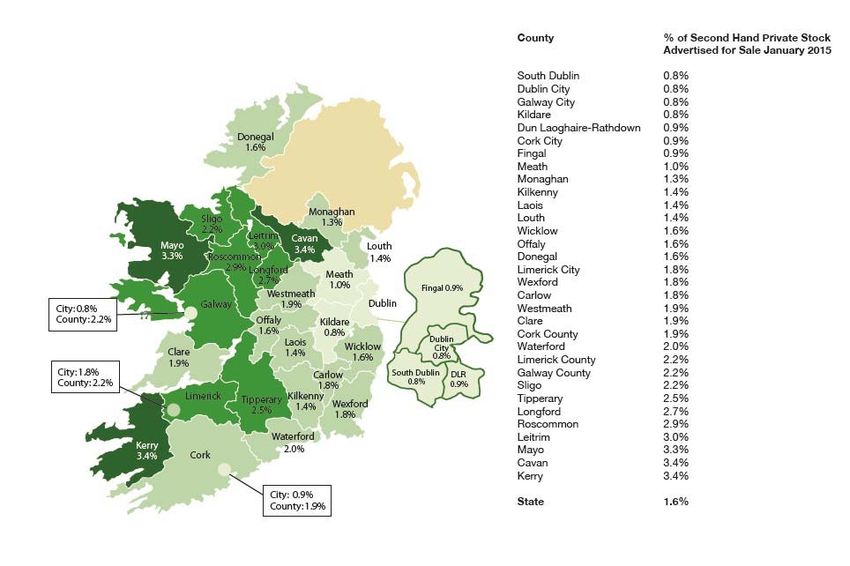
6% of Private Housing Stock Advertised
for Sale January 2015
Source: Sherry FitzGerald Research
7Profile of Vendors 2014
Nursing Home
Emigration
MBU Disability
1%
Other 3% 1%
5%
Larger House
10% Selling Investment
32%
Smaller House
10% National
Bank Repossession
11%
Relocating
14%
Executor Sale
13%
Source: Sherry FitzGerald Research
32% of Vendors “Selling Investment”
8Ireland Second Hand Market
250.0
200.0
Index Base Year = Q4 2001
150.0
100.0
50.0
0.0
Irish Market rose by 16.3% in 12 months to December 2014
92015: Base-line estimate for Price Performance – Nominal Capital Values Period Dublin Ireland 2 Years – to Q4 2016 9.4% 11.5% 5 Years – to Q4 2019 23.2% 25.7% Source: Sherry FitzGerald Research Ireland values up over 25% in Five years 10
Heat Map of Market Recovery

  Source: Sherry FitzGerald Research

                                       11
S err
Commercial Market, Investment and Occupier Trends • DTZ
Sherry fitzGerald
h y
]
fii.l.2014 – 2015: Improving!
Improving market confidence
Improving levels of market activity
Select – improvement in values
Building – Portfolio – Loan Sales through 2014
This trend is likely to accelerate in 2015
13Important Trends – 2014/2015
Dublin vs Cork & Regional Ireland
City Centre vs Suburbs
Modern vs Old
New buildings required - Offices, Residential
Viability challenge remains a concern
Large scale construction required
Financing - Challenge
14Comparing 2014 activity to 2015
2014 2015
€
€4.5 bn €9 bn €17 bn €30 bn Mix might be
Investment Residential Loan sales different especially
between loan sales and
activity activity investment activity
15Completed Investment Transactions
– Location Breakdown, 2014
Connaught
Munster
1%
Unknown 3%
3%
Multiple Locations
13%
Leinster
80%
Source – DTZ Sherry FitzGerald Research
16Completed Investment Transactions
– Investor Type, 2014
Private Investors
8%
Unknown Private Equity
11% Investors
34%
Joint Venture
12%
Institutions
12%
REIT
23%
Source – DTZ Sherry FitzGerald Research
17Completed Investment Transactions
– Investor Type, 2015
18S err
Cork New Business - 2014 h y ]
d
fii.l.Some 2014 Investment Sales
Property Details Image
Mathew House, • Sold September 2014
Father Mathew Street • €2,050,000
(Office) • Rent - €197,000
Anglesea House (IBRC) • Sold Quarter 2, 2014
(Office) • €2,700,000
• Disposal c. €140 per sq ft
Fullers Lodge, • Sale Agreed, Dec 2014
College Road • Excess of €2.2m
(Student Accommodation) • Gross Rent - €200,000
Building 5, • May 2014
EastGate Avenue, • €3,250,000
Little Island (Office) • Passing Rent - €320,000
20Some 2014 Investment Sales
Property Details Image
Units 1 & 2 • Sale Agreed, Dec 2014
Westside Retail • Price agreed in excess of €3.5m
Park, • Passing Rent - €385,000
Ballincollig
(Retail)
AIB, Pearse • Sale Agreed, Dec 2014
Street, Kinsale, • Price agreed in excess of €1.5m
Co Cork (Bank) • Passing Rent - €99,700
• Tenant – AIB
AIB, The • Sale Agreed Qtr4 2014
Quay, • Price - €2.2m
Waterford • Rent - €204,000
(Bank) • Tenant - AIB
Fat Face, Kinsale, • Sale Agreed, Dec 2014
Co Cork • Price agreed in excess of €900,000
(Retail) • Passing Rent - €80,000
21Irish Office Market, 2014
Source – DTZ Sherry FitzGerald Research
22Cork Market – Active Sectors
Office – Large Floorplates (Grade A):
Suburban Offices
City Centre Offices
Anchor Retail
Investments (7 years)
Suburban Housing
Agri Business
Student Accommodation
Healthcare
Hotels & Leisure
23Cork Market – More Challenged
City Centre Residential (Development)
Small Office Floorplates
Old Buildings
Small Shop Retail
Industrial
Secondary locations
(* High Risk with a mix of these
variables)
24Cork Office Market
Demand: 25,000 / 30,000 sq m annually
(c. 270,000 – 325,000 sq ft)
80% FDI/Large space enquiry
(c. 28,000 sq ft average size)
Market demand for large floor plates
– Grade A space
Good quality incubator space required
Existing FDI’s continue to grow – Tyco, EMC, VM Ware,
Apple, Lilly, Amazon
(Vacancy Rate: c. 18%)
25Cork Office – New Construction
City Centre – Albert Quay (x2), South Terrace,
Anderson Quay, Docklands
Mahon – Central Plaza/Motorola
Eastgate – M.25 Buildings
Airport – New Planning Application – 10,000 sq m
Cork Science & Technology Park
26Cork Office – Viability New Construction
City Centre: €270 p.s.m.
+
€25 + p.s.ft. +
Suburban: €215 p.s.m.+
€20 p.s.ft +
Business Parks: €190 p.s.m.+
€18 p.s.ft +
Grade A space only – no compromise
Reliant on an improving market
Domestic / Indigenous market will follow
27Industrial Market 2014/5
Weakening Euro, lower fuel costs, growth in on‐line sales, increased
exports all positive indicators for the market
The changing dynamics of the retail market will create a new driver
for the industrial sector. There is substantial year on year growth in
the click and collect market with large industrial accommodation
required to provide immediate turnaround times
Ireland will be an established hub for data centres with the climate a
main driver coupled with the access to power and data
Design and build facilities will outperform existing stock with the
main requirement arising from the pharma and tech sectors
Industrial accommodation will become more advanced with
automation and robotics and manufacturing systems
Less emphasis on Leinster - Uplift in regions
28Industrial – Values Remain Low
AV Rental: €47.50 p.s.m.
€4.40 p.s.f.
Capital Value: €50 p.s.f.
Capital Cost: €80 + p.s.f.
Not viable – Impact on Industrial Land value
Scope for ‘Build to order’ modern high bay buildings
Stronger locations – South Link Road, Little Island
improved demand
29Retail Market
Change in the ownership structure of retail in Ireland, going to lead to intense
asset management plans over next 3 -5 years.
Retail is going to be more of a partnership between landlords and tenants.
Dublin’s prime retail areas extending to surrounding streets e.g. H&M/
Abercrombie. Prime buildings as important as prime location
Redevelopment/ expansion of existing Centres: St. Stephen Green/ Liffey Valley/
The Square / Kildare Outlet Centre
Shopping Centres will evolved to provide more of a rounded experience and to
increase dwell time
Change as technology and the internet continue to evolve – click &collect,
impact likely to be greater in middle market
As more new homes are completed strong demand from occupiers for the
stronger retail parks in the larger urban centres.
30Retail – Shopping
Continued disposal of Cork Shopping Centres
Existing Retail Hubs
Anchor Retail Demand
Discount Retail Demand
Rising Household Expenditure
New Owners (Varde – Marathon – IPUT)
31Challenged Retail
Small shop
Secondary Retail
Old Building – Retail
Alternative Uses – Commercial
Change of Use to Residential
32Regional Commercial Forecast Rents
Q4 2014 Q4 2020 % Change
Cork Industrial €47.50 €60 26%
Cork Office €240 €300 25%
Cork Retail €2,000 €2,700 35%
Galway Industrial €43 €60 40%
Galway Office €193 €236 22%
Galway Retail €1,900 €2,700 42%
Limerick Industrial €38 €54 42%
Limerick Office €188 €215 14%
Limerick Retail €900 €1,350 50%
33Regional Commercial Forecast Yields
Q4 2014 Q4 2020
Cork Industrial 9.5% 9%
Cork Office 7.25% 7%
Cork Retail 6.75% 5.25%
Galway Industrial 10% 9%
Galway Office 8.25% 7%
Galway Retail 6.5% 5.5%
Limerick Industrial 10% 9%
Limerick Office 8.5% 7%
Limerick Retail 8% 5.5%
34Development Land
• Increase supply of infill sites anticipated in 2015
• Impact of Central Bank lending changes – market yet to react
• More portfolio land sales with opportunity for longer term
• Several significant housing and commercial site construction
• More transactions funded with bank debt finance
• Dublin to further consolidate its position as the two‐tier market
• Developers / land owners will broaden their horizon in terms of uses of land
i.e. multi‐family, student accommodation, nursing homes, step‐down etc.
• Regional cities and commuter towns are likely to benefit from the Central
Bank ruling
35Cork Market – Sample Land Values – Prime Locations
City Centre: €4M per acre
Suburban Retail (special): €2M per acre
Housing (South City): €400/€600,00 per acre
Office Park: €400,000 per acre
Industrial: €150,000 per acre
Agricultural: €12,000/€14,000 per acre
Very strong demand for housing land
36Residential – To Let Sector
Diminishing Supply
Major Growth in Demand
Rising Rentals – Risk
Crisis Sector – New ‘to let’ residential units are not
viable close to City Centre
Demand V Supply (Ability to deliver new stock)
New Ownership – Multi-family (Ires Reit – Kennedy
Wilson)
37Residential – New Construction
ESRI – 2,000 units per annum (Cork)
Viability Threshold – Cork City (22 locations)
Site Value – (15% not viable)
Central Bank rules
Most likely to see growth
Infrastructure Challenges – Planning - Regulation
382015 – The Growth Sectors
Retail
Grade A Offices
Development Land
Housing
Student Accommodation
Hotels / Leisure
Healthcare
39The Growth Locations
City Centre
District Centres – Mahon/Wilton/Blackpool
Satellite Towns – (Carrigaline/Ballincollig/Rail Corridor)
Ringaskiddy – (Port of Cork)
Docklands
40Slán
41Questions
59Thank you
60You can also read