Economy Watch Monitoring India's macro-fiscal performance - July 2020 - EY
←
→
Page content transcription
If your browser does not render page correctly, please read the page content below

Economy Watch
aaa

  Monitoring India’s
  macro-fiscal performance

  July 2020

Contents
     Foreword: Signs of green shoots amidst contractionary growth prospects                                      3

      1. Growth: IIP contracted by (-)34.7% in May 2020                                                          4

      2. Inflation: CPI inflation at 6.1% in June 2020 breached the RBI’s upper tolerance limit                  5

      3. Fiscal performance: fiscal deficit during April-May FY21 stood at 58.6% of the annual budgeted target   6

      4. India in a comparative perspective: global public debt projected to exceed 100% of GDP in 2020          8

      5. In focus: Trends in petroleum retail prices: sharing of revenue space between center and states         9

      6. Money and finance: credit growth fell to 6.2% in May 2020                                               16

      7. Trade and CAB: contraction in merchandise exports eased to (-)12.4% in June 2020                        18

      8. Global growth: IMF projected a global contraction of (-)4.9% in 2020                                    19

      9. Index of Macro Imbalance (IMI): pointed to an improvement in the macro-balance in 4QFY20                20

      10.Index of Aggregate Demand (IAD): pointed to continued deterioration in demand in May 2020               20

      11.Capturing macro-fiscal trends: data appendix                                                            21

Prepared by Macro-fiscal Unit, Tax and Economic Policy Group, EY India

D.K. Srivastava, Chief Policy Advisor, EY: dk.srivastava@in.ey.com
Muralikrishna Bhardwaj, Senior Manager, EY: muralikrishna.b@in.ey.com
Tarrung Kapur, Manager, EY: tarrung.kapur@in.ey.com
Ragini Trehan, Manager, EY: ragini.trehan@in.ey.com
Highlights
1. PMI manufacturing at 47.2 in June 2020 was close to the
   benchmark of 50 reflecting recovery during the month
   although still indicating a contraction.

2. CPI inflation was at 6.1% in June 2020, thereby crossing the
   upper tolerance limit of the monetary policy framework.

3. Center’s capital expenditure grew by 15.7% during April-May
   FY21 as compared to a contraction of (-)25.2% during the
   corresponding period of FY20, thereby indicating a
   frontloading of capital expenditure.

4. Center’s fiscal deficit during April-May FY21 stood at 58.6%
   of the annual budgeted target.

5. In May 2020 and in the first fortnight of June 2020, growth
   in bank credit remained low but positive at 6.2%.

6. Merchandise exports and imports contracted by (-)12.4% and
   (-)47.6% respectively in June 2020 reflecting a sustained
   demand slowdown.

7. India’s current account has posted a surplus of 0.1% of GDP in
   4QFY20. A current account surplus has appeared after 51
   quarters.

8. The IMF, in its June 2020 issue of World Economic Outlook,
   projected a global contraction of (-)4.9% in 2020.

9. Global crude prices, on a daily basis, crossed US$40/bbl. in
   mid-July 2020. On 23 July 2020, these were at
   US$42.9/bbl. (Brent) and US$40.9/bbl. (WTI crude).

                                              Economy Watch: July 2020   |   2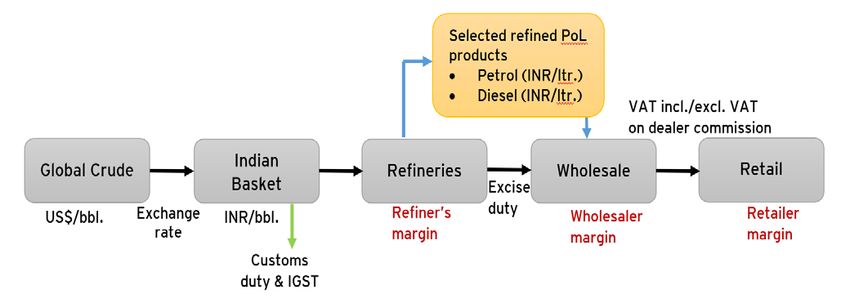
Home

                        Foreword
                        Signs of green shoots amidst contractionary growth prospects

Many multilateral institutions and rating agencies have revised India’s FY21 GDP growth forecast taking it from a positive
territory to a sharp contraction zone. India’s FY21 growth projections range from (-)3.2% (World Bank) to (-)9.5% (ICRA).
The IMF projected India’s FY21 GDP to contract by (-)4.5%. This is only marginally better than IMF’s projection of a global
contraction of (-)4.9% for 2020. The sharp downward revision in India’s growth by various national and international
agencies indicates the deleterious impact of the lockdown. Anticipating this, the Government of India had already
embarked upon significant monetary and fiscal stimuli from March 2020. These stimuli measures are beginning to show
positive impact as reflected by some high frequency indicators.
High frequency indicators of economic activities have been showing signs of green shoots particularly in the month of June
2020. PMI manufacturing at 47.2 in June 2020 showed a significant increase compared to its level at 30.8 in May 2020.
The level of 47.2 is encouragingly close to the benchmark level of 50. GST collections in June 2020 rose to INR90,917
crores, which again, is close to the expected monthly benchmark of INR1,00,000 crores. Contraction in power
consumption eased to (-)9.8% in June 2020 as compared to (-)15.9% in May 2020. There is a consistent improvement on
monthly basis, in the consumption of petrol and diesel even though these have not normalized as yet. In June 2020, petrol
consumption showed a reduced rate of contraction at (-)13.6% as compared to (-)35.3% in May 2020. Similarly, with
respect to diesel consumption also, there was a reduction in the pace of contraction from (-)29.4% in May 2020 to (-)15.4%
in June 2020. IIP also improved to a level of 88.4 in May 2020, increasing from 53.6 in April 2020. Center’s capital
expenditure grew by 15.7% during April-May FY21 as compared to a contraction of (-)25.2% during the corresponding
period of FY20. This frontloading of government’s capital expenditure augers well for the National Infrastructure Pipeline
(NIP). Credit growth has remained positive but subdued at 6.1% in the fortnight ending 3 July 2020. Contraction in
merchandise exports eased significantly to (-)12.4% in June 2020 from (-)36.5% in May 2020. A merchandise trade surplus
was also observed for the first time in more than 18 years at US$0.8 billion in June 2020. FPI inflows increased to US$3.4
billion in June 2020 as compared to outflows of US$1.0 billion in May 2020. Foreign exchange reserves peaked at US$517
billion as on 19 July 2020, rising from US$506 billion as on 26 June 2020.
CPI data released on 13 July 2020 showed an inflation rate of 6.1% in June 2020. The overall CPI inflation rate was not
reported for the months of April and May 2020. Recalling that CPI inflation rate was in excess of the prescribed upper
tolerance limit of 6% in the months also of December 2019, January and February 2020 respectively at 7.4%, 7.6% and
6.6%, it is clear that the monetary policy framework has been breached in the COVID period and some months preceding it.
The center’s Fiscal Responsibility and Budget Management Act (FRBMA) threshold for fiscal deficit is also likely to be
breached in FY21 with the center’s estimated fiscal deficit at 5.6% or above of the estimated GDP. These exceptions may
well be justified given the extraordinary situation created by the global pandemic. These also point to weaknesses in the
monetary and fiscal policy frameworks since these were not designed to cope with such structural economic breaks as
posed by a calamity like COVID-19.
The European Council recently agreed to initiate a ‘Next Generation EU recovery fund’, amounting to €750 billion
(US$886.4 billion). This large stimulus package would augment demand and liquidity in the global context. In India’s case
also, an additional fiscal stimulus has been implemented with the central government extending its existing PM Garib
Kalyan Anna Yojana up to November 2020 from its earlier applicability until June 2020. This involves an additional
expenditure amounting to INR90,000 crores, taking the overall size of the scheme to INR1.5 lakh crore from its earlier
envisaged level of INR60,000 crores. This takes the size of fiscal stimulus based on budgetary resources to about 1.4% of
estimated FY21 GDP*.
One important issue concerning both the central and state governments relates to taxation of petroleum (PoL) products
that have remained outside GST. Governments at both levels have been increasing the non-GST taxes on PoL products
under their respective control leading to high retail prices even as global crude prices remain low. This issue is discussed at
length in this month’s In Focus entitled, Trends in petroleum retail prices: sharing of revenue space between center and
states.

D.K. Srivastava
Chief Policy Advisor, EY India

* In-Focus section titled ‘Deciphering India’s stimulus package: the sum and fiscal substance’, EY Economy Watch, May 2020
                                                                                            Economy Watch: July 2020         |   3
Home
1. Growth: IIP contracted by (-)34.7% in May 2020
A. IIP: the index value increased to 88.4 points in May 2020 from 53.60 in April 2020
► The nationwide lockdown since end-March 2020 and the subsequent periods of conditional relaxations have
had an adverse impact on the output of industrial sector as also the compilation of related data. As per the
quick estimates of IIP for May 2020 released by MoSPI on 10 July 2020 1, IIP showed a contraction of (-
)34.7% in May 2020, lower than (-)57.6% (revised) in April 2020 2 (Chart 1).
► Output of all the three sub-sectors contracted for the third consecutive month. Output of manufacturing and
mining sectors declined by (-)39.3% and (-)21.0% respectively in May 2020 as compared to (-)67.1%
(revised) and (-)27.0% (revised) respectively in April 2020. Electricity sector output also declined by (-
)15.4% in May 2020 as compared to (-)23.0% in April 2020 (Table A1 in data appendix).
► Output of capital goods and consumer durables declined sharply by (-)64.3% and (-)68.5% respectively in
May 2020 as compared to (-)92.6% and (-)96.0% respectively in April 2020. Output of consumer non-
durables declined at a slower pace of (-)11.1% in May 2020 as compared to (-)48.7% in April 2020.
► Output of eight core infrastructure industries (core IIP) contracted by (-)23.4% in May 2020 as compared to
(-)37.0% (revised) in April 2020. Output of all eight sub-industries contracted for the second consecutive
month in May 2020. The decline continued to be sharp in steel ((-)48.4%), cement ((-)22.2%), petroleum
refinery products ((-)21.3%) and electricity ((-)15.6%).
Chart 1: IIP growth and PMI
10 70
0 60
-10 47.2 50
IIP contracted for the
-20 40
-30 33.7 30 third consecutive month
-40 20 by (-)34.7% in May 2020
-50 10 as compared to (-)57.6% in
-60 0 April 2020.
Aug-18
Aug-19
Apr-19
Apr-20
Oct-18
Oct-19
Dec-19
Feb-20
Jun-20
Jun-18
Dec-18
Feb-19
Jun-19
IIP (% growth, LHS) PMI (manufacturing, RHS)
PMI (services, RHS) PMI benchmark (RHS)
Source: Office of the Economic Adviser, Ministry of Commerce and Industry and IHS Markit
B. PMI signaled a slower pace of contraction in manufacturing and services in June 2020
► Headline manufacturing PMI (seasonally adjusted (sa)) increased to 47.2 in
June 2020 from 30.8 in May 2020 (Chart 1). Despite the increase, the In June 2020, both PMI
latest index value pointed to the third successive month of contraction in manufacturing and
manufacturing activity although at a slower pace as compared to that in services contracted but
April and May 2020. at a slower pace as
► PMI services increased to 33.7 in June 2020 from 12.6 in May 2020, compared to April and
although remaining lower than 50 for the fourth successive month in June May 2020. PMI
2020. manufacturing at 47.2
was close to the
► Reflecting a slower pace of contraction in private sector output, the benchmark level of 50.
composite PMI Output Index (sa) increased to 37.8 in June 2020, up from
14.8 in May 2020.
1
Quick estimates of IIP and use-based index for the month of May 2020 - http://www.mospi.gov.in/sites/default/files/iip/iipMay20.pdf
2
As such, these index numbers are not strictly comparable with any of the previous months. The quick estimates of IIP for May 2020 was
based on an improved response rate of 91% as compared to 87% in April 2020.
Economy Watch: July 2020 | 4Home
2. Inflation: CPI inflation at 6.1% in June 2020 breached the
RBI’s upper tolerance limit
CPI inflation remained high at 6.1% in June 2020 (Chart 2), as compared to a level of 5.8% in March
2020 3, partly due to high food-based inflation and increasing fuel prices.
► Fuel and light-based inflation increased to 2.7% in June 2020 from 1.4% in May 2020 largely due to higher
prices of LPG.
► Core CPI inflation 4 was at an 18-month high of 5.3% in June 2020 mainly reflecting higher inflation in the
transportation services and services related to education and personal care and effects.
► Inflation in transportation and communication services was at an 18-month high of 7.1% in June 2020
reflecting higher retail selling prices of petrol and diesel used for transportation.
► Housing-based inflation moderated to 3.5% in June 2020 from 3.7% in May 2020.
► Consumer food price inflation remained elevated at 7.9% in June 2020 although lower as compared to 9.3%
in May 2020. Inflation in vegetables and fruits moderated to 1.9% and (-) 0.7% respectively from 5.3% and
2.1% respectively over the same period.
Chart 2: inflation (y-o-y, in %)
9.0
7.0 6.1
5.0 CPI based inflation was
3.0
5.3 high at 6.1% in June
2020 due to a) high
1.0
food-based inflation at
-1.0 7.9%, b) rising fuel
-1.8
-3.0 prices and c) high core
-5.0 CPI-based inflation at
5.3%.
Mar-19
Apr-19
Jul-19
Jun-19
Mar-20
Apr-20
Feb-19
Aug-19
Sep-19
Oct-19
Jun-20
Jan-19
May-19
Nov-19
Dec-19
Feb-20
Jan-20
May-20
CPI-based inflation Core-CPI based inflation WPI-based inflation
Source: MoSPI, Office of the Economic Adviser, Government of India (GoI)
Note: CPI and core CPI inflation have been interpolated using their respective data for the months of March and May 2020
The contraction in WPI was lower at (-)1.8% in June 2020 as compared to (-)3.2% in May 2020, partly due to
lower pace of contraction in crude and mineral oils.
► Crude prices contracted for the fifth successive month, although at a slower pace of (-)41.5% in June 2020
as compared to (-)58.5% in May 2020.
► Contraction in fuel and power prices eased to (-)13.6% in June 2020 as compared to (-)19.8% in May 2020.
This was led by a moderation in contraction in prices of diesel and naptha to (-)25.1% and (-)34.9%
respectively in June 2020 from (-)30.0% and (-)69.3% in May 2020.
► Wholesale food price inflation increased to 3.1% in June 2020 from 2.3% in May 2020 as contraction in fruits
and vegetables prices reduced to (-)4.5% from (-)7.0% over the same period.
► Inflation in manufactured products turned positive at 0.1% in June 2020 from (-)0.4% in May 2020 led by a
reduced pace of contraction in prices of manufactured basic metals at (-)4.4% as compared to (-)5.8% over
the same period.
► Core WPI based inflation continued to contract for the twelfth successive month at (-) 0.8% in June 2020 as
compared to (-) 1.3% in May 2020 indicative of a sustained domestic demand slowdown.
3
Headline CPI inflation data was not released for April and May 2020. Due to the nation-wide lockdown to contain the spread of COVID-19,
price data of only select groups/sub-groups could be collected which was subsequently released by the government.
4
Core CPI inflation is measured in different ways by different organizations/agencies. Here, it has been calculated by excluding food, and
fuel and light from the overall index.
Economy Watch: July 2020 | 5Home
3. Fiscal performance: fiscal deficit during April-May FY21
stood at 58.6% of the annual budgeted target
A. Tax and non-tax revenues
► As per the Comptroller General of Accounts (CGA) 5, gross central taxes during April-May FY21 contracted
sharply by (-)41.2% as compared to a subdued growth of 0.2% in April-May FY20 (Chart 3). Both direct and
indirect taxes contracted on a y-o-y basis during the first two months of FY21.
► As a proportion of the annual budgeted target, gross taxes during April-May FY21 stood at 5.2% as
compared to 8.7% in April-May FY20.
► Direct tax revenues contracted by (-)14.6% during April-May FY21 as compared to a growth of 12.1% during
the corresponding period of FY20.
► Corporate tax revenues (CIT) showed an abnormally high growth during April-May FY21 as compared to a
sharp contraction in the corresponding period of FY20 due to relatively low CIT refunds in May 2020 vis-à-
vis May 2019.
► The initial months of a fiscal year are usually characterized by CIT refunds. Year-to-year variations in the
magnitude of these refunds contribute significantly to the variation in revenues collected during April-May.
Historically, CIT revenues have shown extremely high positive as well as negative growth rates on a y-o-y
basis during April to May.
► Income tax revenues contracted by (-)41.0% during April-May FY21 as compared to a growth of 15.0%
during the corresponding period of the previous year.
► Indirect taxes (comprising union excise duties, service tax, customs duty, CGST, UTGST, IGST 6 and GST
compensation cess) showed a sharp contraction of (-)52.5% during April-May FY21 as compared to a
contraction of (-)4.0% during April-May FY20.
Chart 3: growth in central tax revenues during April-May (y-o-y, in %)
As per the CGA, center’s
80 gross taxes during April-
60 May FY21 contracted
40 sharply by (-)41.2% as
compared to a growth of
20 38.3 29.9
12.8 25.0 0.2 0.2% in FY20. Both direct
0 and indirect taxes
-20 FY16 FY17 FY18 FY19 FY20 contracted on a y-o-y
-41.2 basis during the first two
-40
-60 months of FY21.
Gross tax revenues Direct taxes Indirect taxes
Source: Monthly Accounts, Controller General of Accounts (CGA), Government of India
Notes: (a) Direct taxes include personal income tax and corporation tax, and indirect taxes include union excise duties, service tax, customs duty, CGST,
UTGST, IGST and GST compensation cess; (b) other taxes (securities transaction tax, wealth tax, fringe benefit tax, banking cash transaction tax, etc.) are
included in the center’s gross tax revenues along with direct and indirect taxes.
► Center’s non-tax revenues showed a contraction of (-)61.9% during April-May FY21 as compared to a growth
of 18.2% in the corresponding period of previous year. As a proportion of the annual budgeted target, non-
tax revenues during April-May FY21 stood at 2.8% as compared to 9.1% in April-May FY20.
► The central government has so far not undertaken any disinvestment of its equity holdings in FY21. The
FY21 target for disinvestment stands at INR2,10,000 crores.
5
Monthly accounts for May 2020 released on 30 June 2020
6
IGST revenues are subject to final settlement
Economy Watch: July 2020 | 6Home
B. Expenditures: revenue and capital
► Center’s total expenditure during April-May FY21 contracted by (-)0.2% as compared to a growth of 8.5%
during the corresponding period of FY20.
► As a proportion of the annual budgeted target, center’s total expenditure during April-May FY21 stood at
16.8% as compared to 18.4% during the corresponding period of FY20.
► Revenue expenditure contracted by (-)1.9% during April-May FY21 as compared to a growth of 13.7% during
the corresponding period of FY20 (Chart 4).
► Center’s capital expenditure grew by 15.7% during April-May FY21 as compared to a contraction of (-)25.2%
during the corresponding period of FY20. This indicates frontloading of capital expenditure by the central
government. However, as percentage of budgeted capital expenditure, it was at 13.4% in April-May FY21 as
compared to 14.1% in April-May FY20.
Chart 4: growth in central expenditures during April-May (y-o-y, in %)
80
58.1
60
40 53.5 During April-May FY21,
21.4 center’s revenue
17.6 15.7
20 13.7
2.7 expenditure contracted
0.7 by (-)1.9% while capital
0 -12.0
-7.6 -1.9 expenditure grew by
-25.2
-20 15.7%.
-40
FY16
FY17
FY18
FY19
FY20
Revenue expenditure Capital expenditure
Source (basic data): Monthly Accounts, Controller General of Accounts (CGA), Government of India
C. Fiscal imbalance
► Center’s fiscal deficit during April-May FY21 stood at 58.6% of the annual budgeted target as compared to
52.0% in the corresponding period of the previous year (Chart 5).
► The FY21 revised fiscal deficit target as per center’s revised gross borrowing program stands at 5.6% of
estimated FY21 GDP as compared to the annual budgeted target of 3.5% of GDP.
► Center’s revenue deficit during the first two months of FY21 stood at 67.6% of the annual budgeted target
as compared to 66.3% in the corresponding period of FY20.
Chart 5: fiscal and revenue deficit during April-May as percentage
of annual budgeted target
120 100.5
100 During April-May FY21,
66.3 67.6 center’s fiscal deficit
80 68.0
56.2 stood at 58.6% of the
60 43.8 annual budgeted target
40 while the corresponding
68.3
58.6
55.3
number for revenue
52.0
42.9
37.5
20
deficit was 67.6%.
0
FY16 FY17 FY18 FY19 FY20
Fiscal deficit Revenue deficit
Source: Monthly Accounts, Controller General of Accounts (CGA), Government of India.
Economy Watch: July 2020 | 7Home
4. India in a comparative perspective: global public debt
projected to exceed 100% of GDP in 2020
General government fiscal balance as percentage of GDP
► The COVID-19 pandemic has led to a steep
contraction in output and government revenues. Table 1: general government fiscal balance
The large discretionary fiscal measures (percentage of GDP)
undertaken by all major economies have resulted 2018 2019 2020 2021
in a surge in government deficits and debt levels. AEs -2.7 -3.3 -16.6 -8.3
► The IMF estimated the announced fiscal measures US -5.8 -6.3 -23.8 -12.4
at nearly US$11 trillion globally as compared to Euro area -0.5 -0.6 -11.7 -5.3
US$8 trillion estimated in April 2020. UK -2.2 -2.1 -12.7 -6.7
► The general government fiscal deficit at the global Japan -2.5 -3.3 -14.7 -6.1
level is projected to increase to 13.9% of GDP in EMDEs -3.8 -4.9 -10.6 -8.5
2020, 10% points higher than that in 2019. It is Brazil -7.2 -6.0 -16.0 -5.9
expected to narrow in 2021 but remain Russia 2.9 1.9 -5.5 -3.9
significantly above the levels in 2018 and 2019. India* -6.3 -7.9 -12.1 -9.4
China -4.7 -6.3 -12.1 -10.7
► In advanced economies (AEs), government fiscal South
deficit to GDP ratio is projected to increase to -4.1 -6.3 -14.8 -11.0
Africa
16.6% in 2020, 13% points higher than that in World -3.1 -3.9 -13.9 -8.2
2019. With additional fiscal packages announced Source (basic data): WEO Update, IMF, June 2020
during April to June 2020, fiscal deficit relative to Note: (1) actuals for 2018 and 2019 and forecasts for 2020 and 2021,
(2) -ve indicates deficit while +ve indicates surplus
GDP in 2020 is forecasted at 23.8% in the US, *data pertains to fiscal year.
followed by Japan at 14.7% and the UK at 12.7%.
These levels are much higher as compared to those projected by the IMF in April 2020.
► In EMDEs, fiscal deficit relative to GDP is estimated to rise to 10.6% in 2020 from 4.9% in 2019 reflecting
fiscal expansion, output contraction, lower commodity revenues and higher external borrowing costs.
► Fiscal deficit relative to GDP in 2020 is estimated to be the highest in Brazil (16.0%), followed by South
Africa (14.8%) and India and China (12.1%). Russia is projected to have a fiscal deficit of 5.5% of GDP in
2020 as compared to a surplus in 2018 and 2019.
General government gross debt as percentage of GDP
► Global public debt is projected to reach an all-time Table 2: general government gross debt
high of 101.5% of GDP in 2020, an increase of (percentage of GDP)
nearly 19% points from its level in 2019.
► The IMF assessed that government revenues are 2018 2019 2020 2021
expected to fall more than the output and are AEs 104.0 105.2 131.2 132.3
expected to be 2.5% points of GDP lower, on US 106.9 108.7 141.4 146.1
Euro area 85.8 84.1 105.1 103.0
average, than in 2019, reflecting lower incomes
UK 85.7 85.4 101.6 100.5
and subdued private consumption. Lower
Japan 236.6 238.0 268.0 265.4
revenues are expected to contribute significantly
EMDEs 48.9 52.4 63.1 66.7
to higher deficit and debt levels. Brazil 87.1 89.5 102.3 100.6
► General government debt relative to GDP in AEs is Russia 13.5 13.9 18.5 18.8
projected to increase to 131.2% in 2020 from India* 69.6 72.2 84.0 85.7
105.2% in 2019. China 47.0 52.0 64.1 70.7
► Government debt to GDP ratios in Japan and the South Africa 56.7 62.2 79.9 84.6
World 81.2 82.8 101.5 103.2
US are expected to be above the average for AEs.
Source (basic data): WEO Update, IMF, June 2020
These are estimated at 268% for Japan and Note: (1) actuals for 2018 and 2019 and forecasts for 2020 and 2021,
141.4% for the US in 2020. (2) -ve indicates deficit while +ve indicates surplus
*data pertains to fiscal year.
► Government debt relative to GDP in EMDEs has
remained much below that in AEs. In 2020, debt to GDP ratio in EMDEs is projected at 63.1%, an increase of
10.7% points from its level in 2019.
► Government debt to GDP ratio for Brazil is expected to exceed 100% in 2020. India’s debt to GDP ratio is
projected at 84%, followed by South Africa at nearly 80% and China at 64.1%.
Economy Watch: July 2020 | 8Home
5. In focus: Trends in petroleum retail prices: sharing of
revenue space between center and states
Introduction
While the global crude prices have remained low since March 2020, the domestic prices of petrol and diesel
(hereinafter referred to as petroleum, oil and lubricants (PoL) products) have been increasing in recent weeks.
For example, in Delhi, the price of petrol has risen from INR 71.9/ltr as on 07 June 2020 to INR 80.4/ltr as on
27 July 2020 7. Given the contraction in center’s gross tax revenues (GTR) in FY20 and the erosion in tax
buoyancy in recent years constraining both central and state revenues, there has been a competition between
the center and the states to take advantage of the lower global crude prices by increasing taxes on PoL products
under their respective control. This has led to increased retail prices of PoL products leading to the unexpected
situation of falling global crude prices with rising domestic prices of PoL products much to the detriment of the
industrial users and consumers.
As a result, there are extensive debates about the reasons and implications of this trend. The gap between
domestic prices and global crude price is meant to be shared between different stakeholders. Five of these
stakeholders are the following: (a) oil refinery units, (b) oil marketing companies (OMCs), (c) central government,
(d) state governments and (e) users comprising both consumers and producers. The central and state
governments have a critical role in the determination of the retail prices even though these retail prices are
meant to respond to market signals. The reason for this is the revenue implications for the central and state
governments linked to the excise taxation of PoL products by the central government and the levy of state VAT/
sales tax by the state governments. In this write-up, we examine whether the central and state governments
have used the available space excessively to make up for the revenue loss on account of other taxes. This may
have an adverse impact on inflation and eventually on economic growth.
Movement of global crude prices and Indian crude basket
Chart 6 shows the movement of global crude prices over a long period of time, starting FY01 to the current
period. The chart has three parts showing annual, quarterly and monthly price movements. It can be seen that
global crude prices and the price of Indian crude basket have moved closely together throughout the period
under consideration. Both reached a trough in April 2020.
Chart 6: global crude price (US$/bbl.): annual, Chart 7: Indian crude basket (US$/bbl.): annual,
quarterly and monthly quarterly and monthly
120 120
107.2 111.9
100 100
80 80 74.6
73.0 64.3
60 63.4 60
39.5 40.6
40
40
20
20 22.6 19.9
23.1
21.0 0
0
Apr-20
Jun-20
Feb-20
FY01
FY03
FY05
FY07
FY09
FY11
FY13
FY15
FY17
FY19 Q1
FY19 Q3
FY20 Q1
Oct-19
Dec-19
Apr-20
Jun-20
Feb-20
FY01
FY03
FY05
FY07
FY09
FY11
FY13
FY15
FY17
FY19 Q1
FY19 Q3
FY20 Q1
Oct-19
Dec-19
Source (basic data): World Bank, PPAC
Source (basic data): World Bank, PPAC
Note: Global crude price is the simple average of three spot prices, namely, Dated Brent, West Texas Intermediate and Dubai Fateh
Retail prices of the PoL products in India are based on a cost-mark up system reflecting margins of refiners,
wholesalers and retailers, and taxes that cascade, covering customs, central excise and VAT. Global crude prices
are translated into retail prices for PoL products in India through a number of steps. First, crude oil is imported/
procured by the oil refineries in India. At this point, crude oil is refined into various PoL products for use by
industrial users and consumers. These products are supplied to OMCs. Some of the oil companies work as both
refiners and as marketing companies. When the products come out of the OMCs, the units of the products are
changed. On the relevant units, ex-refinery costs are determined. On this base price, central excise duty is levied
7
PPAC, RSP of Petrol and Diesel; https://www.ppac.gov.in/WriteReadData/userfiles/file/PP_9_a_DailyPriceMSHSD_Metro_27_7_2020.pdf;
as accessed on 27 July 2020
Economy Watch: July 2020 | 9Home
and dealer’s commission is also added. State VAT is levied on a price that includes the ex-refinery price, the
central excise duty and the dealer’s commission. However, in many states, VAT is levied on a base price which
excludes dealer’s commission. After the levy of state VAT, we arrive at the retail selling price of PoL products.
The process of transition from global crude to domestic retail pricing is summarized in Chart 8.
Chart 8: process of transition from global crude to retail selling price
Source: Prepared by Authors
Table 3 provides, illustratively, the price build-up and the relative share of taxes and other cost components in
respect of petrol and diesel in Delhi.
Table 3: price build-up of petrol and diesel in Delhi on 16 July 2020
Sr. no. Elements Unit Price Share in final price (%)
Diesel Petrol Diesel Petrol
1 Base price/Ex-refinery price INR/ltr 27.52 24.92 33.9 31.0
2 Freight INR/ltr 0.3 0.33 0.4 0.4
3=1+2 Price charged to dealers (excluding INR/ltr 27.82 25.25
31.4
Excise duty and VAT) 34.3
4 Central taxes (excise duty) INR/ltr 31.83 32.98 39.2 41.0
5 Dealer commission (Average) INR/ltr 2.55 3.6 3.1 4.5
6 State taxes (VAT including VAT on INR/ltr 18.98 18.56
23.1
dealer commission) 23.4
7=3+4+5+6 Retail selling price at Delhi INR/ltr 81.18 80.43 100.0 100.0
Source: PPAC, Indian Oil (https://www.iocl.com/Products/PetrolDieselPrices.aspx)
Sharing of revenue space: central and state governments
Central taxes consist of basic excise duty, additional excise duty 8(AED), special additional excise duty (SAED) on
the central excise on POL products. The basic excise duty is sharable with the states while the remaining two
components are not. Excise duty is levied on a specific basis upon the price charged to dealers. State VAT is
levied mainly as an ad-valorem tax on the value arrived at by adding the price charged to dealers (excluding
excise duty and VAT), central taxes and in some states, the dealer commission. By virtue of being ad-valorem in
nature, state VAT tends to fall as the price of crude falls, given the specific excise duty rate. In some states, VAT
is a combination of ad valorem and specific taxes.
We can analyze the relative share of the central and the state governments in the revenue space provided by
petroleum taxes in two parts: (a) before devolution of taxes and (b) after devolution. Here devolution refers to
the sharing of center’s basic excise duty revenue on PoL products. The SAED and AED are not sharable with
states.
8
Clause 110 of the Finance Bill 2018 provides that the government will levy an additional duty of excise to be called the Road and
Infrastructure Cess on the goods mentioned in the schedule 6 (motor spirit and high speed diesel oil) being the goods manufactured or
produced at INR 8 per ltr. for the purpose of financing infrastructure projects. The cess leviable shall be in addition to any other duties of
excise chargeable on such goods under the Central Excise Act, 1944 or any other law for the time being in force. With this amendment, the
erstwhile Road Cess (additional excise duty) was replaced by the Road and Infrastructure Cess (additional excise duty).
https://www.cbic.gov.in/resources/htdocs-cbec/ub1819/finbill2018.pdf
Economy Watch: July 2020 | 10Home
Chart 9 shows that pre-devolution, the center had the relatively smaller share 9 in the period covering FY12 to
FY15. This trend was reversed from FY16 onwards. Prior to FY16, the state taxes 10 accounted for a much larger
share ranging from 58.1% to 62.3%. The central taxes can be divided into two parts, namely, taxes that are
sharable with states and taxes that are not. The non-sharable portion of central taxes has increased beginning
FY18 with a considerable increase in FY19 and FY20 (P).
Chart 9: pre devolution share of the center and state in total tax revenues from PoL products (%)
70.0
62.3 59.3
59.3 61.1 58.1 55.3
60.0 55.6 51.6 52.7
50.0 22.3
40.7 38.9 41.9 44.4
37.7 40.7 44.7 48.4 47.3
40.0
27.3 28.3
30.0 18.6 18.2
17.5 16.8
34.2 36.9
20.0 37.0
23.7 28.3 27.0
10.0 22.1 21.4 20.9 17.4 15.8
0.0
FY12 FY13 FY14 FY15 FY16 FY17 FY18 FY19 FY20 (P)
Sharable Central taxes Non-sharable Central taxes
Total Excise Duty State Taxes
Source: PPAC, Ministry of Petroleum and Natural Gas, GoI; Union Budgets 2013-14 to 2020-21
Chart 10 shows the sharing of revenue space after considering the impact of the sharing of basic excise duty
under the recommendations of the 13th and 14th finance commissions respectively. In this case, the states
received a relatively larger share throughout the period under consideration. It is however noticeable that the
excess of states’ share over that of the center started to come down sharply from FY16 onwards. From this
year, the recommendation of the 14th finance commission which uplifted state’s share in divisible central taxes
from 32% to 42% became applicable. However, despite this increase in states’ share in the basic excise duties,
the overall share of the states came down because of the increases in the non-sharable portion of center’s taxes
on PoL products 11. This difference has progressively come down since FY16. From a peak of 38% points in
FY14, this difference has fallen to 7.9% points in FY20 (P), indicating that the available revenue space has
largely been pre-empted by the central government.
Chart 10: post devolution share of center and states in tax revenues from PoL products
80.0 40.0
67.9 69.0
66.4 65.6 35.0
70.0
56.3 56.2 56.1 30.0
60.0 55.7 54.0
25.0
50.0 38.0 20.0
35.8
32.8 31.3 15.0
40.0 43.7 43.8 43.9 44.3 46.0
10.0
30.0 32.1 34.4 12.6 12.5 12.1
33.6 31.0 11.5
7.9 5.0
20.0 0.0
FY12 FY13 FY14 FY15 FY16 FY17 FY18 FY19 FY20 (P)
difference (% points, RHS) Share of center (%, LHS) Share of states (%, LHS)
Source: PPAC, Ministry of Petroleum and Natural Gas, GoI; Union Budgets 2013-14 to 2020-21
9
Central taxes refer to basic excise duty, AED and SAED. It excludes customs duty, cess on crude oil, service tax levied prior to GST, and
CGST and IGST
10
State taxes include only state VAT levied on Petroleum, Oil and Lubricants (POL) products but excludes entry tax, octroy and electricity
duty paid on inputs
11
In-Focus section entitled ‘Overcoming center’s fiscal constraints with infrastructure-centered investment strategy’ in the June 2020 issue
of the EY Economy Watch.
Economy Watch: July 2020 | 11Home
Sharing of VAT revenue: pattern of inter-state shares
For examining the sharing of the VAT revenue from PoL products amongst states, we have selected 10 major
states, accounting for nearly 75% of the total states’ revenue from VAT on PoL products (Table 4). The largest
share accrues to Maharashtra followed by Uttar Pradesh and Tamil Nadu. This pattern reflects the relative size
of these state economies in terms of their share in GSDP which also indicates the share of use and consumption
of PoL products in these economies. In the middle ranges are states like Karnataka, Gujarat, Rajasthan and
Madhya Pradesh. These data also indicate the changes over time, in the shares of individual states. In some
cases, there has been a noticeable fall. This is particularly visible in the case of Gujarat, whose share in VAT on
PoL products fell from 11.6% in FY15 to 7.7% in FY20 (P). There are marginal improvements in the relative
shares in the case of Uttar Pradesh, Rajasthan, and Telangana, comparing FY20 with FY15.
Table 4: state-wise share in total VAT revenue from PoL products
# State FY15 FY16 FY17 FY18 FY19 FY20 (P)
1 Maharashtra 14.4% 13.6% 13.9% 13.6% 13.5% 13.4%
2 Uttar Pradesh 9.2% 9.9% 9.5% 9.4% 9.5% 10.0%
3 Tamil Nadu 9.0% 7.7% 7.5% 8.3% 9.0% 9.1%
4 Karnataka 6.3% 6.1% 6.7% 7.2% 7.2% 7.7%
5 Gujarat 11.6% 10.3% 9.6% 8.4% 8.1% 7.7%
6 Rajasthan 6.1% 6.5% 6.4% 6.5% 6.3% 6.7%
7 Madhya Pradesh 5.0% 5.3% 5.5% 5.0% 4.7% 5.4%
8 Andhra Pradesh 6.4% 5.5% 5.4% 5.2% 5.4% 5.1%
9 Telangana 3.3% 4.5% 4.5% 4.7% 5.0% 5.0%
10 Kerala 3.9% 4.3% 4.1% 3.9% 4.0% 4.0%
11 Other states/UTs 24.8% 26.4% 26.8% 27.7% 27.4% 26.0%
Total 100.0% 100.0% 100.0% 100.0% 100.0% 100.0%
Source: PPAC
Oil prices: impact on India’s macro economy
Influence of global crude prices on the Indian economy is transmitted through a high import bill and an increase
in the cost of production of all goods and services where PoL products are used as inputs. Growth, inflation,
current account balance (CAB) and fiscal balance are adversely impacted by increasing global crude prices.
Table 5 gives some estimates of the impact of an increase of US$10/barrel in global crude prices on India’s
macroeconomic parameters like GDP growth, inflation, CAB, and fiscal balance.
Table 5: estimates of impact of a US$10/barrel rise in crude price on the Indian economy
# Impacted RBI (2019) RBI (2017)* Economic SBI** Nomura@
parameter Survey
1 GDP Growth ((-) 0.15% points 0.2-0.3% 0.16%
impact) points points
2 Inflation CPI: CPI: 0.30% WPI: 1.7% CPI: 0.3% CPI: 0.6-
(+ impact) 0.49% points (at USD points points points 0.7% points
65/bbl.); 0.58% points
(at USD55/bbl.)
3 CAB ((-) impact) 0.43% points US$ 9-10 0.27% 0.4% points
billion points
4 Fiscal balance 0.43% points 0.08% 0.1% points
((-) impact) points
Source: Mint street memo no. 17, “The impact of crude price shock on India’s current account deficit, inflation, and fiscal deficit”, RBI
(January 2019)
*Monetary Policy Report, October 2017
**Oil on boil: It’s time we understand oilnomics better, SBI Ecowrap, Issue No. 12, FY19 dated 21 May 2018
@https://www.livemint.com/Politics/QpeXAepvLtLg9DO3z76y2M/Higher-crude-oil-prices-will-worsen-fiscal-balance-Nomura-r.html
Economy Watch: July 2020 | 12Home
A recent analysis by the RBI 12 (January 2019) assesses the quantitative impact of a crude price shock on India’s
three major macro-stability indicators namely, current account deficit (CAD), inflation and fiscal deficit. The
study finds that every US$ 10/barrel increase in crude price increases the CAD relative to GDP by 43 basis
points.
A rise in global crude prices increases the domestic price of crude products and consequently domestic inflation.
This impact of crude on CPI comes from the direct as well as the indirect channels. The direct channel is where
crude products themselves appear as constituents in the CPI. In the short run, a change in prices of crude
products affects the CPI directly due to their weighted contribution in the index. The CPI categories which
contain crude products as constituents are: (1) transport (petrol and diesel), (2) fuel and light (fuel others) and
(3) fuel and light (kerosene, LPG). Together these three categories have a weight of 4.4% in the overall CPI
index. The indirect effect occurs as the retail prices of all other commodities manufactured using crude as an
input increase due to a crude price shock. The net impact of the crude price increase on inflation is given by the
sum of direct and indirect effects.
A given change in international crude price does not lead to an equal percentage change in pump prices, that is,
the price paid by the final consumers. Therefore, it is important to differentiate between the static and dynamic
components of pump prices. Some components of pump prices do not change with change in prices charged by
oil marketing companies (OMCs) and are static over time (e.g., dealer’s commission). After correcting for these
static components, the study found that the pass-through of international crude prices into pump prices is only
around 66%, if OMCs pass the whole of international price increase on to the final consumers. The study
reported results for both 100% and 66% pass-through as shown in Table 6.
Table 6: direct and indirect impact of crude prices (in bps)
CPI Initial price=US$55/barrel Initial Price=US$65/barrel
weight Direct Indirect Total Direct Indirect Total
Pass-through assumption of pump price to international crude= 66% (controlling for cess)
CPl (transport) 2.4 28 30 58 24 26 49
CPI (transport + others) 2.5 30 30 60 26 26 51
CPI (trans. + others + LPG + Kerosene) 4.4 52 30 82 44 26 70
Pass-through assumption of pump price to international crude= 100% (ignoring cess)
CPl (transport) 2.4 43 46 89 36 39 75
CPl (transport + others) 2.5 46 46 92 39 39 78
CPI (trans. + others + LPG + Kerosene) 4.4 79 46 125 67 39 106
Source: Mint street memo no. 17, “The impact of crude price shock on India’s current account deficit, inflation, and fiscal deficit”, RBI
(January 2019)
Note: Kerosene and LPG are currently subsidized and may not see full pass-through of international prices.
The impact of an increase in crude prices on fiscal deficit depends on several factors that include: (a) pass-
through of international prices to pump prices, (b) excise and custom duty and (c) petroleum subsidy by the
central government. The study finds that an increase of US$10/bbl. in global crude prices would increase the
fiscal deficit by 43 basis points as a percentage of GDP, if the government decides to absorb the entire oil price
shock rather than passing it to the end users. In this case, there would be no impact of the higher global crude
prices on domestic inflation.
Although global crude oil prices have fallen in recent months to levels much below those in the corresponding
period of last year (Chart 6), the retail selling prices of petrol and diesel are significantly higher. While average
global crude prices fell from US$59.8/bbl in June 2019 to US$39.5/bbl in June 2020, the average retail selling
price of petrol in Delhi increased from INR70.4/ltr to INR76.1/ltr over the same period. Already the overall CPI-
based inflation has crossed 6% in June 2020 breaching the upper tolerance limit as per the monetary policy
framework. Specifically, CPI inflation in transportation and communication services was at 7.1% in June 2020.
Petrol and diesel used for transportation constitute 27.2% of the group of transportation and communication
services. These provide a cost-push factor to the overall CPI inflation rate.
Comparing incidence of VAT and excise duty on PoL products
In this section, we compare the incidence of state level VAT on PoL products vis-à-vis center’s excise duty which
includes the basic excise duty, AED, and SAED. We trace their relative position over time and for this purpose we
have taken the tax components as applicable in Delhi and Mumbai for illustrative purposes. Charts 11 and 12
12
https://m.rbi.org.in/Scripts/MSM_Mintstreetmemos17.aspx#:~:text=Since%20a%20USD%2010%2Fbarrel,percentage%20of%20total%20CPI)%2012.
Economy Watch: July 2020 | 13Home
provide the relevant comparative profiles for petrol and diesel respectively for Delhi and Mumbai. In these
charts, three variables are represented namely: (a) price of Indian crude basket (INR/Ltr.), (b) percentage share
of excise duty in retail selling price and (c) percentage share of VAT in retail selling price.
Chart 11: trend in share of excise duty and VAT in retail selling price of diesel and petrol in Delhi
50.0 50.0
45.0 45.0
40.0 40.0
35.0 35.0
30.0 30.0
25.0 25.0
20.0 20.0
15.0 15.0
10.0 10.0
5.0 5.0
0.0 0.0
Jun-15
Oct-15
Jun-16
Oct-16
Jun-17
Oct-17
Jun-18
Oct-18
Jun-19
Oct-19
Jun-20
Feb-16
Feb-17
Feb-18
Feb-19
Feb-20
Jun-15
Oct-15
Jun-16
Oct-16
Jun-17
Oct-17
Jun-18
Oct-18
Jun-19
Oct-19
Jun-20
Feb-16
Feb-17
Feb-18
Feb-19
Feb-20
Indian Crude Basket (INR/Ltr) Indian Crude Basket (INR/Ltr)
Share of excise duty in RSP of diesel (%) Share of excise duty in RSP of petrol (%)
Share of VAT in RSP of diesel (%) Share of VAT in RSP of petrol (%)
Source (basic data): PPAC, CBIC, RBI
Note: Indian crude basket (INR/Ltr.) has been estimated by using the magnitude on Indian crude basket (US$/bbl.) from PPAC and the
average monthly exchange rate (INR per US$) from RBI.
The time profiles for petrol and diesel are broadly comparable. There are clear differences between the relative
positions of center and states as reflected in the case of Delhi and Mumbai. This is due to differences in the VAT
rates that were applicable in Delhi vis-à-vis Mumbai. It is noticeable that while the percentage share of state VAT
remained relatively static throughout the respective periods under consideration, the percentage share of
center’s excise duty had remained variable. In the case of Delhi, with respect to diesel, there were two peaks for
center’s share of excise duty. One occurred in March 2016 and the latter occurred in May 2020. In both cases,
the Indian crude basket price was at a significantly low level reflecting weak global crude prices. This indicates
that the center has been inclined to take advantage of lower global crude prices by increasing its excise duty
rates. It is only in the more recent periods that a state/UT like Delhi also uplifted its VAT rate for diesel. They did
not increase the VAT rate on petrol by as much. States are sensitive to retail prices of PoL products prevailing in
their respective neighboring states. Individually, they may be constrained to raise VAT rates on PoL products. To
have greater flexibility in this regard, they need to come on a common platform to consider their responses to
center’s frequent changes in the excise rates on PoL products.
Chart 12: trend in share of excise duty and VAT in retail selling price of diesel and petrol in Mumbai
60.0 50.0
50.0 40.0
40.0
30.0
30.0
20.0
20.0
10.0 10.0
0.0 0.0
Jun-17
Sep-17
Mar-18
Jun-18
Sep-18
Mar-19
Jun-19
Sep-19
Mar-20
Jun-20
Dec-17
Dec-18
Dec-19
Jun-17
Sep-17
Mar-18
Jun-18
Sep-18
Mar-19
Jun-19
Sep-19
Mar-20
Jun-20
Dec-17
Dec-18
Dec-19
Indian Crude Basket (INR/Ltr) Indian Crude Basket (INR/Ltr)
Share of excise duty in RSP of diesel (%) Share of excise duty in RSP of petrol (%)
Share of VAT in RSP of diesel (%) Share of VAT in RSP of petrol (%)
Source (basic data): PPAC, CBIC
Economy Watch: July 2020 | 14Home
In the case of Mumbai, the patterns are somewhat different. With respect to diesel, both the center and the state
started with relatively high shares of taxes on diesel when the price of Indian crude basket was relatively low.
Both of them brought the tax incidence down as the crude basket price increased. The share of center’s excise
duty was higher than that of the state VAT largely throughout the period except for a range of months during
September 2018 to November 2018 when they were roughly equal. But the share of excise duty leaped up in
recent months whereas there was a much milder increase in the state VAT. This recent pattern is roughly the
same for petrol.
Taxes on PoL products: an international comparison
Table 7 provides a cross country comparison indicating the relative share of petroleum taxes in the retail selling
price of petrol and diesel for selected countries. These data pertain to the month of June 2020. In June 2020,
India was the fifth highest in terms of share of petroleum taxes compared to some major economies of the world.
According to our estimate, the share of petroleum taxes in India in the case of petrol and diesel accounted for
66.4% and 65.8% respectively in June 2020. These rates indicate the average share for the month in Delhi which
is taken as representative of the Indian situation.
Table 7: cross country comparison of price and tax in Indian rupees rupee per litre
Country Petrol Diesel
Retail Ex-tax Taxes % of taxes Retail Ex-tax Taxes % of taxes
selling price in RSP selling price in RSP
price price
UK 101.1 29.2 71.9 71.1% 106.8 34.0 72.7 68.1%
Italy 117.8 34.4 83.3 70.7% 108.2 36.1 72.1 66.7%
France 111.5 34.0 77.5 69.5% 102.8 33.8 69.1 67.2%
Germany 107.9 34.9 73.1 67.7% 92.5 37.7 54.8 59.3%
India* 76.1 25.6 50.5 66.4% 74.9 25.6 49.3 65.8%
Spain 95.4 38.5 56.9 59.6% 87.0 39.6 47.4 54.5%
Japan 91.4 44.8 46.6 51.0% 77.8 49.2 28.6 36.8%
Canada 57.5 33.8 23.8 41.3% 52.9 32.3 20.6 39.0%
USA 41.6 32.0 9.6 23.1% 48.2 37.0 11.2 23.3%
Source: PPAC, IEA (https://www.iea.org/reports/monthly-oil-price-statistics)
Notes
1. Prices in US$ per litre for the month of June 2020 for France, Germany, Italy, Spain, UK, Japan, Canada & USA are sourced from
IEA Monthly Oil Price Statistics (released July 2020).
2. Average exchange rate of INR75.73/ US$ (June 2020) has been used to convert the retail selling prices in US$ to INR.
3. VAT is excluded from prices for automotive diesel for France, Italy, Spain and UK as it is refunded to industry.
4. * Prices in India are based on retail selling (RSP) in Delhi.
Conclusion
In the context of the ongoing pandemic, one development that has favored India relates to the low level of global
crude prices. The expectation was that this would benefit the users of PoL products particularly in the industry
and transport sectors and the consumers. This expectation has so far been belied as the available space between
the input price of crude and the retail price of PoL products has been used up by the central and state
governments by hiking up the tax rates on PoL products under their respective control. Instead of retail prices
coming down as the crude price came down, these have gone up to significantly high levels. The main reason for
these trends pertains to the highly constrained fiscal space of both the central and the state governments at a
time precisely when they need to provide strong fiscal stimuli to cope with the pandemic’s economic fallout.
Since retail prices of PoL products have a potential inflationary impact through transport and energy costs, this
matter needs to be carefully monitored as the fiscal year progresses.
Economy Watch: July 2020 | 15Home
6. Money and finance: credit growth fell to 6.2% in May 2020
A. Monetary sector
Monetary policy
► In its monetary policy review held on 22 May 2020, the RBI reduced the repo rate by 40 basis points to a
historic low level of 4.0%. So far, the RBI has been proactive in responding to the COVID-19 induced
economic crisis by introducing a slew of measures including: (a) reduction in repo and reverse repo rates, (b)
lowering the CRR, (c) infusing additional liquidity through TLTROs and special refinance windows and (d)
easing regulatory norms. As assessed by the government, the magnitude of stimulus through various RBI
measures until mid-May 2020 amounted to INR 8,01,603 crores.
► CPI inflation in June 2020 crossed the upper tolerance level of 6% of the monetary policy framework. This
may be a cause of concern for the RBI in its upcoming monetary policy review, scheduled between 4th and
6th August 2020.
Chart 13: movements in repo rate and 10-year government bond yield
3.0 8.5
In May 2020, growth in bank
5.86 7.5
2.0 credit fell to 6.2% from 6.8%
6.5 in April 2020 led by a fall in
1.0 5.5 the growth of personal loans
4.004.5 and continued low growth in
0.0 3.5 credit to industries.
Oct-19
Feb-20
Jun-20
Oct-17
Oct-18
Feb-18
Jun-18
Feb-19
Jun-19
Oct-15
Oct-16
Feb-17
Jun-17
Jun-15
Feb-16
Jun-16
spread (% points, LHS)
Repo rate (%, RHS)
10-year government bond yield (%, RHS)
Source: Database on Indian Economy, RBI
Money stock
► Growth in broad money stock (M3) increased to 12.3% in June 2020, its highest level since November 2014.
This was largely on account of a strong growth in narrow money, a key component of M3. Growth in time
deposits stood at 10.7% in June 2020, similar to the level in May 2020.
► Growth in narrow money (M1) increased to 17.6% in June 2020 from 15.3% in May 2020. M1 growth was led
by higher growth in currency in circulation, which increased to 20.6% in June 2020, its highest level since
November 2018. Growth in demand deposits also improved to 12.1% in June 2020 from 9.8% in May 2020.
Aggregate credit and deposits Chart 14: growth in credit and deposits
► Growth in credit by scheduled commercial 24
banks fell to 6.2% in May 2020 from 6.8% 20
in April 2020 (Chart 14). With the 16 10.6
contraction in economic activities due to 12
the nationwide lockdown since end-March 8
2020, credit growth continued to remain 4
subdued averaging 6.5% during April and 0
6.2
May 2020.
Nov-13
Nov-14
Nov-15
Nov-16
Nov-17
Nov-18
Nov-19
May-13
May-14
May-15
May-16
May-17
May-18
May-19
May-20
► Growth in non-food credit was lower at
6.8% in May 2020 as compared to 7.3% in
April 2020 due to a fall in the growth of Aggregate deposits (% ann) Bank credit (% ann)
personal loans and credit to agricultural Source: Database on Indian Economy, RBI
sector.
► Growth in personal loans fell to a 10-year low of 10.6% in May 2020 from 12.1% in April 2020.
Economy Watch: July 2020 | 16Home
► Credit to industry, accounting for about 32% of non-food credit, grew by 1.7% in May 2020, similar to level in
April 2020. Within the industrial sector, growth in credit to infrastructure, iron and steel, and chemicals
remained low at 1.3%, 0.9% and 3.6% respectively in May 2020.
► Credit to services sector grew by 11.2% in May 2020, similar to the level in April 2020 while growth in credit
to agriculture moderated to 3.5% in May 2020 from 3.9% in April 2020.
► Growth in aggregate bank deposits improved to 10.6% in May 2020 from 9.9% in April 2020 led by higher
growth in both time and demand deposits during the month.
B. Financial sector
Interest rates
► Interest rates offered by commercial banks on term deposits with a maturity of more than one year fell for
the third consecutive month to average 5.40% (ranging between 5.10% to 5.70%) in June 2020 from the
average of 5.72% (ranging between 5.50% and 5.94%) in May 2020.
► The yield on 10-year government bond fell marginally to average 5.86% in June 2020 as compared to 5.92%
in May 2020. For a 250 basis points cumulated reduction in repo rate during February 2019 and June 2020,
the benchmark bond yield fell by cumulated 149 basis points during the same period, indicating a
transmission rate of close to 60%.
► The MCLR fell by 15 basis points to average 7.11% in June 2020 as compared to 7.26% in May 2020.
► WALR on fresh rupee loans by scheduled commercial banks was marginally higher at 8.54% in May 2020 as
compared to 8.52% (revised) in April 2020.
FDI and FPI
► As per the provisional data released by the RBI on 13 July 2020, the overall foreign investment (FIIs) inflows
(net FDIs plus net FPIs) were lower at US$1.4 billion in May 2020 as compared to US$2.5 billion (revised) in
April 2020.
Chart 15: net FDI and FPI inflows (US$ billion)
10
2.0
5
0
-5 -0.7 Net FDI inflows were
-10 lower at US$2.0 billion
in May 2020 as
-15
compared to US$2.4
-20 billion in April 2020.
Jul-18
Jul-19
Sep-18
Nov-18
Sep-19
Nov-19
May-18
May-19
May-20
Jan-19
Jan-20
Mar-19
Mar-20
Net FPI Net FDI
Source: Database on Indian Economy, RBI
► Net FDI inflows were at US$2.0 billion in May 2020, lower than US$2.4 billion (revised) in April 2020 (Chart
15). Gross FDI inflows slowed to US$3.6 billion in May 2020 from US$4.5 billion (revised) in April 2020.
► Net portfolio investment (FPIs) turned negative reflecting outflows of US$0.7 billion in May 2020 as
compared to inflow of US$0.1 billion (revised) in April 2020.
Economy Watch: July 2020 | 17Home
7. Trade and CAB: contraction in merchandise exports eased to
(-)12.4% in June 2020
A. CAB: Current account posted a surplus in 4QFY20 after 51 quarters
► CAB recorded a marginal surplus of 0.1% of GDP in 4QFY20 as compared to a deficit of (-)0.4% in 3QFY20
(Chart 16) aided by a lower merchandise trade deficit and higher net invisible receipts (Table 8).
Merchandise imports relative to GDP fell to a 63-quarter low of 15.2% in 4QFY20. Merchandise exports
relative to GDP fell to a 67-quarter low of 10.4% in 4QFY20. Net invisible receipts improved to a 17-quarter
high of 4.8% of GDP. On an annual basis, current account deficit fell to a three-year low of (-)0.9% of GDP.
Table 8: components of CAB in US$ billion Chart 16: CAB
CAB as % of CAB Goods Invisibles* 5 0.6 0.5
nominal GDP account net net 0 0.0
-5 0.1 -0.5
FY17 -0.7 -15.3 -112.4 97.1 -10 -1.0
FY18 -1.8 -48.7 -160.0 111.3 -15 -1.5
-20 -2.0
FY19 -2.1 -57.3 -180.3 123.0
-25 -2.5
FY20 -0.9 -24.7 -157.5 132.8 -30 -3.0
2QFY18
3QFY18
4QFY18
1QFY19
2QFY19
3QFY19
4QFY19
1QFY20
2QFY20
3QFY20
4QFY20
1QFY20 -2.1 -15.0 -46.8 31.8
2QFY20 -1.1 -7.6 -39.6 32.1
3QFY20 -0.4 -2.6 -36.0 33.4
CAB (US$ billion, LHS) CAB (% of GDP, RHS)
4QFY20 0.1 0.6 -35.0 35.6 Source: Database on Indian Economy, RBI
Source: Database on Indian Economy, RBI
Note: (-) deficit; (+) surplus; *invisibles include services, current transfers and
income components
B. Merchandise trade and exchange rate
Merchandise exports and imports contracted by (-)12.4% and (-)47.6% respectively in June 2020
reflecting a sustained demand slowdown (Chart 17).
► Contraction in merchandise exports eased to a four-month low of (-)12.4% in June 2020 from (-)36.5% in
May 2020 led by slower pace of contraction in exports of petroleum products (oil) and engineering goods.
Chart 17: developments in merchandise trade ► The pace of contraction in exports of engineering
32 goods slowed to (-)7.5% in June 2020 from (-
16 )24.2% in May 2020 and that in oil exports to (-
0.8
0 )31.6% from (-)68.5% over the same period.
-16 -12.4
► Contraction in imports remained high at
-32
-47.6 (-)47.6% in June 2020 as compared to (-)51.0% in
-48 May 2020.
-64
► Contraction in oil imports was high at (-)55.3% in
Mar-19
Apr-19
Jul-19
Mar-20
Apr-20
Oct-18
Jun-19
Jun-20
Nov-18
Dec-18
Feb-19
Aug-19
Sep-19
Oct-19
Feb-20
Jan-19
May-19
Nov-19
Dec-19
Jan-20
May-20
June 2020 as compared to (-)72.0% in May 2020
reflecting subdued domestic demand and lower oil
Trade balance (US$ billion) Exports (% ann)
prices.
Imports (% ann)
Source: Ministry of Commerce and Industry, GoI ► Iron and steel imports contracted by (-)56.1% in
June 2020 as compared to (-)19.1% in May 2020.
► Contraction in imports excluding oil, gold and jewelry rose to (-)38.9% in June 2020 from (-)31.0% in May
2020. Over the same period, contraction in exports of this category eased to (-)3.5% from (-)23.6%.
► Out of the 30 sectors for which exports and imports data is provided, 18 and 26 sectors respectively
experienced a contraction in June 2020 as compared to 26 and 28 sectors respectively in May 2020.
► A merchandise trade surplus was observed for the first time in more than 18 years at US$0.8 billion in June
2020 as compared to a deficit of US$3.1 billion in May 2020.
► The rupee exchange rate remained constant at a low level of INR75.7 per US$ (average) in June 2020, the
same level as observed in May 2020 partly due to sustained foreign exchange demand by the RBI.
Economy Watch: July 2020 | 18You can also read