Ecosystem Services Supporting Livelihoods in Cambodia - Stockholm Environment Institute, Project Report 2010
←
→
Page content transcription
If your browser does not render page correctly, please read the page content below
Stockholm Environment Institute, Project Report - 2010

                                                    Ecosystem Services Supporting
                                                         Livelihoods in Cambodia

                                                      Linn Persson, Nang Phirun, Chanrith Ngin,
                                                     John Pilgrim, Chanthy Sam and Stacey Noel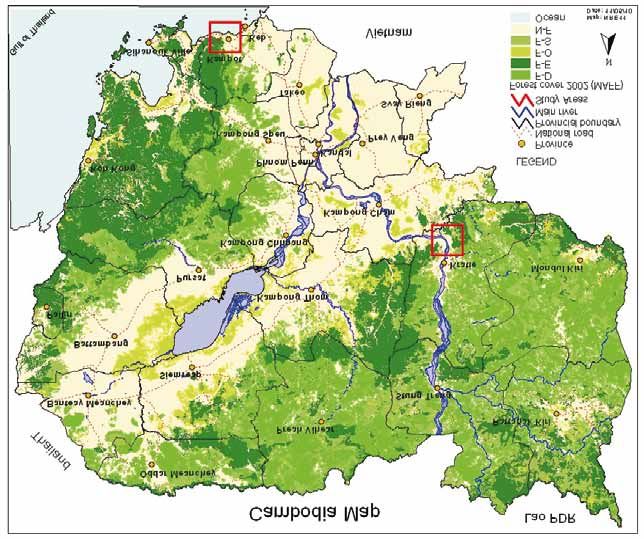
Ecosystem Services Supporting
Livelihoods in Cambodia

Linn Persson1, Nang Phirun2, Chanrith Ngin3, John Pilgrim3,
Chanthy Sam1 and Stacey Noel1

 1 Stockholm Environment Institute
 2 Cambodian Development Resource Institute
 3 Royal University of Phnom Penh
Stockholm Environment Institute
Kräftriket 2B
SE 106 91 Stockholm
Sweden

Tel: +46 8 674 7070
Fax: +46 8 674 7020
Web: www.sei-international.org

Head of Communications: Robert Watt
Publications Manager: Erik Willis
Layout: Richard Clay

Cover Photo: Rice planting, Cambodia © GilesT1/flickr

This publication may be reproduced in whole or in part and in any
form for educational or non-profit purposes, without special per-
mission from the copyright holder(s) provided acknowledgement
of the source is made. No use of this publication may be made for
resale or other commercial purpose, without the written permission
of the copyright holder(s).

The study presented in this report has been funded in part by the
Swedish International Development Cooperation Agency (Sida).
However, Sida was not involved in the design of the study and
does not necessarily support the views expressed in the report.

Copyright © December 2010 by Stockholm Environment Institute
Contents
Acknowledgements                                                              iv

Introduction                                                                   1

From ecosystem functions to human well-being                                   2

Research methodology                                                           3
    Measuring the contribution of local ecosystem services to livelihoods      3
    Household interviews and Focus Group Discussions                           4

LIvelihood situation in the villages in the study                              6
    Kampong Tnaot village, Kampot province                                     6
    Kanhchor village, Kratie province                                          6
    Kralanh, Andoung Trach and Kampong Preah villages, Battambang Province     6
    Por and Tram Khla villages, Kampong Thom province                          7

Ecosystem services and livelihoods                                             8
    High direct dependence on local ecosystem services across income groups    8
    Links between poverty level and source of income                           9
    Fishing – threats to stocks and limitations to access                      9
    High dependence on diminishing forest resources                           11
    Loss of wild foods such as snails, frogs, eels and crabs                  12
    Changes in ecosystem services availability over time                      12

Discussion and conclusions                                                    14

References                                                                    17

Annex: The bean count tool                                                    19
Acknowledgements This report is the result of a joint research project between Stockholm Environment Institute (SEI), the Cambodian Development Resource Institute (CDRI) and the Royal University of Phnom Penh (RUPP) with funding from the Swedish International Development Cooperation Agency (Sida). The report is based on field studies with household interviews and Focus Group Discussions carried out by CDRI and RUPP during 2009 in villages in the Cambodian provinces Kampot, Kratie, Battambang and Kampong Thom. The authors are grateful for the constructive comments on the draft report by Dr Göran Nilsson Axberg, SEI and Ms Muanpong Juntopas, SEI. Bangkok and Phnom Penh, December 2010 iv
s to c k h o l m e n v i r o n m e n t i n s t i t u t e

Introduction

T   he global community committed itself to fighting
    poverty and hunger at the Millennium Summit
in 2000 when the Millennium Development Goals
                                                          The realization of the CMDGs as well as the
                                                          global MDGs will require renewed efforts from all
                                                          stakeholders. But it will also in a fundamental way
(MDGs) were agreed upon. These are 8 goals with           depend on how we manage the natural resource base
specific targets aiming for instance at halving world     of the planet. The natural resource base supplies the
poverty by the year 2015. The last update on progress     ecosystem services that enable food production and
made towards the MDGs is a grim reading. Much of          contribute to human well-being. The purpose of this
the advances that had been made up to 2005 were lost      case study is to contribute to improved understanding
in the economic downturn during 2008-2009. Low or         on the link between ecosystem services and the
negative economic growth, fewer trade opportunities,      reduction of hunger and poverty as set out in the
reduced flows of development cooperation funds,           CMDGs. The study is primarily based on field research
higher food prices, as well as impacts of climate         carried out during 2009 at the village and household
change have contributed to an extra 55-90 million         level in Cambodia. The study focuses on household
more people living in extreme poverty compared to         level dependence on local ecosystem services and how
before the crises (UN 2009). Towards the end of 2010,     these connect with livelihoods and poverty patterns.
global hunger was again reported to be declining,
although still not at a rate that would make us meet      The questions addressed in the study include:
the hunger reduction targets (FAO 2010). Adding to the
challenge, the resource base upon which we rely for       ●● Are there any communities or wealth groups that
food and livelihood is being seriously degraded and the      are especially dependent on certain ecosystem
vital supply of ecosystem services is being threatened       services for their livelihood?
(MA 2005).
                                                          ●● What are the characteristics of this dependency?
In Cambodia, 35 per cent of the population currently         Can certain risks/vulnerabilities due to threats to
live under the national poverty line, with the poorest       these ecosystem services be identified?
parts of the population being found in the rural areas.
The improvements reached in living conditions over        ●● Can improved availability of certain ecosystem
the recent years have mostly benefited the urban areas       services constitute a road out of poverty for the
(RGC 2005).                                                  poorest households? How could that in this case
                                                             be facilitated?
In 2003, the Royal Government of Cambodia produced
its first localized MDG report. The Cambodia MDG
2003 report (RGC 2003) set out targets for 2005, 2010
and 2015. The Government translated the MDGs into
national goals – the Cambodia MDGs (CMDGs) and
also added a ninth goal on “de-mining, unexploded
ordinance and victim assistance”.

                                                                                                                                1
ecosystem services supporting livelihoods in cambodia
From ecosystem functions to human well-being
H umans rely on the natural resource base for mere
survival as well as for higher degrees of well-
being. One way of illustrating this dependence is with
Between the different ecosystem services of importance
for local livelihoods there are both synergies and
trade-offs (Steffan-Dewenter et al. 2007; Bennett
the concept of ecosystem services. When the results 2009; Raudsepp-Hearne 2010). Some of these are
of the large efforts in the Millennium Ecosystem well-known; other linkages are still to be explored.
Assessments (MA) were made available in 2005, The human dependence on ecosystem services is
this showed for the first time in a comprehensive thus generally acknowledged but the nature of that
way that human dependence on the services provided dependence is not fully understood in its complexity.
by ecosystems has never been under a more severe Furthermore, the policy options available to protect and
threat. The MA concluded that the last 50 years have sustain these services are not always easily identified.
meant an unprecedented change of ecosystems due There is thus a need for support to policy makers on
to pressure of the human demands. It also stated that how to ensure sustained ecosystem functions for
“this has resulted in a substantial and irreversible loss livelihoods under increasing human pressure.
in the diversity of life on Earth”. Approximately 60 per
cent of the ecosystem services examined in the MA are
being degraded or used unsustainably. Looking ahead, Box 1: Environmental protection in the
this degradation constitutes a barrier to achieving Constitution of Cambodia
the MDGs (MA 2005). The changing climate adds
to the challenge and the regions of the world which Protection and conservation of ecosystems is pri-
today stand furthest away from reaching the MDGs oritised by the Royal Government of Cambodia
are also the regions at greatest risks in terms of loss as stated in the constitution: “The state shall pro-
of ecosystem services and impacts of climate change. tect the environment and balance of abundant
If the vulnerability of ecosystems to the impacts natural resources and establish a precise plan of
of climate change is not reduced, the likelihood of management of land, water, air, wind geology,
attaining the MDGs will be smaller (Galaz 2008). ecologic systems, mines, energy, petrol and gas,
gems, forests and forest products, wild life, fish
and aquatic resources” (article 59 of the Consti-
While some of the interactions between ecosystems,
tution) (CDRI 2010).
their services and human well-being are well known,
other aspects are poorly known and difficult to monitor,
limiting the options for policymakers to act. In a study
led by the World Resources Institute, the connections
between ecosystems and human wellbeing in Kenya
were illustrated in an atlas (WRI 2007). This thorough
study of the spatial distribution of poverty and of supply
of ecosystem services shows that there are no simple
links between the two. There are few overlaps between
the indicators studied of ecosystem services and those
for poverty and livelihoods. The authors interpret this
limited overlap as a sign of the complex relation and
influence of other factors not captured in the study.
But they also refer to the many inherent limitations
in the monitoring techniques and the knowledge gaps
concerning both ecosystem services and poverty and
livelihoods.
2s to c k h o l m e n v i r o n m e n t i n s t i t u t e
Research methodology
T his study is based on household interviews
and Focus Group Discussions (FGDs) in
seven villages in Cambodia. The household and
map of these services was created to help guide the
interviews and the FGDs. The interviewees and Focus
Groups were asked to describe their use of and estimate
FGD questionnaires were designed to capture the relative importance of each of the ecosystem
the household dependence on local ecosystem services to their livelihoods.
services and to link the dependence on these
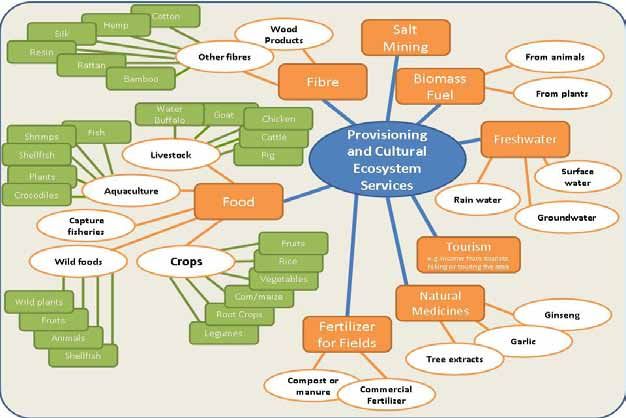
services to the livelihood options and poverty The categories of ecosystem services used in the
level of the household. The interviews and FGDs fieldwork for this study are listed below (the categories
were carried out by the staff and students of the are based on the Millennium Ecosystem Assessment):
Royal University of Phnom Penh (RUPP) and the
Cambodia Development Research Institute (CDRI), Provisioning and cultural services (resources that
and students in forestry from the Royal University are consumed or sold)
of Agriculture. This section describes the approach
taken to ecosystem services. It also outlines the other ●● Food
parts of the methodology for the study and lists the
interviews and Focus Group Discussions carried out. Wild foods - edible plant and animal species
Further details of the methodology used for the data gathered or captured in the wild; harvested
collection can be found in separate field data reports wild foods from fisheries and forests for food
from the project (CDRI 2010; RUPP 2010). and income, examples include insects, birds,
monkeys, mushrooms, bamboo shoots, etc.;
also those wild foods collected for animal/
Measuring the contribution of local livestock fodder
ecosystem services to livelihoods
Crops – cultivated plants or agricultural
The definitions and categories of ecosystem services products harvested by people for human or
defined by the Millennium Ecosystem Assessment animal consumption; examples are rice, maize,
(MA 2005) are used for the study, the focus being on vegetables, fruits, root crops like cassava and
the provisioning and cultural ecosystem services. A sweet potatoes, legumes, etc.
Table 1: Villages included in the study
Number of Number of
District or Main livelihood
Village Province households in households
commune activity
the village interviewed
Kanhchor * Chhloung Kratie Forestry 363a 40
Coastal fishing and
Kampong Tnaot* Kampot Kampot 267a 40
salt-farming
Kampong
Kralanh** Battambang Lowland agriculture 68 28
Preah
Kampong
Andoung Trach** Battambang Lowland agriculture 232 38
Preah
Kampong Kampong
Battambang Lowland agriculture 340 38
Preah** Preah
Kampong Inland fishery and
Tram Khla** Tbaeng 186 26
Thom floating rice farming
Kampong Inland fishery and
Por** Tbaeng 201 22
Thom floating rice farming
* CDRI
** RUPP
a The total number of households was taken from FitzGerald (2007).
3ecosystem services supporting livelihoods in cambodia
Livestock – animals raised for domestic or energy; examples are fuel wood and materials
commercial use; included are those raised within used for charcoal production
the house premises and pastured; examples are
pig, cattle, water buffalo, horse, chicken, duck, ●● Natural medicines – plants collected for
goat, etc. treatment of disease; examples are ginseng,
garlic, tree extracts for pest control
Capture fisheries – wild fish captured through
trawling or other non-farming methods ●● Freshwater – groundwater, rainwater and
surface water for household, industrial and
Aquaculture – fish, shellfish, and/or plants agricultural uses; including the sources,
that are bred and reared in ponds, enclosures, purposes and quantities; water consumed
and other forms of freshwater or saltwater domestically for drinking, cooking, laundry and
confinement for purposes of harvesting, bathing; water used in the fields (farming e.g.
crocodiles irrigation), home gardening, livestock raising,
aquaculture, crop processing, fish and aqua
●● Fibre and timber product processing, etc.
Timber and other wood products derived from ●● Fertilizer for fields – examples are compost or
tree, cultivated or wild; those used as housing/ manure, commercial fertilizer
construction materials, fish gear making, also
timber/logs collected for business ●● Salt farming (NaCl) – in coastal areas
Other fibres – non-wood and non-fuel fibres; ●● Tourism (cultural ecosystem service) –
examples are cotton, hemp, silk, resin, rattan, recreational pleasure people derive from natural
bamboo and kapok (not included are materials or cultivated ecosystems (in this context we are
used as fuel/energy – these are reported under interested in tourism as an income generating
“biomass fuel”) service, the question in the interview is thus if
the interviewee is benefiting from income from
●● Biomass fuel – biological material from both tourists activities e.g. bird-watching or hiking in
animals and plants that serves as a source of the area.)
Table 2: Focus Group Discussions and Key Informant Interviews
Number of
Village Commune/district Province Date Partipants
participants
April
Tram Khla Tbaeng Kampong Thom 6 Villagers
2009
April
Tram Khla Tbaeng Kampong Thom n.a. Commune chief
2009
April
Tram Khla Tbaeng Kampong Thom n.a. Village chief
2009
Nov
Kralanh Kampong Preah Battambang 15 Villagers
2008
Kampong March Villagers, community
Kampot Kampot 12
Tnaot 2009 leaders, local authorities
March Villagers, community
Kanhchor Chhloung Kratie 24
2009 leaders, local authorities
4s to c k h o l m e n v i r o n m e n t i n s t i t u t e
Figure 1: Villages and districts included in the study
Studies looking at the use of the natural resource bas Household interviews and Focus
often use the term Common Pool Resources (CPR) for Group Discussions
the resources shared by a community. This study looks
primarily at the local ecosystem services supporting A selection of villages was made to capture different
livelihoods, which is partly but not entirely the same types of livelihood activities as outlined in Table 1.
resources as the CPR1. The local ecosystem services Some of the villages were also earlier included in the
include crop production as well as the supporting Moving Out of Poverty Studies of CDRI (FitzGerald
and regulating ecosystem services that are necessary 2007) which gives an extensive set of general data to
both for maintained agricultural production and for lean on in the analysis of the results. The interviews
continued CPR supply. and FGDs were carried out between November 2008
and April 2009.
In Andoung Trach, Kampong Preah, Kralanh and Tram
1 The CPR are often part of the local ecosystem Khla a “bean count tool” was used in the FGDs and
services. However, the local ecosystem services interviews for quantification of the resources derived
supporting a village are greater than the CPR and from the surrounding environment. The bean count
include farming, fishing and collection of forest tool is further described in the Annex.
products on private land as well as regulating and
supporting services such as the provision of soil
fertility and flood regulation.
5ecosystem services supporting livelihoods in cambodia
LIvelihood situation in the villages in the study
T he socioeconomic reality differs substantially
between the villages included in the study. Some
of the villages were as mentioned earlier part of the
Kanhchor village, Kratie province
Kanhchor village in the Kratie province has a
long term Moving Out of Poverty Study (MOPS) population of 1107 people and relies mainly on
carried out by CDRI in 2001 and 2004/5 (FitzGerald forest based logging and CPR, with relatively small
2007). For these villages there are more data on the agricultural production compared to other villages
development over time in village and household in the commune. However, households grow both
income and consumption as well as mobility wet and dry season rice with relatively good yields
patterns concerning households moving in and out (around 2.5 tons per hectare per crop season).
of poverty. In this section the villages are presented 25 per cent of the population are estimated to be
with a description of the poverty situation as well landless. Many people generate high incomes from
as a general overview of the livelihoods currently forest timber and fibre. Villagers also fish and raise
sustaining each village. livestock. Wild fish stocks have been reported to be
substantially declining over the last ten years due
to illegal fishing (FitzGerald 2007). Rice and crop
Kampong Tnaot village, Kampot cultivation also contributes to the village income
province (CDRI 2010).
Kampong Tnaot on the coast in the Kampot FitzGerald and So (2007) reported that Kanhchor
province has a total population of 2150 people village had experienced a moderate increase in
(FitzGerald 2007). The coast location makes fishing consumption and strong income growth between
and collection of marine animals and products the 2001 and 2004/5. However, in 2005 the future
main income for most of the population. Illegal prospects for the village were deemed to be less
fishing activities are reported to have increased. bright. The village is not very accessible and has
This together with increasing fishing pressure from little arable land. Most households were reported to
growing coastal communities is reported to have be prevented from using forest resources by illegal
resulted in declining fish stocks and many people interests (FitzGerald 2007). However, today the
turning to other livelihood activities. Salt farming situation seems to be somewhat more positive, partly
is an important source of income, particularly for due to improvement of the agricultural techniques
women. Wet season rice is grown between July and and new possibilities of wage labour (Mr So
January but in general with low yields (0.9 ton per Sovannarith, personal communication, November
hectare). 40 per cent of the villagers also grow cash 2010).
crops (FitzGerald 2007).
Earlier research showed that Kampong Tnaot and Kralanh, Andoung Trach and
two other fishing villages were the only villages Kampong Preah villages, Battambang
in the MOPS which had experienced falling Province
consumption and increased poverty in the 2004/5
survey compared to 2001. The outlook for the village The villages Kralanh, Andoung Trach and
given in 2005 was that appropriately managed, Kampong Preah are situated in the Kampong Preah
raising livestock could become a supplementary commune. In this commune wild capture fishery
source of income. The village location between and rice production (seasonally flooded floating
the towns Kampot and Kep could also benefit the rice and receding rice2) are the two main sources
village if the tourism potential of the area is used of income and food for all sections of society.
and well managed (including the Ream National 80-90 per cent of the protein intake was seen to come
Park) (FitzGerald 2007). Currently, it seems that the
poverty rate is in fact decreasing, but there are no
detailed data available (Mr So Sovannarith, personal 2 When the Tonle sap is flooded, some rice varie-
communication, November 2010). ties are planted in the deep flooded areas, this rice
is called floating rice. When the water is receding,
rice is planted in the shallow water left behind,
this rice is called receding rice.
6s to c k h o l m e n v i r o n m e n t i n s t i t u t e
from wild capture fish, either from own capture Por and Tram Khla villages,
or from purchase from others. 5-10 per cent of the Kampong Thom province
population generates income through collection
of resin, rattan, reed or palm thatch. The farming Most of the inhabitants of Por and Tram Khla villages
systems are still traditional to some extent, but with are growing rice for their livelihood. There are flood-
growing influence of other practices, such as the fed rice fields and also dry season rice cultivation
use of small tractors and pesticides and commercial in tractor ploughed, rented land. The village head
fertilizers. People increasingly rely on migration of of Tram Khla estimated that about 50 per cent of
household members to industries and services trade the households harvest enough rice for their own
in Phnom Penh or to Thailand for agricultural wage consumption; the rest start to buy in June most years.
labour. The reduced availability of common pool Some also cultivate water melon. 15 of the village
resources such as fisheries and forests were given household include full time fishermen and live by
as the main cause of people having to migrate for the lake about 25 km from the village. Most of the
income. This study again confirmed that the poorest surrounding forest has been cleared to grow rice,
households were the most dependent on the common reducing the supply of timber and non-timber forest
pool resources such as snails, crabs, eels, frogs, toads products (RUPP 2010). Both villages have been
and other resources from the rice paddies and canals, experiencing population increase, diminishing land
deriving 60-70 percent of the food supply from such sizes and rapidly improved transportation and ease
sources (RUPP 2010). of access. This has led to a substantial proportion
of the households having members who migrate for
Andoung Trach was included in the MOPS and work, mainly to Phnom Penh to the garment and
was by 2004/5 in the group of strongly performing construction industries and to service trades.
villages. However, the trend in wellbeing was in
2005 judged to be a slowdown (FitzGerald 2007).
7ecosystem services supporting livelihoods in cambodia
Ecosystem services and livelihoods
I n this section the local ecosystem services of
importance for livelihoods in the studied villages are
discussed. More detailed data is available in the field
source of income for the households interviewed in
Kampong Tnaot and Kanhchor. Figure 3 reports the
secondary source of income for the same households.
reports of CDRI and RUPP (CDRI 2010; RUPP 2010). The distinct livelihood pattern in the two villages with
fishing and farming, respectively, as the main income
source is clearly showing.
High direct dependence on local
ecosystem services across income The income sources not directly depending on the local
groups ecosystem services include small trade and migration
of household members to cities or abroad for work in
The collected data suggest that the overall direct factories or construction sites. These income sources
dependence on local ecosystem services for livelihoods can be of vital importance for individual households,
is very high across income groups. In the villages but the overall livelihood situation in the villages
Kanhchor, Kampong Tnaot, Kralanh, Andoung Trach, depend on a continued supply of local ecosystem
Por and Kampong Preah 85-90 per cent of the primary services such as crops and fisheries (figure 4).
source of income of the households is based on local
ecosystem services and dependent on the continued The high overall dependence on the local ecosystem
supply of these services (crops, capture fisheries, services shows the vulnerability of the population to
wild food, forest timber and biomass). For Tram Khla disturbances in the ecosystem functions. It highlights the
the figure is not completely comparable because the importance of safeguarding against further reductions
category “wage labour” used in the data collection in the supply of these services, either directly through
there includes both local agricultural wage labour for instance land-use changes, or indirectly through
(here counted as income from local ecosystems) and a reduction of supporting ecosystem services such as
other types of wage labour. Figure 2 shows the primary pollination and pest and flood regulation.
Figure 2: Households’ primary sources of income (as per cent of households) (CDRI 2010)
Figure 3: Households’ secondary sources of income (as per cent of households) (CDRI 2010)
8s to c k h o l m e n v i r o n m e n t i n s t i t u t e
Figure 4: 85-90 per cent of the primary source of income is directly derived from local
ecosystem services in the villages in the study.
Links between poverty level and ecosystem services such as biomass, crops and capture
source of income fisheries. Of the better off households, none reported
to be collecting wild foods in the two villages (CDRI
Earlier studies (WB 2006; FitzGerald 2007) concluded 2010). However, in general all income groups depended
that the poorest tend to be the most reliant on the CPR, on the local ecosystem services for their livelihoods
and that the CPR dependent villages are the worst off with only minor differences between the poor and the
in terms of wealth (FitzGerald 2007). In this study the medium income group of households (figure 5).
high dependence of the poorest on the CPR was partly
confirmed. However, in some villages, there seem to Earlier studies found that one factor that well-off
be high dependence on common pool resources across households and villages have in common is the
income groups, like in Tram Khla where 20 per cent opportunity to diversify income sources. Being able
of the income source for all households across to do this signifies an insurance against shock and
income levels is identified as derived from common changes also in supply of ecosystem services. In Tram
pool resources (RUPP 2010). In general, the CPR Khla, better off households also seem to have a greater
dependence is often caused by the lack of other income level of income from their own produce (agriculture
opportunities, such as lack of own farm land or lack of on their own land or fishing with their own equipment)
education allowing other income options. In Kampong (RUPP 2010). The findings from Kampong Tnaot and
Tnaot and Kanhchor villagers were asked both in 2004 Kanhchor indicate that the high income households
and in 2008 to estimate the importance of common earn more mainly due to having more plots of land and
pool resources for their livelihood. The results showed that they grow high value cash crops (CDRI 2010).
that both poor and better off households had increased
their dependence on such resources in this time interval Thus, the study confirmed that there was a continued
(CDRI 2010). connection between poverty and higher relative
dependence on the CPR. However, the dependence
In one FGD it was also put forward that the poorest on local ecosystem services was high across income
are at the same time not only the most reliant, but also groups. It also seems that the resources available in the
the ones with the least influence over the management common pool are not sufficient to constitute a road out
of the common pool resources, leaving them in a of poverty.
highly vulnerable situation. For instance participants
mentioned that the Farmer Water User Communities
were created to improve the influence of the Fishing – threats to stocks and
communities on their resource management. However, limitations to access
this may have been the case for some villagers, but not
for all since this type of community organisation is not For the households in this study, as well as for
always accessible for the poorest people (RUPP 2010). Cambodia in general, fish are an important component
of the diet. Wild fish capture in the Tonle Sap provides
For the total dependence on local ecosystem services up to 70 per cent of the protein in the country’s diet
the connection between the level of dependence on (Bonheur and Lane 2002). The capture fisheries
the services and the level of income is less clear. For consist of commercial fisheries using large motorised
instance in Kampong Tnaot and Kanhchor, villagers boats and nets in the open lake, and fish traps in the
in all income groupings were dependent on local flooded forest and lake shore. It also includes family
9ecosystem services supporting livelihoods in cambodia
Figure 5: Use of local ecosystem services as per cent of the households of different income
groups (CDRI, 2010)
fishing for food and for sale. Furthermore, the coast Phreah and Tbaeng communes, 60-70 per cent of the
line offers opportunities for marine fishing. Figure 6 households reported fishing activities in 2008. Out of
shows examples of the types of products captured in these, a significant share was fishing in the flooded
the fisheries in one inland village (Kanhchor) and one forest and only a smaller portion (12 per cent) reported
on the coast (Kampong Tnaot). Fishing in the rice fishing in the river/canal. In Tbaeng 60 per cent also
fields is important in the Tonle Sap area (Hortle 2008). were fishing in ponds and in both areas 50 per cent
of the fishing households also used the rice fields for
In Kampong Tnaot village, 60 per cent of the households catches. Furthermore, the majority of the households
identified marine fishing as their main income. They reported diminished catches when comparing 2008 to
also noted that the marine resources had declined due to the year before, and also referred to fewer large size
illegal fishing methods (CDRI 2010). In the Kampong fish being caught. Also the fish captures in the river/
Figure 6: Percentage distribution of households collecting capture fisheries products, by type.
Kampong Tnaot is a coastal village and Kanhchor is an inland village (Data from CDRI,
2010).
10s to c k h o l m e n v i r o n m e n t i n s t i t u t e
canal have been reduced according to the fishing Box 2: Said at the Focus group discussion in
households. The main reason given in Kampong Pres Tram Khla
was increased pressure from more people fishing, in
Tbaeng this reason was combined with illegal fishing “In the past, there were plenty of fish in this vil-
as a cause of decline in the resource (RUPP 2010). lage. Now we can catch only a kilo of fish per
Participants at one of the FGD in Tram Khla village day”.
stated that they believe that fish will be more abundant
in the future since their village and many surrounding
villages now have a community fishery that will help
to make sure that regulations such as prohibited use of In interviews and FGDs, forest resources were
electric fishing gear are enforced (RUPP 2010). reported to be seriously reduced. This is in line with
national statistics. In 2003, Cambodia set the target
Thus, fishing constituted an important contribution to (2005-2015) of not reducing the forest cover below
livelihoods in most villages in the study, and for some, 60 per cent of the total land area (CMDG 2003);
the most important. This was true across wealth groups. however, already in 2006, the forest cover was reported
In interviews and FGDs, there were many references to have reached 59 per cent (TWGFE 2007). Some of
being made to captures going down from year to year. this deforestation has taken place in the northwest. Up
Fish stocks are not easily monitored and the status of to 2000, this area was a major forest but since then it
fish stocks in Cambodia is not known in detail (Hortle has been deforested for the development of cash crop
2004; IPS 2008). Reduced catches can be caused by plantations under Thai and Cambodian companies.
diminishing stocks, but also by more people fishing the The smaller forested upland southwest of Battambang
same stocks. However, from a livelihood perspective, is undergoing a similar development. When forest
the important aspect is the catch per fisherman and the clearance is ongoing, the clearance and sale of timber
time and resources he has to spend to catch each kilo and firewood may constitute an important income
of fish. The clear message from the studied villages is source for many landless people.
that the important fish catches were going down, and
that some people even chose to leave fishing to search In the remaining forests there is sometimes
for other livelihood options because of the decline in uncontrolled firewood collection even in protected
the resource. areas. Sometimes illicit rents and fines to forestry
staff are paid to gain access for resource collection in
For some villages, access to fishing waters may be these areas. A focus group discussion in Ta Ngen in
another important restriction. Illicit rents imposed Takhream Commune, Battambang Province reported
by government officials and police on the fishing that forestry officers ask for payment when wood is
community have been reported (RUPP 2010). This collected in the forest, but also from villagers that
has taken the form of illegal fees being collected by collect wood from their own rice fields or land (RUPP
soldiers under the threat of confiscating the fishing 2010).
gear of the fishermen if they don’t pay, or illegal fees
to access fishing waters (Pilgrim 2009b). The community forestry organisations have been
reported to serve their purpose well for forests where
there is no hard wood or substantial bamboo left. In
High dependence on diminishing these settings the villagers can manage the remaining
forest resources forest resources such as fuel wood, mushrooms and
other wild food through their organisation, but when
Forest resources were used by households in all the there is hard wood or substantial bamboo available it
villages in the study. In the forest village Kanhchor, seems more difficult for community organisations to
5 per cent of the villagers get their primary income from prevent outside commercial exploitation, and thus to
collecting forest products and 25 per cent identified manage and control the resources (RUPP 2010).
these resources as their second most important source
of income. The products collected are mainly timber, It was also reported by the interviewees that their
bamboo and rattan, but also edible plants and leaves access to forest resources has been greatly reduced
for household consumption and to a certain extent for since forest concession awards were issued by the
sale (figure 7). In the villages of Kampong Tnaot, less government. The villagers are no longer entitled
households reported using forest resources, but also to collect forest products in the forest areas owned
here some forest products were collected, notably as or leased by the forest land concession companies
fuel wood or as timber to be used in construction. (CDRI 2010).
11ecosystem services supporting livelihoods in cambodia
Figure 7: Percentage distribution of households collecting forest timber and fibre (CDRI, 2010)
Thus, again there is a local ecosystem service, forest Box 3: Said at the Focus group discussion in
resources collected for different purposes, that has Tram Kla
high general importance to the livelihood situation
in the studied villages, and that is experiencing a “In the past we just cut and collected [firewood]
decline in availability. The deforestation rate is by ourselves. But now the field owners clear for-
higher than the target set as part of the CMDGs. ests for farm land so we have to buy the already
Again, there is also an issue of access rights to the cut down trees”
remaining forested areas where villagers now have
to pay, legal or illegal fees to collect resources that
were earlier part of the CPR and free of charge.
The FGDs in Tonle Sap reported a diminished
supply of these catches, which used to be major
Loss of wild foods such as snails, sources of protein supply for the households. The
frogs, eels and crabs FGD participants identified the use of pesticides
as a reason for the decline. In Kralanh village,
Many households in the studied villages collected Battambang province, the FGD with the poorest
wild foods for sale or household consumption villagers reported that it has become difficult to
such as snails, frogs, eels, crabs and fish in rice sell the rice field crabs because people say they are
paddies, canals and forest. In some villages the polluted (RUPP 2010). This study has not collected
collection constituted a substantial contribution to data to verify pesticide pollution, but from the
the livelihood situation. 30 of the 40 interviewed general situation of pesticide use in Cambodia (box
households in Kampong Tnaot village responded 5) and from literature (for a review, see SEI 2010) it
that they collect hard shelled species (crabs, snails, can be noted that it is not unlikely that the reduced
lobsters etc). The income generated by the sale of supply of this ecosystem service depends on pesticide
these products was reported to be substantial. In use for certain species. It is also possible that the
Kanhchor people primarily gathered edible plants food collected in fields where pesticides are used is
and roots food from the rice field and chamkar3 or contaminated above concentrations considered to be
other non-forest areas which did not significantly safe for human consumption (SEI 2010).
contribute to household incomes.
In both Kanhchor and Kampong Tnaot it was Changes in ecosystem services
common to collect edible plants and leaves as availability over time
well as wild fruits, birds and amphibians for own
consumption or sale in the local market. Several ecosystem services that contribute to the
household income in the provinces of Kratie,
Kampot, Battambang and Kampong Thom (such as
fish, wild foods, timber, forest fibre and biomass fuel)
have gradually decreased over the period 1999-2008.
3 Chamkar is the Khmer word for land where other The villagers interviewed explained this decline by
crops then rice are cultivated. the increase in population, the cutting of forests for
12s to c k h o l m e n v i r o n m e n t i n s t i t u t e
Figure 8: Percentage distribution of households gathering wild foods, by type of wild foods
(CDRI 2010)
Box 4: Village Chief in Tram Khla reported to be more uneven than before and the
insect pests on the crops to have increased (CDRI
“There were plenty of wild animals here after the 2010).
war. I also went into the forest to catch them. We
caught tortoises, snakes, pythons etc. But now In Kampong Tnaot where 60 per cent of the
they are very scarce”. households gave marine fishing as their main
income, it was also noted that the marine resources
have declined due to the use of illegal fishing
methods. As a result of lower catches some people
plantations and agriculture, the banning of access to choose to go further from shore, thus taking higher
forestry resources and the lack of monitoring and risks. Other have chosen to change from fishing to
enforcement of regulations. Villagers also referred to other income sources (CDRI 2010). Interviewees in
the river becoming shallower and with more growth Kampong Tnaot and Kanhchor reported decreased
of algae at the surface, which they believe may livestock production due to diseases (CDRI 2010).
be consequences of dam construction in the upper
Mekong. They also reported that the dry season has The combined effects of these changes have severe
become longer than the rainy season and that it has impacts on the livelihood options available at the
been hotter over the last years. The rainfall is also village level across income groups.
Box 5: Pesticide use in Cambodia
Pesticide imports to Cambodia have increased every year since 1980 (EFJ 2002). A survey in 2000 found
241 different pesticides for sale in the local markets, compared to 30 and 63 different products in 1994
and 1998, respectively. The 2000 survey also noted that 33 per cent of the products found in the survey
belong to WHO category 1, the most hazardous pesticides, and as such they are forbidden in Cambodia.
Apart from using pesticides in the fields, farmers are also reported to use pesticides for fishing and in the
fish processing (Saing Koma 2000). The traders of pesticides do normally not have any training on pesticide
risk reduction and can therefore not help with instructions to the farmers. Most of the pesticide products are
imported from Thailand and Vietnam, and therefore the labels are in Vietnamese or Thai, which means that
not even literate farmers can access that information.
In a survey carried out in 2008-2009, all 300 interviewed farmers in 10 villages in Battambang and
Prey Veng reported that they use pesticides; many of them also noted worries about the effects on the sur-
rounding wildlife and their own health. Still, many farmers apply pesticides on a calendar basis without first
checking for signs of insect infestations or the presence of natural enemies of the pest organisms. They also
lack the appropriate knowledge about pesticide handling in order to avoid direct health risks to themselves
and their families (Sokha 2009).
13ecosystem services supporting livelihoods in cambodia
Discussion and conclusions
T he field data from this study showed a high
overall dependence across income groups on local
ecosystem services for food and livelihoods at the
While ultimately all ecosystem services are of
importance to everybody for survival and well-being,
certain services, or lack thereof, will be more directly
household level. 85-90 per cent of the primary income affecting some groups or communities. The 2005
of the households was identified as directly obtained update on the CMDGs states that “reduced access to
through local ecosystem services. Common Property Resources may well have adversely
affected other efforts aimed at poverty reduction”
Among these services, rice production was the (RGC 2005). This study confirmed the connection
dominant livelihood source in most villages. Fishing between poverty and higher relative dependence on the
was also found to constitute an important contribution CPR. This was also earlier reported by the 2007 study
to livelihoods across wealth groups in most villages, and of Fitzgerald and So on Cambodian poverty. They
for some, the most important. At the same time, the clear concluded that it was the more isolated communities
message from the studied villages was that the important relying most heavily on CPR that had experienced
fish catches were going down, and that some people the slowest growth and had more households
even chose to leave fishing to search for other livelihood moving downwards into deeper poverty than other
options because of the decline in the resource. communities. The villages that were doing best were
those, primarily agricultural, villages that were more
The national and local management of the fish resources accessible. The actual income from CPR fell in all
will have to balance the interest of many users and the studied villages, but the proportion of income from
long-term sustainability of the fish stocks in order to CPR rose slightly in one of the villages, Kampong
ensure continued contribution from fish to livelihoods. Tnaot (FitzGerald 2007). It can thus be noted that the
Impacts of infrastructure investments and changes in resources available in the common pool do not seem
agricultural systems such as the introduction of dry rice to be sufficient to constitute a road out of poverty for
perimeters4 will also have to be better monitored and the poorest part of the population. However, the CPR
controlled. There are otherwise risks that the ecosystem still constitute an important safety net for the poorest
service of fish supply will not be able to carry the same households when other income sources fail.
weight in supporting livelihoods in Cambodia in the
future. This will in turn have severe impacts for the food Furthermore, the information in interviews and FGDs
security of the poorest, but also affect large numbers of give various examples of trade-offs between different
median and better off households in the studied villages. ecosystem services. For instance, an increase in outtake
of crop production around Tonle Sap affects the fishing
Forest resources collected for different purposes had because of loss of vulnerable flooded forests and wetlands
high general importance to the livelihood situation in to agriculture and to increased leakage of agrochemicals
the studied villages, and there were many interviewees into the lake (ADB 2006). The raised levels of nutrients
who witnessed to a decline in availability of these may cause increased problems of weed infestations in
resources. The current deforestation rate is higher than the lake of for example water hyacinth. The agricultural
the target set as part of the CMDGs. Many households expansion is also affecting the flooded forest which
in the studied villages also collected wild foods for sale reduces the productivity of fishing and the supply of wild
or household consumption such as snails, frogs, eels, foods. Dam construction for irrigation and for energy
crabs and fish in rice paddies, canals and forests. In threatens the water flow through the Tonle Sap system
some villages the collection of wild food constituted a (Neiland 2008). Upcountry logging affects the water
substantial contribution to the livelihood situation. The quality of the lake. The urban population may in the short
FGDs reported a diminished supply of these catches, term benefit from infrastructure development and large
which used to be major sources of protein supply for scale fishing and agricultural activities at the expense
some households. For both the forests and wild food, of small scale family fishing and farming (Bonheur and
there was thus a general decline in the resource reported, Lane 2002). Different groups thus have different interest
but also issues raised regarding access rights to the in the fishing resource giving rise to conflicts over the
remaining resources. management of the fishing access rights (Degen 2000).
The construction of dry rice perimeters in the Tonle Sap
area leads to reduced grassland and grazing areas as
4 Dry rice perimeters are enclosures constructed to keep well as reduced access to fishing waters (Diepart 2007;
irrigation water in place for rice production. Pilgrim 2009a).
14s to c k h o l m e n v i r o n m e n t i n s t i t u t e
In Cambodia, as in many countries, there is a lack of reports of diminished fish catches per boat and of
data on the current state of the ecosystems and their collapsed fish stocks of some species in Tonle Sap lake,
ability to supply vital services to the communities. but that there was not enough data to substantiate these
The 2005 update on the CMDGs notes this lack of reports (MoE 1998).
data. The update describes that in order to reach Goal
7 on ensuring environmental sustainability there are It can thus be concluded that improved management
still many challenges remaining such as the rate of of ecosystems and ecosystem services is vital for the
deforestation and the degradation of water resources livelihoods in the studied villages and a prerequisite
(RGC 2005). The Cambodia National Environmental for improved human well-being in rural Cambodia.
Action Plan from 1998 also highlighted forest Other measures will most likely also be needed in
resources as a major concern. Of the eight forest types order to reduce poverty in line with the CMDGs. These
in Cambodia several are threatened, including the measures may include improved access to health care
mangroves along the coast and the inundated forest and education as well as vocational training, market
around Tonle Sap. It was further noted that there are access and facilitation of labour migration.
Box 6: Summary of conclusions
Are there any communities or wealth groups that are especially dependent on certain ecosystem services
for their livelihood?
• 85-90 per cent of the primary income of the households was identified as directly obtained through lo-
cal ecosystem services such as crop production, fisheries and forest resources.
• The study confirmed the continued connection between poverty and higher relative dependence on the
CPR.
• However, the dependence on local ecosystem services was high across all income groups.
What are the characteristics of this dependency? Certain risks/vulnerabilities due to threats to these eco-
system services?
• Fishing constituted an important contribution to livelihoods in many villages in the study. At the same
time, fish catches were reported to be going down.
• Forest resources collected for different purposes had high general importance to the livelihood situa-
tion in the studied villages, and there were many interviewees witnessing a decline in availability of and
access to these resources.
• Many households in the studied villages collected wild foods for sale or household consumption such as
snails, frogs, eels, crabs and fish in rice paddies, canals and forest. In some villages the collection con-
stituted a substantial contribution to the livelihood situation, but catches were reported to be declining.
• For fisheries, forests and wild food collection, there were issues both about a general decline in the
resource and about access rights to the remaining resources.
Can improved availability of certain ecosystem services constitute a road out of poverty for the poorest
households? How could that in this case be facilitated?
• Improved management of ecosystems and ecosystem services is vital for the livelihoods across income
groups in the studied villages and a prerequisite for improved human well-being in rural Cambodia.
• The resources available in the common pool are not sufficient to constitute a road out of poverty and
the villages and households with the highest CPR dependence are among the poorest.
• Ensuring continued supply of local ecosystem services is a necessary but not sufficient requirement for
poverty reduction in rural Cambodia.
• Appropriate management of the ecosystems has to be complemented by other efforts such as agricul-
tural development and improved possibilities for wage labour through for example increased market
access and vocational training.
15ecosystem services supporting livelihoods in cambodia Box 7: Policy recommendations • Ensure adequate protection of the ecosystem services on which the rural livelihoods are based, i.e. soil fertility, water resources, and protected habitats for wild food and pollinating species. • Ensure access of the poorest and landless to local ecosystem services that are part of the commons, for instance by eradicating illicit rents for collection of fuel wood or small scale fishing activities. • Provide additional income possibilities for the poorest and landless through vocational and secondary schooling and support for internal and international labour migration. • Ensure that the interests of the poorest people are taken into account in the community based organi- sations for fisheries and forestries. • Ensure access to land, forests and fisheries of the poorest. • Increase the efforts by the authorities to hinder illegal fishing, forest clearance and land encroach- ments. • Expand the agricultural extension services and the training of farmers in pesticide risk reduction and Integrated Pest Management (IPM) for poverty reduction and maintained livelihoods. Box 8: Future research needs • How can the remaining ecosystem services for livelihoods be monitored, protected and better man- aged? • Are new institutions needed or can adequate ecosystem service management be achieved within the existing institutional framework? • How can the ecosystem services, including the regulating and supporting services be monitored in order to ensure improved management and deliberate choices regarding trade-offs? 16
s to c k h o l m e n v i r o n m e n t i n s t i t u t e

References

ADB (2006) Cambodia: Tonle Sap Environmental             Hortle, K. G., Lieng, S., Valbo-Jorgensen, J. (2004)
  Management (Tonle Sap Community Fisheries                 An introduction to Cambodia’s inland fisheries.
  Baseline Assessment: Status report 2005) ADB              Mekong Development Series no 4. Mekong River
  Consultant’s report, project number 33418.                Commission, Phnom Penh, Cambodia.

Bennett, E. M., Peterson, Garry D. and Gordon, Line      Hortle, K. G., Troeung, R., Lieng, S. (2008) Yield
   J. (2009) “Understanding relationships among             and value of the wild fishery of the rice fields
   multiple ecosystem services.” Ecology Letters 12:        in Battambang province, near Tonle Sap Lake,
   1394-1404.                                               Cambodia. MRC Technical paper no 18. Mekong
                                                            River Commission.
Bonheur, N. and Lane, B. D. (2002) “Natural
   resources management for human security in            IPS (2008) Inter Press Service: Cambodia, dwindling
   Cambodia’s Tonle Sap Biosphere Reserve.”                 fish stocks threaten food security by Andrew
   Environmental Science & Policy 5(1): 33-41.              Nette, April 17th 2008. http://ipsnews.net/news.
                                                            asp?idnews=42020.
CDRI (2010) Sustainable Pathways for Attaining
  the Millennium Development Goals - Cambodia            MA (2005) The Millennium Ecosystem Assessment:
  Case Study. Natural Resources and Environment            Ecosystems and human wellbeing, synthesis.
  Programme of the Cambodia Development                    Washington, D.C., Island press: www.
  Reserach Institute (CDRI).                               millenniumassessment.org.

CMDG (2003) Cambodia Millennium Development              MoE (1998) Cambodia National Environmental Action
  Goals Report 2003. Royal Government of                   Plan 1998-2002, Ministry of Environment, Royal
  Cambodia.                                                Government of Cambodia.

Degen, P., Van Acker, F., van Zalinge, N., Thuok, N.,    Neiland, A. E., Béné, C. (eds) (2008) Tropical river
   Vuthy, L. (2000) Taken for granted - conflicts over      fisheries valuation: background papers to a global
   Cambodia’s freshwater fish resources. 8th IASCP          synthesis. The World Fish Center Studies and
   conference, Bloomington, Indiana, June 2000.             Reviews 1836. The World Fish Center, Penang,
                                                            Malaysia.
Diepart, J. C. (2007) Recent land dynamics in the
   Tonle Sap floodplain and its impacts on local         Pilgrim, J. (2009a) Preliminary review of research
   communities. Tonle Sap Biosphere Reserve                  on the environmental factors in migration in
   Bulletin, vol 3, June 2007.                               Cambodia. Draft working paper no 2. Royal
                                                             University of Phnom Penh, IDRC, Cambodia.
EFJ (2002) Death in small does - Cambodia’s pesticide
   problems and solutions. Environmental Justice         Pilgrim, J. (2009b) Research project on migration,
   Foundation.                                               rural poverty and community natural resource
                                                             management. Working paper no 6. Royal
FAO (2010) The state of food insecurity in the world:        University of Phnom Penh - International
  Addressing food insecurity in protracted crises.           Development Research Centre.
  Rome, Italy, FAO.
                                                         Raudsepp-Hearne, C., Peterson, G., Bennett, E. (2010)
FitzGerald, I., So, S. (2007) Moving Out of Poverty?        ”Ecosystem service bundles for analyzing tradeoffs
    Trends in Community Well-being and Household            in diverse landscapes.” PNAS pnas.0907284107.
    Mobility in Nine Cambodian Villages. CDRI,
    Phnom Penh.                                          RGC (2003) Cambodia Millennium Development
                                                           Goals Report, Royal Government of Cambodia.
Galaz, V., Moberg, F., Downing, T.E., Thomalla, F.,
   Warner, K. (2008) Ecosystems under pressure. A        RGC (2005) Achieving the Cambodia Millennium
   policy brief for the International Commission on        Development Goals, 2005 update, Royal
   Climate and Development.                                Government of Cambodia.

                                                                                                                            17
ecosystem services supporting livelihoods in cambodia
RUPP (2010) Ecosystem Services Dependence, Rural TWGFE (2007) Paper prepared by the Technical
Poverty and Population Movement in Battambang Working Group on Forestry and Environment
and Kampong Thom Provinces on the Tonle Sap (TWGFE) for the Cambodia Development
Lake. Royal University of Phnom Penh. Cooperation Forum, 19-20 June 2007: Forest cover
changes in Cambodia 2002-2006.
Saing Koma, Y., Makarady, K., Seng Horng, L. (2000)
Pesticide market in Cambodia. Centre d’Etude and UN (2009) The Millennium Development Goals
Developement Agricole Cambodien (CEDAC). Report 2009. New York, United Nations.
SEI (2010) Persson, L., Arvidson, A., Lannerstad, M., WB (2006) Cambodia - halving poverty by 2015?
Lindskog, H., Morrissey, T., Nilsson, L., Noel, S., Poverty Assessment 2006. Prepared by the World
Senyagwa, J. Impacts of pollution on ecosystem Bank for the Consultative Group Meeting.
services for the Millennium Development Goals.
SEI Project Report, Stockholm Environment WRI (2007) Nature’s benefits in Kenya, an Atlas
Institute, Sweden. of ecosystems and human well-being. World
Resources Institute, Ministry of Environment and
Sokha, P. (2009) Pesticide Risk Reduction in Natural Resources of Kenya, Central Bureau of
Cambodia: An assessment of findings from statistics and Ministry of planning and National
research on pesticide use, baseline survey in Development in Kenya, and the International
Battambang and Prey Veng. R. U. o. Agriculture. Livestock Research Institute. Washington DC and
Phnom Penh. Nairobi, World Resources Institute.
Steffan-Dewenter, I., M. Kessler, et al. (2007)
“Tradeoffs between income, biodiversity, and
ecosystem functioning during tropical rainforest
conversion and agroforestry intensification.”
Proceedings of the National Academy of Sciences
of the United States of America 104(12): 4973-
4978.
18You can also read


