Review Article Effect of higher pre-operation body mass index on overall survival of esophageal, gastric and pancreatic cancer: a systematic ...
←
→
Page content transcription
If your browser does not render page correctly, please read the page content below
Int J Clin Exp Med 2018;11(1):12-22
www.ijcem.com /ISSN:1940-5901/IJCEM0060476

Review Article
Effect of higher pre-operation body mass index on
overall survival of esophageal, gastric and pancreatic
cancer: a systematic review and meta-analysis
Yangyang Liu1, Meiyan Zhang2

Departments of 1Oncology, 2Nursing, People’s Hospital of Xintai City, Affiliated to Taishan Medical University, Xintai
271200, Shandong, China
Received April 29, 2017; Accepted December 12, 2017; Epub January 15, 2018; Published January 30, 2018

Abstract: Although high body mass index (BMI) has been identified as a risk factor for several common cancers, the
important question of whether pre-operation BMI influences the overall survival (OS) of digestive system cancers
(DSCs) has not been explicated thoroughly. Therefore, we performed a meta-analysis to investigate whether pre-
operation BMI was associated with esophageal cancer (EC), gastric cancer (GC), and pancreatic cancer (PC) prog-
nosis. Fifteen relevant studies involving a total of 8,984 cancer cases (4,502 EC, 3,004 GC, and 1,478 PC cases)
were finally included in this study. Hazard ratios (HRs) with 95% confidence intervals (95% CIs) for OS in different
BMI categories from individual studies were extracted, and pooled by random-effect model. The overall HR of EC,
GC, and PC for OS of higher pre-operation BMI was 0.83 (95% CI = 0.68-0.98), 0.68 (95% CI = 0.25-1.11), and
0.85 (95% CI = 0.65-1.05), respectively. Combined cases of EC, GC, and PC with higher pre-operation BMI were at
decreased risk for OS (HR = 0.81, 95% CI = 0.69-0.93). Increased pre-operation BMI was also related to lower risk of
death from EC with 1.03% percent for every 5-unit BMI increment. Our meta-analysis indicated increased OS among
EC survivors with higher pre-operation BMI, but not in GC and PC. Higher BMI before operation may be an important
prognostic factor that indicate an increased survival from EC.

Keywords: Body mass index, pre-operation, esophageal cancer, overall survival

Introduction                                                   [5, 6]. For one thing, some studies suggested
                                                               that significant association was found between
In 2016, 304,930 new digestive system cancer                   pre-operation BMI and overall mortality of EC,
(DSC) cases, including esophageal cancer (EC),                 GC, and PC [7-9]. For another, some research
gastric cancer (GC) and pancreatic cancer (PC),                revealed that higher pre-operation BMI was not
are expected with 153,030 estimated deaths                     associated with overall survival (OS) from above
in the United States every year [1]. Colorectal                cancers [10-12]. Additionally, most results were
cancer, hepatic cancer, gastric cancer, pancre-                not statistically significant. In 2013, Zhang et al
atic cancer and esophageal cancer are most                     also revealed that high BMI could significantly
dangerous and account for high morbidity and                   improve OS of EC, and associated with postop-
mortality rate [2]. Overweight is defined by the               erative complications [13]. Recently, Shi et al
World Health Organization as body mass index                   have made a meta-analysis and showed that
(BMI) of 25.0 to 29.9 kg/m2, and obesity is                    obesity in adulthood shortened OS of pancre-
defined as BMI ≥ 30.0 kg/m2. It has been esti-                 atic cancer patients [9]. Furthermore, cancer
mated by various authorities that one-third of                 survivors need recommendations on lifestyle
cancers in Western high-income societies are                   factors, and pre-operation BMI is an important
attributable to factors relating to weight gain                research question to enhance the survival and
and obesity. Keeping normal BMI was recom-                     life quality of particular patients. We performed
mended by the World Cancer Research Fund                       a meta-analysis of published articles to expli-
for cancer patients [3, 4]. Nevertheless, incon-               cate the relationship between higher pre-opera-
sistent results have been reported by studies                  tion BMI and survival among EC, GC, and PC
on the relationship between pre-operation BMI                  patients. Moreover, we summarized the evi-
and mortality among EC, GC, and PC survivors                   dence on pre-operation BMI, and analyzed
Body mass index and esophageal cancer

                                                                                 carefully browsed to find other
                                                                                 studies that met the criteria. If
                                                                                 different articles reported the
                                                                                 same study, we only included
                                                                                 the publication with the larg-
                                                                                 est size.

                                                                                 Quality assessment

                                                                                   Two authors independently
                                                                                   drew up the evaluation pro-
                                                                                   gram and assessed full texts
                                                                                   included. The Newcastle Otta-
                                                                                   wa scale (NOS), which was
                                                                                   recommended by the Coch-
                                                                                   rane Non-Randomized Stud-
                                                                                   ies Methods Working Group,
                                                                                   was used in this meta-analy-
Figure 1. Selecting the flowchart for the inclusion of   studies in the meta-      sis for quality assessment
analysis.
                                                                                   [14]. This quality evaluation
                                                                                   method assessed observa-
the highest versus the lowest category of                       tional studies in three dimensions with a total
higher pre-operation BMI and OS of all above                    score of 9 stars. Among the 9 stars, 4 stars rep-
cancers.                                                        resented for the appropriate selection of expo-
                                                                sure and non-exposure cohort participants, 2
Materials and methods                                           stars represented for the comparability of
                                                                cohort, and the last 3 stars described the
Literature retrieval                                            assessment of outcome and follow-up. Studies
                                                                that scored ≥ 7 were considered as adequately
PubMed, Embase, and the Cochrane Library                        conducted. A third person was involved to solve
were searched by two authors from the earliest                  the disagreement in the scores by consensus.
available date to March 20, 2017. The key-
words were as follows: esophageal, esophagus,                  Data extraction
gastric, stomach, pancreatic, pancreas, tumor,
cancer, neoplasm, mortality, survival, overall                 Extract data from eligible studies included: first
survival, BMI, body mass index, pre-operation                  author, year, region where the study conducted,
BMI, and BMI before operation. Boolean logic                   study type, study period, cancer type, histology,
words were jointly used to combine the key                     sample size, maximum and minimum BMI cat-
words. Two reviewers investigated potentially                  egories, both univariate HR (95% CI) and multi-
relevant articles seriously. The references of                 variate HR (95% CI) from each BMI category,
retrieved articles were also checked for further               and confounding factors. Three authors extract-
relevant studies. Disagreements were solved                    ed information independently, and disagree-
by group discussion.                                           ments resolved by consensus. If data above
                                                               had not been referred in original articles, items
Literature inclusion and exclusion criteria                    were deemed as “NA”. Engauge Digitizer ver-
                                                               sion 2.11 software was used to extract relevant
Search eligible studies by two authors indepen-                numerical value from survival curves and calcu-
dently and finally negotiate to reach consensus.               late the HR (95% CI) while only Kaplan-Meier
The criteria were as follows: (1) comparing OS                 survival curves were provided in the original
of EC, GC, and PC patients with different pre-                 texts [15].
operation BMI ranges, containing comparison
and referent BMI group. (2) presenting an asso-                Statistical analysis
ciation estimate with 95% CI or survival curve.
(3) only full texts written in English were includ-            This meta-analysis was performed to evaluated
ed. The full texts of all potentially eligible stud-           the reported OS of EC, GC, and PC with pre-
ies were retrieved, and their references were                  operation BMI categories. The highest and low-

13                                                                        Int J Clin Exp Med 2018;11(1):12-22
Body mass index and esophageal cancer
est pre-operation BMI group were compared to irrelevant articles, laboratory studies, dupli-
assess the survival difference of EC, GC, and cates and other unsuitable objects, remaining
PC. We performed analysis of pooled HR with 16 full texts were assessed for eligibility.
95% CI using a random-effect model in case Additional two records were retrieved from ref-
that there was significant heterogeneity. erence lists. Although providing survival curve,
Multivariate HRs with 95% CI were commonly some articles were excluded because we can-
adopted to estimate included studies. not extract or calculate HR and 95% CI. In total,
Univariate HRs were used instead if multivari- 15 articles were included in this meta-analysis
ate HRs were not available. Study-specific study according to the criteria (Figure 1). For studies
size and 95% CI was showed by forming forest included, we combined and evaluated three
plots [16]. For dose-response evaluation, mid- kinds of cancers: esophageal [5-7, 10, 19-23],
point of the maximum and minimum BMI group gastric [8, 11, 24], and pancreatic cancer [9,
was used to quantitatively calculate the OS 12, 25].
change. If the BMI category was open-ended,
midpoints was estimated using the width of the Study characteristics and quality assessment
adjacent close-ended category [17]. Subgroup
All studies referred the OS of cancer patients
analysis of highest versus lowest BMI category
and pre-operation BMI. All of the included arti-
and OS of EC patients included study type (ret-
cles were published between 2007-2016;
rospective or prospective study), geographic
Eligible studies contained 12 prospective stud-
area (North America or other regions), histology
ies and 3 retrospective studies. 7 studies were
(adenocarcinoma (AC) or AC and squamous cell
distributed in the North American, and the
carcinoma(SCC)), number of cases (< 500 or ≥
remaining 8 studies were from other regions.
500), and adjustment for covariates (yes or no).
The case number of 7 included studies was
We also performed sensitivity analysis to
more than 500 cases, and the remaining 8 had
assess whether the summary estimates are
less than 500 patients. The referent group
robust to inclusion of studies. One study was
from half studies was normal BMI category.
removed every time, and the rest were ana-
Most studies provided multivariate HR and
lyzed to evaluate whether the results could
95% CI. Multivariate results were adjusted by
have been affected significantly by a single
age, gender, race, smoking, diabetes, tumor
study. A pooled HR > 1 revealed that the high-
stage, lymph node metastasis, treatment and
est BMI group had worse prognosis than the
other covariates. According to the qualitative
lowest group for DSC patients. Oppositely, a
assessment criteria, all studies that scored ≥ 7
pooled HR < 1 suggested the highest BMI
were considered as adequately conducted
group suggested a more favorable survival. (Table 1).
When the 95% CI of HR did not overlap 1, the
result was regarded as statistically significant. Higher pre-operation BMI improves OS of EC
Heterogeneity was assessed by Q and I2 statis-
tics. An I2 value < 25% indicates a low level of Association of pre-operation BMI with OS of EC
heterogeneity, while values of 25%-50% and ≥ was presented in 9 studies (eight prospective
50% represent moderate and high levels of het- and one retrospective) (Figure 2). The pooled
erogeneity, respectively [18]. Publication bias HR for higher pre-operation BMI of EC patients
was evaluated by Begg funnel plots and Egger was 0.83 (95% CI = 0.68-0.98). This analysis
regression asymmetry test. All P values were was with a low level of heterogeneity, I2 = 38.6%
2-sides. PBody mass index and esophageal cancer
Table 1. Characteristic of relevant studies on pre-operation BMI and OS of DSC patients included in the meta-analysis
Cancer Age* Gender Maximum Minimum UV-HR MV-HR Quality
Study Country Study Type Duration Histology Size Covariates
Type (range) (M/F) BMI BMI (95% CI) (95% CI) score
Morgan et Wales Prospective 1995-2005 Esophagus AC 61 (31-81) 162/53 215 ≥ 25 ≤ 25 NA 1.1 Age, stage and ASA grade 7
al, 2007 study (0.73, 1.66)
Healy et al, Ireland Retrospective 1998-2005 Esophagus AC 62 (29-79) 129/21 150 ≥ 30 < 30 1.16 NA NA 7
2007 study (0.66, 2.02)
Skipworth UK Prospective 2001-2004 Esophagus NA 67.3 57/36 93 > 25 < 25 0.78 NA NA 7
et al, 2009 study (0.38, 1.6)
Madani et Canada Prospective 1991-2006 Esophagus AC 62 118/24 142 ≥ 30 < 30 0.57 0.57 Age, sex, resection, grade, stage, and 8
al, 2010 study (0.38, 0.88) (0.35, 0.93) lymph node metastasis
Grotenhuis Netherland Prospective 1991-2007 Esophagus AC and NA 450/106 556 ≥ 30 < 18.5 0.58 NA NA 7
et al, 2010 study SCC (0.32, 1.04)
Melis et al, USA Prospective 1994-2010 Esophagus AC and 64 (28-86) 420/70 490 ≥ 30 20-24 0.69 NA NA 7
2011 study SCC (0.51, 0.92)
Yoon et al, USA Prospective 1980-1997 Esophagus AC 65 (22-89) 692/86 778 ≥ 30 18.5-24.9 NA 1.01 Age, sex, stage, grade and weight loss 8
2011 study (0.67, 2.23)
Blom et al, Netherland Prospective 1993-2010 Esophagus AC and 64 (56-73) 569/167 736 ≥ 30 < 25 0.92 NA NA 7
2012 study SCC (0.8, 1.15)
Miao et al, China Prospective 2006-2012 Esophagus AC and 59 1099/243 1342 ≥ 25 < 18.5 1.48 1.16 Age, sex, drinking, smoking, hyperten- 8
2014 study SCC (66.9-51.1) (1.07, 2.04) (0.84, 1.6) sion, diabetes, tumor length, differen-
tiation, grade, stage, weight loss, and
adjuvant chemoradiation
Ejaz et al, USA Prospective 2000-2012 Stomach AC 66.1 446/329 775 ≥ 30 18.5-24.9 NA 1.13 Age, race, preoperative albumin, 8
2014 study (56.8-71.4) (0.79, 1.61) chemotherapy, comorbidities, tumor
size, type, morphology, T stage, AJCC
stage, grade, lymph-vascular invasion,
perineural invasion, and signet ring cell
Lee et al, Korea Retrospective 2000-2008 Stomach AC 58.3 1294/615 1909 ≥ 25 18.5-24.9 NA 0.64 Age, sex, surgery, tumor stage, histol- 8
2015 study (46.5-70.1) (0.41, 1.02) ogy, and curative resection
Liu et al, China Prospective 2004-2013 Stomach AC 64 (27-86) 237/83 320 24-32.2 15.1–24 0.57 0.31 Age, sex, albumin, total cholesterol, 8
2016 study (0.37, 0.9) (0.12, 0.8) triglyceride, high- and low-density lipo-
protein cholesterol, cell differentiation,
invasion depth, lymph node metasta-
sis, distant metastasis, and stage
Tsai et al, USA Prospective 1995-2005 Pancreas AC 66.1 429/366 795 ≥ 30 18.5-24.9 0.75 0.73 Age, sex, race, tumor differentiation 8
2010 study (0.58, 0.98) (0.56, 0.95) and size, surgical details, perineural
invasion, margin and node status, and
weight loss
Dandona et USA Retrospective 1995-2009 Pancreas AC 65.5 192/163 355 ≥ 30 18.5-24.9 0.85 NA NA 7
al, 2011 study (55.3-75.7) (0.61, 1.2)
Gaujoux et USA Prospective 2000-2005 Pancreas AC 71 (63-77) 154/174 328 ≥ 30 18.5-24.9 1.1 NA NA 7
al, 2012 study (0.8, 1.52)
SCC = squamous cell carcinoma, AC = adenocarcinoma, M = male, F = female, UV = univariate, MV = multivariate, HR = hazard ratio, ASA = American Society of Anesthesiology, NA = not available. *Median or mean age.
15 Int J Clin Exp Med 2018;11(1):12-22Body mass index and esophageal cancer Figure 2. Forest plot showed hazard ratios (HRs) and 95% CIs for the highest versus lowest BMI category and overall survival of esophageal cancer. HRs are for pre-operation BMI. Figure 3. Forest plot showed hazard ratios (HRs) and 95% CIs for the highest versus lowest BMI category and overall survival of gastric cancer. HRs are for pre-operation BMI. BMI and survival of cancer (Figures 3 and 4). three PC studies on the association of higher Pooled HR of three GC studies for higher pre- pre-operation BMI and OS of PC participants operation BMI was 0.68 (95% CI = 0.25-1.11). How- revealed that pooled HR was 0.85 (95% CI = ever, a high level of heterogeneity was found (I2 0.65-1.05), without obvious heterogeneity (I2 = = 78.0%, Pheterogeneity = 0.011). Meta-analysis of 37.1%, Pheterogeneity = 0.204). 16 Int J Clin Exp Med 2018;11(1):12-22
Body mass index and esophageal cancer
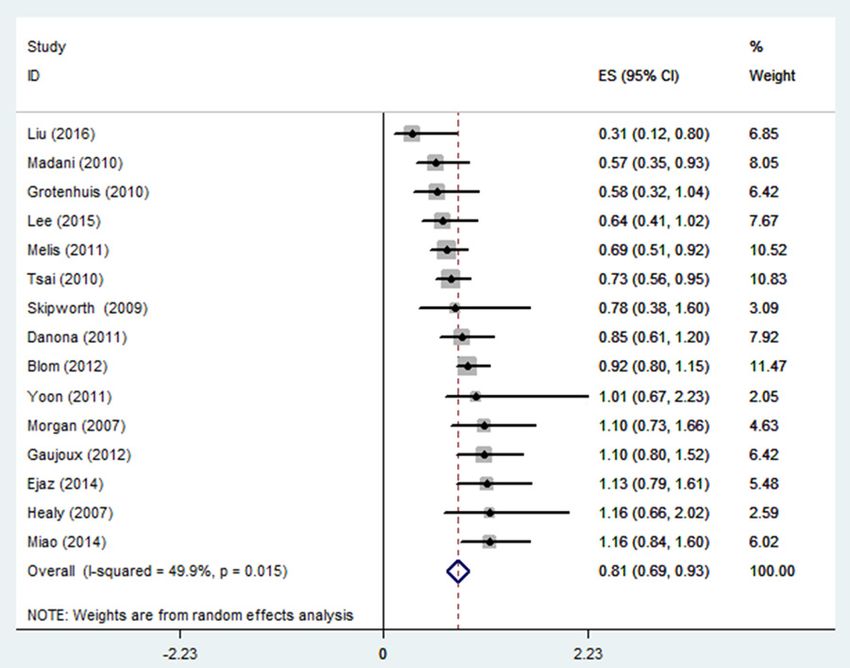
Figure 4. Forest plot showed hazard ratios (HRs) and 95% CIs for the highest versus lowest BMI category and overall
survival of pancreatic cancer. HRs are for pre-operation BMI
95% CI = 0.69-0.93), with
moderate heterogeneity (I2 =
49.9%, Pheterogeneity < 0.015),
compared with lowest BMI
category. The study of Yoon et
al and Healy et al just contrib-
uted to 2.05% and 2.59% of
overall HR, respectively. Total
weight of studies on EC, GC
and PC were 54.83%, 20.0%,
and 25.17%, respectively.
Subgroup analysis, sensitivity
analysis and publication bias
We conducted subgroup anal-
ysis based on information pro-
vided by these studies. We
found that, comparing with
the lowest BMI category, the
Figure 5. Forest plot showed hazard ratios (HRs) and 95% CIs for the highest highest category had a statis-
versus lowest BMI category and overall survival of esophageal, gastric, and tically significant positive ef-
pancreatic cancer. HRs are for pre-operation BMI.
fect on OS of EC patients in
North America group (HR =
Higher pre-operation BMI improves OS of all 0.67; 95% CI = 0.50, 0.83), but not in non-North
cancers America group (Table 2). Moreover, the statisti-
cally significant effect was only found in the
Fifteen studies on highest versus lowest pre- subgroup with sample size < 500. Regarding
operation BMI and mortality of EC, GC and PC the highest versus lowest BMI category and OS
were combined and analyzed (Figure 5). EC, GC of EC patients, there was significant associa-
and PC patients with highest BMI survived lon- tion for prospective studies (HR = 0.81; 95% CI
ger with a 19% lower risk of death (HR = 0.81, = 0.66, 0.97) and these adjusted for covariates
17 Int J Clin Exp Med 2018;11(1):12-22Body mass index and esophageal cancer
Table 2. Random-effect summary estimates of the hazard ratios esophageal cancer, colorectal
(HRs) of the association of OS of esophageal cancer with highest cancer, and pancreatic can-
versus lowest pre-operation BMI comparison cer [26-28].
Study HR (95% CI) I-squared (%) Pheterogeneity
The dispute over the relation-
Region ship between BMI and surviv-
North America 3 0.67 (0.50, 0.83) 0% 0.543 al from gastrointestinal can-
Other regions 6 0.92 (0.76, 1.09) 19.6% 0.286 cer has lasted for decades.
Histology Three published meta-analy-
AC 4 0.88 (0.54, 1.22) 44.0% 0.147 ses had evaluated the asso-
ciation of BMI with the mortal-
AC and SCC 4 1.16 (0.84, 1.60) 60.3% 0.056
ity of digestive system cancer,
Number of patients
including esophageal cancer,
< 500 5 0.76 (0.56, 0.95) 24.7% 0.012 colorectal cancer, and pan-
≥ 500 4 0.90 (0.67, 1.12) 39.5% 0.021 creatic cancer [13, 29, 30].
Study type Zhang et al found that highest
Retrospective 1 1.16 (0.66, 2.02) NA NA BMI could significantly im-
Prospective 8 0.81 (0.66, 0.97) 41.9% 0.019 prove OS of esophageal can-
Adjusted for covariates cer survivors, comparing with
Yes 4 0.93 (0.59, 1.27) 59.5% 0.069
lowest BMI category (HR =
0.78, 95% CI = 0.71-0.85).
No 5 0.79 (0.64, 0.95) 26.2% 0.008
However, the consideration of
SCC = squamous cell carcinoma, AC = adenocarcinoma, HR = hazard ratio, NA =
not available.
accurate BMI category and
time point was missed in their
study [13]. In addition, a study
(HR = 0.79; 95% CI = 0.64, 0.95). Moreover, which enrolled 1324 esophageal cancer par-
subgroup analysis of studies without adjust- ticipants suggested that high BMI is not as-
ment for covariates, did not reveal significant sociated with increased overall morbidity after
association of OS of EC patients with highest esophagectomy [23]. In April of 2016, a meta-
versus lowest BMI comparison. analysis focusing on BMI and OS of pancreatic
cancer cases was published. This analysis
Every turn, we ignored one study and analyzed revealed that adult obesity of pancrea-
the rest articles in sensitivity analysis. When tic cancer is related to shorter OS (HR = 1.29,
every single study was excluded, there was no 95% CI = 1.17-1.41), while obesity at diagnosis
significant change of pooled HR and 95% CI. was not associated with the mortality [29].
Begg funnel plot and Egger regression test Prognostic effect of higher pre-operation BMI
were used to assess publication bias. The fun- on EC, GC, and PC has been searched. However,
nel plot for OS and higher pre-operation BMI of the role of pre-operation BMI on the mortality
EC (Begg test P = 0.801) or GC patients (Begg of cancers from digestive system is still un-
test P = 0.398) showed no asymmetry (Figure clear, though some meta-analysis on BMI and
6). Begg test for highest versus lowest BMI OS of DSC were reported. BMI is easily acquired,
category and mortality of PC (P = 0.537) or all and clear effect of pre-operation BMI on OS
cancers (P = 0.508) failed to reveal any signifi- may help the prognosis of cancers. Therefore,
cant publication bias (Figure 7). Additionally, this meta-analysis was conducted to reveal the
Egger regression test for all groups also sug- prognostic role of pre-operation BMI on OS
gested no obvious publication bias. from EC, GC, and PC.
Discussion Multivariate results were provided by eight
included studies and four studies conducted
The prevalence of obesity worldwide and its both multivariate and univariate analysis.
link to cancer risk and worse outcomes after Because it was easier to find the relationship by
many cancer diagnoses make it a major and analyzing the maximum and minimum BMI,
growing public health concern. Higher BMI we estimated the highest versus lowest pre-
(overweight or obesity) accounts for approxi- operation BMI category and cancer mortality.
mately 20% of all cancer patients, including Most of the highest BMI category of included
18 Int J Clin Exp Med 2018;11(1):12-22Body mass index and esophageal cancer Figure 6. Begg funnel plot test for higher pre-operation BMI and overall survival of esophageal and gastric cancers. (A: Esophageal cancer, B: Gastric cancer). Figure 7. Begg funnel plot test for higher pre-operation BMI and overall survival of pancreatic and all cancers. (A: Pancreatic cancer, B: Esophageal, gastric, and pancreatic cancer). articles in this analysis belonged to overweight The outcome revealed that patients with higher and obese populations. Lowest or referent BMI pre-operation BMI had lower mortality from EC category contained cases with normal and cases. Moreover, we included several studies underweight BMI. Some studies, which only of PC and GC on pre-operation BMI and OS to provided univariated outcomes, were also conduct analysis. The current HR of the highest adapted to achieve more credible pooled versus lowest pre-operation BMI and OS of PC results. As the same histology of adenocarci- survivors was 0.85 (95% CI = 0.65-1.05), and noma and limitation of study numbers, all 15 the result was not coincidence with the former studies were included and estimated the high- study of pancreatic cancer [29]. This difference est versus lowest pre-operation BMI and com- may be caused by the pre-operation BMI status bined mortality of EC, GC, and PC survivals. and limited sample size in this study. 19 Int J Clin Exp Med 2018;11(1):12-22
Body mass index and esophageal cancer

To further demonstrate the predictive value of     growth of anastomosis, and cardiovascular dis-
pre-operative BMI and OS of EC patients, sub-      eases (all P < 0.05) [6, 13, 19-21]. In addition,
group analyses for covariates adjusting were       obese cases had higher rate of diabetes melli-
performed as a supplement. The analysis            tus, which may influence the healing of can-
results of North America, sample size < 500,       cer patients after treatment [20]. Further and
and prospective study groups showed signifi-       thorough study is needed to explore the me-
cant association between higher pre-operation      chanisms behind the relationship between
BMI group and OS of EC patients, comparing         higher pre-operation BMI and OS of particular
with lowest BMI group. Combined analysis of        cancers.
studies from other regions and sample size ≥
500 revealed contrary results, pooled HR of        As we know, this study is the first meta-analysis
was 0.92 (95% CI = 0.76-1.09) and 0.90 (95%        evaluating the effect of pre-operation BMI on
CI = 0.67-1.12), respectively. When we analyzed    OS from EC, GC, and PC. Analysis of three types
the studies unadjusted for covariates, the asso-   of cancer, adjustment of covariates, the rela-
ciation between highest versus lowest pre-         tively large sample size and the summarized
operation BMI category and OS of EC survivals      evidence of single study are strengths in our
was statistically significant (HR = 0.79, 95% CI   study. However, there are some limitations in
= 0.64-0.95). However, we did not obtain mean-     this meta-analysis. Although only two included
ingful result (HR = 0.93, 95% CI = 0.59-1.27)      studies were from developed countries, tech-
from studies adjusted for covariates. Only four    niques, devices, therapies, and other factors
studies included in this meta-analysis were        may restrict the research. Comprehensive and
adjusted for effect of tumor grade in EC cases.    through analysis needs more research informa-
Survival of EC patients was strongly dictated by   tion from developing countries. Except EC, the
tumor stage after neoadjuvant chemotherapy         number of included articles about GC and PC
[31]. Both univariate (P = 0.007) and multivari-   was limited, and the combined result of GC or
ate (P = 0.011) analysis revealed that better      PC maybe inaccurate.
tumor grade was associated with longer sur-
vival in esophageal cancer cases [32]. Loss of     The preoperative weight loss and abdominal
weight, especially loss of skeletal muscle, may    obesity may influence the mortality of general
indicate the bad outcome of several cancers        population and decrease the overall survival of
[33]. Additionally, pancreatic cancer patients     digestive system cancers. However, most of the
who suffer from higher weight loss at diagnosis    included studies did not provide any informa-
or during first-line chemotherapy had short-       tion about both the risk factors [10, 36]. In
ened survival [34].                                addition, some usual covariates for survival of
                                                   cancer cases, including tumor grade, differen-
The potential mechanisms of the effect of high-    tiation, lymph node metastasis, diabetes sta-
er pre-operation BMI on EC patients have not       tus, and treatment, were not adjusted in some
been clarified and elucidated thoroughly. For      studies. To our knowledge, comparing with pro-
many kinds of chronic diseases including           spective studies, lower clinical evidence level
cancer, overweight and obese mean a better         and more uncontrollable biases in retrospec-
nutrition status and potential survival advan-     tive studies may affects our results. Therefore,
tages comparing with normal or lower BMI           we conducted this analysis using as many mul-
[35]. After operation and during chemotherapy,     tivariate data as possible. Our analysis cannot
EC survivals who has higher pre-operation          avoid selection bias, because inclusion of par-
BMI had more nutrient and energy stores. They      ticipants depends on survival time. Additionally,
had larger appetites and higher lipid concentra-   the number of severe cases were less than
tion for preserving energy, fat and muscle         actual proportion in cancer patients.
mass. Enough energy storage is critical for tis-
sue repair, physiological activities, immune       In conclusion, our research indicated that pre-
effect and body elements balance. However,         operation BMI increased the overall survival of
higher BMI is also accompanied by higher inci-     EC. Additionally, higher pre-operation BMI did
dence of complication after treatment. In          not show any association with the survival of
esophageal survivors, higher BMI may induce        GC and PC patients. With the gradual deepen-
anastomotic leakage, wound infection, slow         ing of the study, pre-operation BMI may become

20                                                           Int J Clin Exp Med 2018;11(1):12-22
Body mass index and esophageal cancer
an important predictor of mortality of EC, GC, [9] Tsai S, Choti MA, Assumpcao L, Cameron JL,
and PC survivals. Gleisner AL, Herman JM, Eckhauser F, Edil BH,
Schulick RD and Wolfgang CL. Impact of obe-
Acknowledgements sity on perioperative outcomes and survival
following pancreaticoduodenectomy for pan-
We thank Hualin Han and Gui Zhang for study creatic cancer: a large single-institution study.
selection, quality assessment and data collec- J Gastrointest Surg 2010; 14: 1143-1150.
tion in this meta-analysis. This work was not [10] Skipworth J, Foster J, Raptis D and Hughes F.
The effect of preoperative weight loss and
supported by any funds.
body mass index on postoperative outcome in
Disclosure of conflict of interest patients with esophagogastric carcinoma. Dis
Esophagus 2009; 22: 559-563.
[11] Han HL, Park JM, Song KY, Choi MG and Park
None.
CH. Survival impact of postoperative body
Address correspondence to: Dr. Yangyang Liu, mass index in gastric cancer patients undergo-
ing gastrectomy. Eur J Cancer 2015; 52: 129-
Departments of Oncology, People’s Hospital of
137.
Xintai City, Affiliated to Taishan Medical University,
[12] Dandona M, Linehan D, Hawkins W, Strasberg
Xintai 271200, Shandong, China. Tel: +86-0531- S, Gao F and Wanggillam A. Influence of obe-
7260195; E-mail: yangyangliucn@126.com sity and other risk factors on survival outcomes
in patients undergoing pancreaticoduodenec-
References tomy for pancreatic cancer. Pancreas 2011;
40: 931-937.
[1] Siegel RL, Miller KD and Jemal A. Cancer sta- [13] Bella AE. The impact of body mass index on
tistics, 2016. CA-Cancer J Clin 2016; 66: 7. complication and survival in resected oesoph-
[2] Moor JSD, Mariotto AB, Parry C, Alfano CM, ageal cancer: a clinical-based cohort and me-
Padgett L, Kent EE, Forsythe L, Scoppa S, ta-analysis. Br J Cancer 2011; 109: 2894-
Hachey M and Rowland JH. Cancer survivors in 2903.
the united states: prevalence across the survi- [14] O’Connell D. The newcastle-ottawa scale (NOS)
vorship trajectory and implications for care.
for assessing the quality of nonrandomized
Cancer Epidemiol Biomarkers Prev 2013; 22:
studies in meta-analyses. Appl Eng Agric 2002;
561-570.
18: págs. 727-734.
[3] Somers E. International agency for research on
[15] Parmar MK, Torri V and Stewart L. Extracting
cancer. CMAJ 1985; 133: 845-846
summary statistics to perform meta-analyses
[4] Lazcano-Ponce E. Second expert report, food,
of the published literature for survival end-
nutrition, physical activity and the prevention
points. Stat Med 1998; 17: 2815-2834.
of cancer: a global perspective. Salud Publica
[16] Han J, Cui J, Chen P, Zhang H and Zhu Y. Prog-
De Mexico 2009; 51: S678-S680.
nostic significance of FOXM1 in digestive sys-
[5] Madani K, Zhao R, Lim HJ, Casson SM and
Casson AG. Obesity is not associated with ad- tem cancers: a systematic review and meta-
verse outcome following surgical resection of analysis. Int J Clin Exp Med 2017; 10:
oesophageal adenocarcinoma. Eur J Cardio 4244-4255.
Thorac 2010; 38: 604-608. [17] Wallin A, Orsini N and Wolk A. Red and pro-
[6] Grotenhuis BA, Wijnhoven BP, Hötte GJ, Ep cessed meat consumption and risk of ovarian
VDS, Tilanus HW and van Lanschot JJ. Prog- cancer: a dose-response meta-analysis of pro-
nostic value of body mass index on short-term spective studies. Br J Cancer 2011 29; 104:
and long-term outcome after resection of 1196-1201.
esophageal cancer. World J Surg 2010; 34: [18] Higgins JP, Thompson SG, Deeks JJ and Altman
2621-2627. DG. Measuring inconsistency in meta-analy-
[7] Melis M, Weber JM, Mcloughlin JM, Siegel EM, ses. Brit Med J 2003; 327: 557-560.
Hoffe S, Shridhar R, Turaga KK, Dittrick G, [19] Morgan MA, Lewis WG, Hopper AN, Escofet X,
Dean EM and Karl RC. An elevated body mass Harvard TJ, Brewster AE, Crosby TD, Roberts
index does not reduce survival after esopha- SA and Clark GW. Prognostic significance of
gectomy for cancer. Ann Surg Oncol 2011; 18: body mass indices for patients undergoing
824-831. esophagectomy for cancer. Dis Esophagus
[8] Liu BZ, Tao L, Chen YZ, Li XZ, Dong YL, Ma YJ, 2007; 20: 29-35.
Li SG, Li F, Zhang WJ and Liu BZ. Preoperative [20] Blom RL, Lagarde SM, Klinkenbijl JH, Busch
body mass index, blood albumin and triglycer- OR and van Berge Henegouwen MI. A high
ides predict survival for patients with gastric body mass index in esophageal cancer pa-
cancer. PLoS One 2016; 11: e0157401. tients does not influence postoperative out-
21 Int J Clin Exp Med 2018;11(1):12-22Body mass index and esophageal cancer
come or long-term survival. Ann Surg Oncol [30] Schlesinger S, Siegert S, Koch M, Walter J,
2012; 19: 766-771. Heits N, Hinz S, Jacobs G, Hampe J, Schafmay-
[21] Healy LA, Ryan AM and Gopinath B. Impact of er C and Nöthlings U. Postdiagnosis body mass
obesity on outcomes in the management of lo- index and risk of mortality in colorectal cancer
calized adenocarcinoma of the esophagus and survivors: a prospective study and meta-analy-
esophagogastric junction. J Thorac Cardio Surg sis. Cancer Causes Control 2014; 25: 1407-
2007; 134: 1284-1291. 1418.
[22] Yoon HH, Lewis MA, Shi Q, Khan M, Cassivi SD, [31] Davies AR, Gossage JA, Zylstra J, Mattsson F,
Diasio RB and Sinicrope FA. Prognostic impact Lagergren J, Maisey N, Smyth EC, Cunningham
of body mass index stratified by smoking sta- D, Allum WH and Mason RC. Tumor stage after
tus in patients with esophageal adenocarcino- neoadjuvant chemotherapy determines sur-
ma. J Clin Oncol 2011; 29: 4561-4567. vival after surgery for adenocarcinoma of the
[23] Miao L, Chen H, Xiang J and Zhang Y. A high esophagus and esophagogastric junction. J
body mass index in esophageal cancer pa- Clin Oncol 2014; 32: 2983-2990.
tients is not associated with adverse outcomes [32] Situ D, Wang J, Lin P, Long H, Zhang L, Rong T
following esophagectomy. J Cancer Res Clin and Ma G. Do tumor location and grade affect
2015; 141: 941-950. survival in pT2N0M0 esophageal squamous
[24] Ejaz A, Spolverato G, Kim Y, Poultsides GA, cell carcinoma? J Thorac Cardio Surg 2013;
Fields RC, Bloomston M, Cho CS, Votanopoulos 146: 45-51.
K, Maithel SK and Pawlik TM. Impact of body [33] Vrieling A and Kampman E. The role of body
mass index on perioperative outcomes and mass index, physical activity, and diet in
survival after resection for gastric cancer. J colorectal cancer recurrence and survival: a
Surg Res 2014; 195: 74-82. review of the literature. Am J Clin Nutr 2010;
[25] Gaujoux S, Torres J, Olson S, Winston C, Gonen 92: 471-490.
M, Brennan MF, Klimstra DS, D’Angelica M, [34] Choi Y, Kim TY, Lee KH, Han SW, Oh DY, Im SA,
Dematteo R and Fong Y. Impact of obesity and Kim TY and Bang YJ. The impact of body mass
body fat distribution on survival after pancre- index dynamics on survival of patients with ad-
aticoduodenectomy for pancreatic adenocarci- vanced pancreatic cancer receiving chemo-
noma. Ann Surg Oncol 2012; 19: 2908-2916. therapy. J Pain Symptom Manage 2014; 48:
[26] Wolin KY, Carson K and Colditz GA. Obesity and 13-25.
cancer. Oncologist 2010; 15: 556-565. [35] Davos CH, Doehner W, Rauchhaus M, Cicoira
[27] Nock NL. Obesity and gastrointestinal cancers: M, Francis DP, Coats AJ, Clark AL and Anker
epidemiology. Springer US 2012. SD. Body mass and survival in patients with
[28] Nock NL and Berger NA. Obesity and cancer: chronic heart failure without cachexia: the im-
overview of mechanisms. Energy Balance Can- portance of obesity. J Card Fail 2003; 9: 29-
cer 2010; 2: 129-179. 35.
[29] Shi YQ, Yang J, Du P, Xu T, Zhuang XH, Shen JQ [36] Pischon T, Boeing H and Hoffmann K. General
and Xu CF. Effect of body mass index on overall and abdominal adiposity and risk of death in
survival of pancreatic cancer: a meta-analysis. europe. J Vasc Surg 2009; 49: 811-812.
Medicine 2016; 95: e3305.
22 Int J Clin Exp Med 2018;11(1):12-22You can also read