Effect of particle size on phytochemical composition and antioxidant properties of Sargassum cristaefolium ethanol extract - Nature
←
→
Page content transcription
If your browser does not render page correctly, please read the page content below
www.nature.com/scientificreports
OPEN Effect of particle size
on phytochemical composition
and antioxidant properties
of Sargassum cristaefolium ethanol
extract
E. S. Prasedya1,2, A. Frediansyah3,4, N. W. R. Martyasari1, B. K. Ilhami1, A. S. Abidin1,
H. Padmi2, Fahrurrozi5, A. B. Juanssilfero5, S. Widyastuti6 & A. L. Sunarwidhi7*
Sample particle size is an important parameter in the solid–liquid extraction system of natural
products for obtaining their bioactive compounds. This study evaluates the effect of sample particle
size on the phytochemical composition and antioxidant activity of brown macroalgae Sargassum
cristaefolium. The crude ethanol extract was extracted from dried powders of S.cristeafolium with
various particle sizes (> 4000 µm, > 250 µm, > 125 µm, > 45 µm, and < 45 µm). The ethanolic extracts
of S.cristaefolium were analysed for Total Phenolic Content (TPC), Total Flavonoid Content (TFC),
phenolic compound concentration and antioxidant activities. The extract yield and phytochemical
composition were more abundant in smaller particle sizes. Furthermore, the TPC (14.19 ± 2.08 mg
GAE/g extract to 43.27 ± 2.56 mg GAE/g extract) and TFC (9.6 ± 1.8 mg QE/g extract to 70.27 ± 3.59 mg
QE/g extract) values also significantly increased as particle sizes decreased. In addition, phenolic
compounds epicatechin (EC), epicatechin gallate (ECG), epigallocatechin (EGC), and Epigallocatechin
gallate (EGCG) concentration were frequently increased in samples of smaller particle sizes based
on two-way ANOVA and Tukey’s multiple comparison analysis. These results correlate with the
significantly stronger antioxidant activity in samples with smaller particle sizes. The smallest particle
size (< 45 µm) demonstrated the strongest antioxidant activity based on DPPH, ABTS, hydroxyl
assay and FRAP. In addition, ramp function graph evaluates the desired particle size for maximum
phytochemical composition and antioxidant activity is 44 µm. In conclusion, current results show the
importance of particle size reduction of macroalgae samples to increase the effectivity of its biological
activity.
Seaweeds or also referred to as macroalgae are currently being explored for sources of novel and sustainable com-
pounds for both pharmaceutical and nutraceutical p urposes1. Biologically active substances known as “bioactive
compounds” have been well reported in various natural resources, including s eaweeds2–4. Bioactive compounds
such as carotenoids, polyphenols, tocotrienols, sulfated polysaccharides are of high interest5. Due to this vast
variety of bioactive constituents, seaweeds have been proven to demonstrate various biological activities, espe-
cially antioxidant activity by inhibiting reactive oxygen radical-mediated oxidative stress.
Marine macroalgae belong to three major classes or phyla: Chlorophyceae (green algae), Rhodophyceae (red
algae), and Phaeophyceae (brown algae). The most extensively studied macroalgae are those of the Phaeophyceae
family6. Brown macroalgae are well known to be rich in polyphenol compounds which potentially contribute
1
Bioscience and Biotechnology Research Centre, Faculty of Mathematics and Natural Sciences, University of
Mataram, Mataram, Indonesia. 2Department of Biology, Faculty of Mathematics and Natural Sciences, University
of Mataram, Mataram, Indonesia. 3Research Division for Natural Product Technology (BPTBA), Indonesian
Institute of Sciences (LIPI), Wonosari, Indonesia. 4Pharmaceutical Institute, University of Tuebingen, Tuebingen,
Germany. 5Laboratory of Biochemical Engineering and Food Biotechnology, Research Centre for Biotechnology,
Indonesian Institute of Sciences (LIPI), Bogor, Indonesia. 6Faculty of Food Technology and Agroindustry, University
of Mataram, Mataram, Indonesia. 7Department of Pharmacy, Medical Faculty, University of Mataram, Mataram,
Indonesia. *email: anggit.sunarwidhi@unram.ac.id
Scientific Reports | (2021) 11:17876 | https://doi.org/10.1038/s41598-021-95769-y 1
Vol.:(0123456789)
www.nature.com/scientificreports/
to its antioxidant capacity7. The brown seaweed Sargassum species have shown strong antioxidant activity8. The
brown macroalgae Sargassum cristaefolium is one of the most abundant Sargassum species in the coastal area
of Lombok, Indonesia.
Several parameters have been reported to influence the amount and composition of the potential bioactive
compounds in extracts9. Furthermore, these parameters also affect the biological activity of the extract. Some of
them include the extraction solvent, temperature, extraction time, storage conditions, and also sample particle
size10. The phytochemical compositions of extracts have been reported to be influenced by the particle size of
the extracted sample. Previous reports have demonstrated that reduction of sample particle size has a significant
effect on the amount of bioactive constituents o btained11. However, this is the first report to evaluate the effect
of particle size on the phytochemical composition and antioxidant activity of macroalgae. Due to the increasing
demand to obtain bioactive compounds from macroalgae, there is a need to understand every aspect during
the extraction process of the macroalgae biomass especially the particle size as it is the very initial step. Thus,
this paper aims to evaluate the impact of particle size on the extraction yield, phenol content, and antioxidant
activity of brown macroalgae S.cristaefolium.
Materials and methods
Chemicals and standard solutions. All chemicals were of analytical grade. Ethanol were from Merck
(Darmstadt, Germany) and l-ascorbic acid by Sigma-Aldrich (Steinhein, Germany). Water used for all experi-
ments and solutions was obtained from Milli-Q water purification system (Millipore) (Bedford, MA, USA).
Folin-Ciocalteu’s phenol reagent was purchased from Merck (Darmstadt, Germany). DPPH and ABTS reagents
were purchased from Tokyo Chemical Industry Co. Ltd (TCI). Standards of catechin (C), epicatechin (EC),
epicatechin gallate (ECG), epigallocatechin (EGC), Quercetin (QUE), Procatechuic acid (PCA), and Epigallo-
catechin gallate (EGCG) were from Sigma-Aldrich (St. Louis, MO, USA).
Macroalgae sample collection and preparation. Samples of Sargassum cristaefolium were harvested
offshore from Lendang luar beach, West Lombok, Indonesia (8.459692, 116.029639) in February 2021. The mac-
atabase12. The samples were washed with seawater and
roalgae samples were identified based on the algae online d
cleaned from sand debris before transported to the Laboratorium. Approximately 200 g of fresh S.cristaefolium
samples were left to dry at room temperature (24 °C) regulated with an air conditioner for 4 days until the
dry biomass reaches constant weight (± 50 g dry weight). The Fungicide tablets 1% concentration (Rely + On,
Virkom) were also applied to avoid contamination from fungal growth. Dried samples were then stored in
ziplock bags with silica gels until further use.
Macroalgae sample partition and extraction. Dried macroalgae samples were grounded with a food-
grade grain miller to decrease the particle size. The ground samples were sieved on a Sieve shaker (Retsch As 200,
USA) to separate the samples into various sizes; < 45 µm, > 45 µm, > 125 µm, > 250 µm, and > 4000 µm. All the
dried samples with different particle sizes were prepared before subjected to ethanol extraction. The extraction
process was conducted via cold maceration with the sample to solvent ratio of 1:10. The samples were stirred
vigorously in ethanol solvent for 30 min and then subjected to centrifugation at 8000 rpm for 10 min (Tomy
MX-307, Tomy Seiko Co., Ltd, Japan). The supernatant was collected and filtered with a filter cloth. This step was
repeated 3 times, the final filtrate was then evaporated with a rotary evaporator at 45 °C and 50 rpm (Rotavapor
R-215, Switzerland). Obtained extract pastes were then stored at 4 °C until further use.
Determination of total phenolic content. The Total Phenolic Contents (TPC) of the S.cristaefolium different
particle sizes were determined by Folin-Ciocalteu colorimetric method as described by Ainsworth and Gillespie
with some minor modifications13. Gallic acid (GAE) solution was used as standard and prepared by dissolving
10 mg in 10 mL of ethanol (1 mg/mL). Various concentrations of GAE (10–500 µg/mL) were prepared from
the stock solution. Approximately 100 µL of the sample (1 mg/mL) was combined and mixed with 0.75 mL of
the Folin-Ciocalteu reagent (diluted tenfold in dH2O before use). The liquid mixture was incubated at room
temperature for 5 min. The mixture was then added about 750 µL sodium carbonate (Na2CO3), the mixture was
mixed gently with pipetting. After 90 min, the absorbance of the mixture was measured at 725 nm with a UV–Vis
spectrophotometer (Multiskan-Go, Thermo Scientific). The TPC value of samples was revealed as Gallic acid
equivalents in milligrams per 100 g of the extract.
Determination of total flavonoid content. The total flavonoid content was measured by a colorimetric assay.
About 100 µL of the sample was added to 4 mL of d H2O. Then followed by the addition of 300 µL of 5% sodium
nitrite. After 5 min, 300 µL of 10% aluminium chloride was added. The mixture was incubated for an additional
6 min before the addition of 2 mL 1 M sodium hydroxide. Immediately, the mixture was diluted by the addition
of 3.3 mL dH2O and vortexed. The absorbance was determined at 510 nm versus a blank. Quercetin was used as
the standard for the calibration curve. The total flavonoid content of the sample was expressed as mg quercetin
equivalents per gram of sample (mg/g).
High resolution mass spectromety analysis. For spectrometry analysis, a Q Exactive™ High-Resolu-
tion Accurate Mass LC–MS/MS (Thermo Scientific™) attached to a Thermo Scientific™ VanquishTM Flex UHPLC
system was used. Using a flow rate of 0.3 mL/min and a 5 μL injection volume, the HPLC method was (0.1 per-
cent formic acid in H2O MS grade as solvent A and 0.1 percent formic acid in Acetonitrile MS grade as solvent
B), a gradient of 5 percent to 90 percent B in 16 min, an isocratic of 90 percent B for 4 min, and an additional
Scientific Reports | (2021) 11:17876 | https://doi.org/10.1038/s41598-021-95769-y 2
Vol:.(1234567890)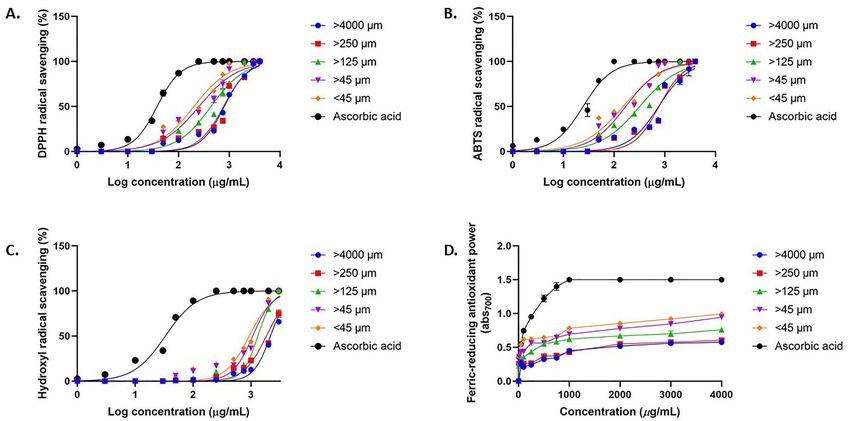
www.nature.com/scientificreports/
5 min 90 percent to 5 percent B. The separation was carried out on a 2.6 m Accucore™ Phenyl Hexyl 100 × 2 mm
column, with an MS acquisition range of 150 to 1800 m/z. We used a sheath gas flow rate of 15, an auxiliary gas
flow rate of 5, a spray voltage of 3.6 kV, a capillary temperature of 320 °C, an auxiliary gas heater temperature
of 30 °C, and an S-lens RF level of 50. The resolution was set to 70,000 for the entire MS, with an AGC target of
3e6 and a maximum IT of 250 ms. Additionally, the resolution for dd-MS2 was set to 17,500, with an AGC target
of 1e5 and a maximum IT of 60 ms. Furthermore, the loop count was set to 5, and the (N) CE/steeped nce was
18, 35, 53, with TopN and isolation window set to 5 and 1.0 mz, respectively. For dd setting, the minimum AGC
target was 9e3, with an intensity of 1.3e5 and a charge exclusion of 4–8, > 8. The exclude isotope must be enabled,
and the dynamic exclusion time must be set to 10 s. Caffeine was used as a calibrant in the study.
High performance liquid chromatography (HPLC) analysis. The concentrations of phenolic com-
pounds were analyzed using high-performance chromatography (HPLC) (LC-20AB, SPD- M20A photodiode
array detector (PDA), Shimazu, Kyoto Japan) equipped with an InfinityLab Poroshell 120 EC-C18 chromatog-
raphy column, 150 mm length, 4.6 mm width, and particle size 2.7 μm at column oven temperature 26 °C. The
binary gradient method was used in HPLC analysis incorporated 2% acetic acid dissolved in water (A) and a
mixture of concentrated acetic acid, water, and acetonitrile (1:9:40 v/v/v) (B). The total runtime of the analysis
was 93 min referring to the method described elsewhere14 as follows: (a) initially 0–25 min, 10–30% B; (b)
25–50 min, 30–40% B; (c) 50–75 min, 40–90% B; (d) 75–93 min, 10% B. An amount of 20 μL of the samples was
injected onto the column, and three wavelengths 280, 360 and 520 nm were chosen for analysis in this investiga-
tion using HPLC–DAD. For quantitative purposes, a calibration curve was constructed by analysis of known
concentrations of different standard compounds.
DPPH radical scavenging assay. Radical scavenging activity against DPPH radical was measured as
described by Mansour et al.15, with minor modifications. A sample of 100 µL with various concentrations (10–
4000 µg/mL) was mixed with 100 µL solution of DPPH in a 96-well plate. A mixture of the sample with solvent
without DPPH radical was added for blank. The plate was allowed to stand in the dark (RT) for 20 min. The
absorbance was measured at 520 nm. The sample radical scavenging activity was measured with the equation
below:
Abssample − Absblank
Scavenging effect (%) = 1 − × 100% (1)
Abscontrol
ABTS radical scavenging assay. The scavenging activity of extracts was measured against ABTS radical
cation according to the method of Nenandis et al.16, with minor modifications. The stock solutions prepared
included 7 mM ABTS aqueous solution and a 2.4 mM potassium persulfate solution. The working solution
was prepared by mixing the two stock solutions in equal quantities and allowing them to react for 16 h at room
temperature in the dark. The solution was then diluted by mixing 250 µL ABTS with 12 mL ethanol to obtain an
absorbance of around 0.700 units at 734 nm using a spectrophotometer. Fresh ABTS solution was prepared for
each assay. A volume of 1 mL sample extracts of various concentrations (10–4000 µg/mL) was mixed with 1 mL
ABTS solution and the absorbance was measured at 734 nm after 7 min of incubation at room temperature. The
ABTS scavenging activity of the extracts was calculated with the same equation above (1).
Hydroxial anti radical scavenging assay. The hydroxyl radical scavenging ability of the extracts was
evaluated based on a Fenton-type reaction17. A volume of 1 mL sample in various concentrations (10–4000 µg/
mL) was mixed with 1 mL of 9 mM ferric sulfate, 1 mL of 9 mM ethanolic salicylic acid, and 1 mL of 9 mM
hydrogen peroxide. The mixture was incubated for 30 min at 37 °C. The absorbance was measured at 510 nm.
Ascorbic acid was used as the positive control. The activity was calculated as Eq. (1).
Ferric reducing antioxidant power assay (FRAPS). The Ferrous Reducing Antioxidant Power Assay
(FRAPS) of the extracts were evaluated by the method described by Mansoori et al.18 with minor modifications.
The Fe2+ can be monitored by measuring the formation of Perl’s Prussian blue at 700 nm. A volume of 0.25 mL
samples/standard at different concentrations (10–4000 µg/mL) were mixed with 0.625 mL potassium buffer
(0.2 M) and 0.625 mL of 1% potassium ferricyanide [K3Fe(CN)6] solution were added into the test tubes. The
reaction mixtures were incubated for 20 min at 50 °C to complete the reaction. To this mixture, a volume of
0.625 mL 10% trichloroacetic acid (TCA) solution was added. The total mixture was centrifuged at 3000 rpm for
10 min. The supernatant (1.8 mL) was collected and mixed with 1.8 mL dH2O and 0.36 mL 0.1% Ferric chloride
(FeCl3) solution. The absorbance of the solution was recorded at 700 nm using a spectrophotometer. Increased
absorbance of the reaction mixture indicates increased reducing capacity.
Statistical analysis. All assays were carried out in triplicates. Data were presented as mean ± SD to evaluate
significant relationships between experimental parameters. The statistical ANOVA analysis with Tukey’s multi-
ple comparisons. The IC50 value and graphs were generated with Graphpad Prism software (v9.1.10). Optimal
particle size was predicted using Response Surface Method in Design Expert 13.
Scientific Reports | (2021) 11:17876 | https://doi.org/10.1038/s41598-021-95769-y 3
Vol.:(0123456789)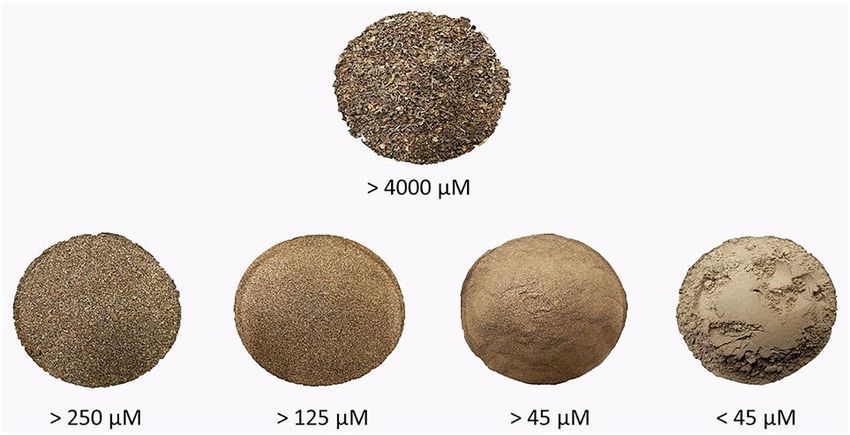
www.nature.com/scientificreports/
Figure 1. Brown macroalgae S.cristaefolium and their corresponding thallus grounded to different particle
sizes.
Figure 2. Effect of particle size on S.cristaefolium extract (A) total yield, (B) yield increase, (C) TPC-Total
Phenolic Content, and (D) TFC-Total Flavonoid Content. Different letters indicating significant difference
(p < 0.05).
Results and discussion
Effect of particle size on extract yield. Prior to extraction, the samples were separated into various sizes
(< 45 µm, > 45 µm, > 125 µm, > 250 µm, and > 4000 µm) (Fig. 1). The fraction of < 45 µm showed the maximum
extract yield with approximately 4% of algal powder dry weight (Fig. 2A). A Previous study reported that extrac-
tion of green tea leaves from smaller particle sizes produced higher extract yield (> 1000 µm)19,20. In the case
of macroalgae samples, a study on red macroalgae Laminaria spp. shown that smaller particle sizes produced
higher extract y ield21. Overall, the total extract yield increased as the sample particle size decreases (Fig. 2B). By
reducing the particle size of the algal powder, the contact surface area of the sample and the ethanol solvent used
for extraction is increased22. Thus resulting in a significantly higher amount of extract yield obtained.
Effect of particle size on total phenolic content (TPC) and total flavonoid content (TFC). The
phytochemical composition of S.cristaefolium ethanol extracts shown higher contents in samples of smaller par-
ticle sizes (Table 1). The extract from samples with smaller particle sizes produced significantly higher Total
Phenolic Content (TPC) and Total Flavonoid Content (TFC) (Fig. 2C,D). However, no significant differences
were observed between particle sizes of > 45 µm and < 45 µm. Numerous reports have demonstrated the impor-
tance of sample particle size in the solid–liquid extraction s ystem23. However, in some studies reducing particle
size does not always contribute to higher bioactive compounds retrieved. In tea, the reduction in particle size
led to a higher decrease in almost all phenolic compound catechins measured24. In addition, in some cases, the
granulometric characteristics do not influence the amount of bioactive compounds e xtracted25. For example, the
total phenolic content and antioxidant activity of green propolis were increased regardless of the particle size.
But in the case of macroalgae or seaweed, reduction of particle size is necessary due to its rigid biomass texture.
Scientific Reports | (2021) 11:17876 | https://doi.org/10.1038/s41598-021-95769-y 4
Vol:.(1234567890)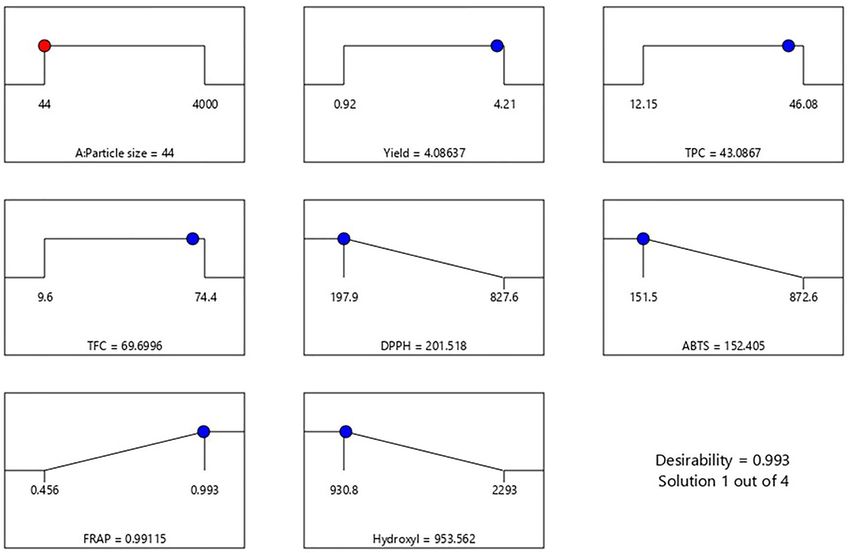
www.nature.com/scientificreports/
> 4000 µm > 250 µm > 125 µm > 45 µm < 45 µm Ascorbic acid
Yield (%) 1.03 ± 0.15a 2.05 ± 0.4b 2.33 ± 0.7c 3.08 ± 0.08d 4.07 ± 0.18e
Phytochemical composition
Total Phenolic content (mg GAE/g
14.19 ± 2.08a 23.14 ± 1.86b 28.92 ± 1.78c 44.95 ± 2.62d 43.27 ± 2.56d
extract)
Total Flavonoid content (mg QE/g
9.6 ± 1.8a 23.67 ± 3.25b 35.67 ± 3.41c 62.73 ± 8.61d 70.27 ± 3.59d
extract)
Free radical scavenging activity IC50 (µg/mL)
DPPH radical scavenging activity (IC50) 803.1 ± 1.89a 822.4 ± 1.78a 438.1 ± 1.32b 254.9 ± 2.5c 202.7 ± 1.22c 37.94 ± 2.89d
ABTS radical scavenging activity (IC50) 758.7 ± 1.48a 772.4 ± 3.78a 321.5 ± 2.13b 170.1 ± 3.26c 151.5 ± 2.12c 24.53 ± 2.54d
Hydroxyl radical scavenging activity
2163 ± 2.96a 1840 ± 2.24b 1310 ± 3.32c 1068 ± 2.51d 930.8 ± 4.14d 33.11 ± 1.61e
(IC50)
Ion reducing activity
Ferric reducing power (Abs at 700 nm) 0.574 ± 0.013a 0.602 ± 0.01a 0.759 ± 0.029b 0.944 ± 0.015c 0.993 ± 0.04c 1.523 ± 0.06d
Table 1. Phytochemical composition and antioxidant activity of different sample particle size of
S.cristaefolium ethanol extract. Different letters indicating significant difference between columns (p < 0.05).
Figure 3. Mass Spectrometry analysis of S. cristaefolium extracts with varying particle sizes. (A) Comparative
HR-ESI–MS analysis showing different metabolite compositions. The red box indicates changes in
phytochemical composition. (B) HPLC analysis of phenolic compounds showing increased concentration
in samples with smaller particles. Known standards are listed as follows, 1. EGC-Epigallocatechin; 2. PCA-
Protocatechuic Acid; 3. C-Catechin hydrate; 4. ECG-Epicatechin gallate; 5. EGCG-Epigallocatechin gallate; 6.
QUE-Quercetin.
The size reduction of a biological sample before extraction maximizes the surface area, which in turn enhances
the transfer of bioactive compounds from the biological material to the solvent26. The content of TPC and TFC
from several Sargassum species had been demonstrated in other studies27. However, due to different parameters
and sample preparation, the results are sometimes incomparable. Based on our results, we suggest that smaller
particle sizes in macroalgae dried sample is beneficial for the improvement of the TPC and TFC content which
has significant effects on its antioxidant activity.
Effect of particle size on metabolite profle (HR‑ESI–MS analysis). Particle size is one parameter
that has a significant effect on the extraction of bioactive compounds from natural products28,29. Our results
show that there is increased metabolite composition based on reduction of sample particle size (Fig. 3A). Inter-
estingly in samples with particle size larger than 4000 µm, a significant reduction of non-polar metabolites was
Scientific Reports | (2021) 11:17876 | https://doi.org/10.1038/s41598-021-95769-y 5
Vol.:(0123456789)www.nature.com/scientificreports/
Concentration (mg/g)
Phenolic compound > 4000 µm > 250 µm > 125 µm > 45 µm < 45 µm
EGC 3.30 ± 0.26a 11.48 ± 0.4b 13.79 ± 0.68c 19.73 ± 0.76d 20.04 ± 0.5e
PCA 0.010 ± 0.003a 0.014 ± 0.004a 0.018 ± 0.004a 0.020 ± 0.005a 0.023 ± 0.002a
a a a a
C 0.069 ± 0.003 0.074 ± 0.006 0.082 ± 0.006 0.087 ± 0.005 0.091 ± 0.004a
a b c d
ECG 4.70 ± 0.17 12.01 ± 0.48 13. 99 ± 0.58 20.67 ± 0.89 24.97 ± 0.78e
a b c d
EGCG 4.13 ± 0.08 6.10 ± 0.57 7.33 ± 0.71 9.25 ± 0.50 10.67 ± 0.21e
a a a a
QUE 0.51 ± 0.04 0.57 ± 0.03 0.61 ± 0.09 0.84 ± 0.11 1.20 ± 0.08a
Table 2. Amounts (mg/g sample) of selected phenolic compounds (EGC epigallocatechin; PCA protocatechuic
acid; C catechin hydrate; ECG epicatechin gallate; EGCGepigallocatechin gallate; QUE quercetin) in
S.cristaefolium extracts. Different letters indicating significant difference between columns (p < 0.05).
observed in the 22 min range. Previous research also increase in bioactive compound composition in smaller
particle size of various plant leaves30. The reduction of particle size not only increases the diffusivity of bioac-
tive compounds, but also helps to rupture the cell walls of the sample31,32. The reduction of sample particle size
important in macroalgae samples, as the cell walls in macroalgae are extremely t hick33.
Effect of particle size on phenolic profile (HPLC analysis). In order to evaluate the effect of particle
size on the phenolic profile of S.cristaefolium extract, the HPLC analysis was performed (Fig. 3B). This HPLC
analysis revealed the presence of some major phenolic compounds such as EGC-Epigallocatechin; PCA-Proto-
catechuic Acid; C-Catechin hydrate; ECG-Epicatechin gallate; EGCG-Epigallocatechin gallate; QUE-Quercetin
(Table 2). Presence of phenolic compounds have been well reported in seaweeds. Tabled results showed that epi-
catechin, which was the most frequently appearing phenolic compound in S.cristaefolium extract. These group of
polyphenols are also proven to be abundant in other seaweeds such as Undaria pinnatifida and the red seaweed
Palmaria palmata34. Based on our results the phenolic compound EGC, ECG, EGCG were significantly higher
in samples with smaller particle sizes. Other similar studies of HPLC analysis of phenolic compounds in algal
samples showed that EGC could range from 0.13 to 3.8 mg/g or from 0.25 to 0.76 mg/g35,36. The immense differ-
ence of these values could caused by many factors, not only the species and origin but also extraction process.
Effect of particle size in antioxidant activity. The role of particle size has been previously reported
to significantly affect the antioxidant activity of the extract. This has been observed in several natural products
including wheat, banana, and blackberries37–39. As previously described in our results, the phytochemical com-
position are significantly affected by sample particle size. A significant correlation has been reported between the
antioxidant activity of natural products due to their phenolic constituents40–42.
The antioxidant activity of macroalgae has been well reported in previous s tudies2,38,43,44. The most important
and studied bioactive compounds from marine macroalgae are polyphenols, polysaccharides, carotenoids, and
polyunstaturated fatty acids45,46. The phenolic compounds are the main contributors to the antioxidant activity,
and this is shown that S.cristaefolium extract with higher TPC value and phenolic compound concentrations show
stronger antioxidant activity. The extract from the smaller particle size samples produced stronger antioxidant
activity based on DPPH, ABTS, hydroxyl assay, including Ferric Reducing Antioxidant Power (FRAP) (Fig. 4).
Brown macroalgae Sargassum wightii has shown strong inhibition against free-radical DPPH and ABTS with
IC50 around 320 to 800 µg/mL47. Another study shown presence of major antioxidant components such as Sar-
gahydroquinoic acid (SHQA), sargachromanol (SCM) and sargaquinoic acid (SQA) in Sargassum serratifolium.
These components demonstrate strong antioxidant capacities with I C50 values below 100 µg/mL48. Among all
antioxidant assay, S.cristaefolium extract show strongest activity against ABTS radical. The ABTS assay is con-
sidered more sensitive in identifying antioxidant activity because of the faster reaction kinetics, and its response
to antioxidants is higher compared to other r adicals49. Overall, the extract with smaller particle size has more
potential to react with free radicals and terminate them into non-reactive stable form.
Validation analysis of optimum particle size. Desirability optimization of sample particle size con-
dition was carried out for accumulative phytochemical composition and antioxidant activity. During desira-
bility determination, the criteria proposed for selecting the optimum particle size conditions for macroalgae
S.cristaefolium were for independent responses; TPC and TFC were maximized while Antioxidant activities
(DPPH, ABTS, Hydroxyl anti-radical scavenging assay, FRAPS) were minimized. By applying the desirability
function approach, the optimum particle size of S.cristaefolium samples was obtained. Figure 5 showed desir-
ability ramps that were developed from optimum points via numerical optimization. A triplicate experiment was
set up to validate the optimized condition. The composite desirability (0.993) is close to 1, which indicates the
settings seem to achieve favourable results for all responses as a whole50. Based on predictive model, the opti-
mum particle size is 44 µm to obtain favourable results of phytochemical composition and antioxidant activity.
This prediction correlates to results showing that sample particle sizes < 45 µm showed maximum phytochemical
composition and antioxidant activity.
Scientific Reports | (2021) 11:17876 | https://doi.org/10.1038/s41598-021-95769-y 6
Vol:.(1234567890)www.nature.com/scientificreports/
Figure 4. Effect of particle size on S.cristaefolium extract antioxidant activity based on (A) DPPH, (B) ABTS,
(C) hydroxyl, and (D) ferric reducing assay. Experiments are done in triplicates, values are expressed as
means ± SEM.
Figure 5. Desirability analysis. Plots ramp showing the optimal particle size that maximize TPC, TFC, and
antioxidant activity.
Conclusion
The present study has shown that particle size is important in improving the phytochemical constituents and
antioxidant activity of macroalgae S.cristaefolium. The constituent of bioactive compounds; phenolic and flavo-
noid compounds increased due to reduction of particle size. Metabolite profile and major phenolic compounds
were also significantly increased compared to larger particles. Furthermore, this contributes to the increase
of antioxidant activity of the extracts with smaller particle size. Particle size less than 45 µm showed the best
Scientific Reports | (2021) 11:17876 | https://doi.org/10.1038/s41598-021-95769-y 7
Vol.:(0123456789)www.nature.com/scientificreports/
phytochemical composition and antioxidant activity. This procedure may be extended to other applications to
obtain more valuable bioactive constituents from macroalgae samples.
Received: 10 May 2021; Accepted: 9 July 2021
References
1. Tanna, B. & Mishra, A. Metabolites unravel nutraceutical potential of edible seaweeds: An emerging source of functional food.
Compr. Rev. Food Sci. Food Saf. 17, 1613–1624 (2018).
2. Olasehinde, T. A., Olaniran, A. O. & Okoh, A. I. Macroalgae as a valuable source of naturally occurring bioactive compounds for
the treatment of Alzheimer’s disease. Mar. Drugs 17, 609 (2019).
3. Barbosa, M., Valentão, P. & Andrade, P. B. Bioactive compounds from macroalgae in the new millennium: implications for neu-
rodegenerative diseases. Mar. Drugs 12, 4934–4972 (2014).
4. Øverland, M., Mydland, L. T. & Skrede, A. Marine macroalgae as sources of protein and bioactive compounds in feed for monogas-
tric animals. J. Sci. Food Agric. 99, 13–24 (2019).
5. Sansone, C. & Brunet, C. Marine Algal Antioxidants. Antioxidants (Basel) 9, 206 (2020).
6. Chan, C.-X., Ho, C.-L. & Phang, S.-M. Trends in seaweed research. Trends Plant Sci. 11, 165–166 (2006).
7. Tierney, M. S. et al. Enrichment of polyphenol contents and antioxidant activities of Irish brown macroalgae using food-friendly
techniques based on polarity and molecular size. Food Chem. 139, 753–761 (2013).
8. Prasedya, E. S. et al. Antioxidant activity of brown macroalgae Sargassum ethanol extract from Lombok coast, Indonesia. IOP
Conf. Ser. Earth Environ. Sci. 712, 012038 (2021).
9. Altemimi, A., Lakhssassi, N., Baharlouei, A., Watson, D. G. & Lightfoot, D. A. Phytochemicals: Extraction, isolation, and identi-
fication of bioactive compounds from plant extracts. Plants (Basel) 6, 42 (2017).
10. Sasidharan, S., Chen, Y., Saravanan, D., Sundram, K. M. & Yoga Latha, L. Extraction, isolation and characterization of bioactive
compounds from plants’ extracts. Afr. J. Tradit. Complement. Altern. Med. 8, 1–10 (2010).
11. Belscak-Cvitanović, A. et al. Physical properties and bioactive constituents of powdered mixtures and drinks prepared with cocoa
and various sweeteners. J. Agric. Food Chem. 58, 7187–7195 (2010).
12. Algaebase :: Listing the World’s Algae. https://www.algaebase.org/.
13. Ainsworth, E. A. & Gillespie, K. M. Estimation of total phenolic content and other oxidation substrates in plant tissues using
Folin-Ciocalteu reagent. Nat. Protoc. 2, 875–877 (2007).
14. Fahrurrozi. et al. Effect of small-scale box-fermentation on catechin and epicatechin content of lampung cocoa beans varieties.
Int. J. Adv. Sci. Eng. Inf. Technol. 11, 1029–1034 (2021).
15. Ben Mansour, R. et al. Assessment of antioxidant activity and neuroprotective capacity on PC12 cell line of Frankenia thymifolia
and related phenolic LC-MS/MS identification. Evid. Based Complement. Altern. Med. 2016, 1–8 (2016).
16. Nenadis, N., Wang, L.-F., Tsimidou, M. & Zhang, H.-Y. Estimation of scavenging activity of phenolic compounds using the ABTS·+
assay. J. Agric. Food Chem. 52, 4669–4674 (2004).
17. Chen, Y.-H., Tu, C.-J. & Wu, H.-T. Growth-inhibitory effects of the red alga Gelidium amansii on cultured cells. Biol. Pharm. Bull.
27, 180–184 (2004).
18. Mansoori, A. et al. Phytochemical characterization and assessment of crude extracts from Lantana camara L. for antioxidant and
antimicrobial activity. Front. Agron. 2, 582268 (2020).
19. Vuong, Q. V., Golding, J. B., Stathopoulos, C. E., Nguyen, M. H. & Roach, P. D. Optimizing conditions for the extraction of catechins
from green tea using hot water. J. Sep. Sci. 34, 3099–3106 (2011).
20. Makanjuola, S. A. Influence of particle size and extraction solvent on antioxidant properties of extracts of tea, ginger, and tea–ginger
blend. Food Sci. Nutr. 5, 1179–1185 (2017).
21. Montingelli, M. E., Benyounis, K. Y., Stokes, J. & Olabi, A. G. Pretreatment of macroalgal biomass for biogas production. Energy
Convers. Manage. 108, 202–209 (2016).
22. Crampon, C., Boutin, O. & Badens, E. Supercritical carbon dioxide extraction of molecules of interest from microalgae and sea-
weeds. Ind. Eng. Chem. Res. 50, 8941–8953 (2011).
23. Sheng, Z., Zhao, J., Muhammad, I. & Zhang, Y. Optimization of total phenolic content from Terminalia chebula Retz. fruits using
response surface methodology and evaluation of their antioxidant activities. PLoS ONE 13, e0202368 (2018).
24. Hu, J., Chen, Y. & Ni, D. Effect of superfine grinding on quality and antioxidant property of fine green tea powder. Lebensm Wiss
Technol. 45, 8–12 (2012).
25. Augusto-Obara, T. R. et al. Benefits of superfine grinding method on antioxidant and antifungal characteristic of Brazilian green
propolis extract. Sci. Agric. 76, 398–404 (2019).
26. Prakash Maran, J., Manikandan, S., Vigna Nivetha, C. & Dinesh, R. Ultrasound assisted extraction of bioactive compounds from
Nephelium lappaceum L. fruit peel using central composite face centered response surface design. Arab. J. Chem. 10, S1145–S1157
(2017).
27. Baek, S. H. et al. The comparison of total phenolics, total antioxidant, and anti-tyrosinase activities of Korean Sargassum species.
J. Food Qual. 2021, e6640789 (2021).
28. Lucas-González, R., Fernández-López, J., Pérez-Álvarez, J. Á. & Viuda-Martos, M. Effect of particle size on phytochemical com-
position and antioxidant properties of two persimmon flours from Diospyros kaki Thunb vars. ‘Rojo Brillante’ and ‘Triumph’
co-products. J. Sci. Food Agric. 98, 504–510 (2018).
29. Tchabo, W. et al. Impact of extraction parameters and their optimization on the nutraceuticals and antioxidant properties of aque-
ous extract mulberry leaf. Int. J. Food Prop. 21, 717–732 (2018).
30. Alsaud, N. & Farid, M. Insight into the influence of grinding on the extraction efficiency of selected bioactive compounds from
various plant leaves. Appl. Sci. 10, 6362 (2020).
31. Syed Jaapar, S. Z., Morad, N. A., Iwai, Y. & Nordin, M. F. M. Effects of processing parameters in the sonic assisted water extraction
(SAWE) of 6-gingerol. Ultrasonics Sonochem. 38, 62–74 (2017).
32. Yang, B., Liu, X. & Gao, Y. Extraction optimization of bioactive compounds (crocin, geniposide and total phenolic compounds)
from Gardenia (Gardenia jasminoides Ellis) fruits with response surface methodology. Innov. Food Sci. Emerg. Technol. 10, 610–615
(2009).
33. Martone, P. T. et al. Cellulose-rich secondary walls in wave-swept red macroalgae fortify flexible tissues. Planta 250, 1867–1879
(2019).
34. Machu, L. et al. Phenolic content and antioxidant capacity in algal food products. Molecules 20, 1118–1133 (2015).
35. Rodríguez-Bernaldo de Quirós, A., Lage-Yusty, M. A. & López-Hernández, J. Determination of phenolic compounds in macroalgae
for human consumption. Food Chem. 121, 634–638 (2010).
36. Yoshie, Y., Wang, W., Petillo, D. & Suzuki, T. Distribution of catechins in Japanese seaweeds. Fish. Sci. 66, 998–1000 (2000).
37. Savlak, N., Türker, B. & Yeşilkanat, N. Effects of particle size distribution on some physical, chemical and functional properties of
unripe banana flour. Food Chem. 213, 180–186 (2016).
Scientific Reports | (2021) 11:17876 | https://doi.org/10.1038/s41598-021-95769-y 8
Vol:.(1234567890)www.nature.com/scientificreports/
38. Brewer, L. R., Kubola, J., Siriamornpun, S., Herald, T. J. & Shi, Y.-C. Wheat bran particle size influence on phytochemical extract-
ability and antioxidant properties. Food Chem 152, 483–490 (2014).
39. Sójka, M., Kolodziejczyk, K. & Milala, J. Polyphenolic and basic chemical composition of black chokeberry industrial by-products.
Ind. Crops Prod. 51, 77–86 (2013).
40. Khorasani Esmaeili, A., Mat Taha, R., Mohajer, S. & Banisalam, B. Antioxidant activity and total phenolic and flavonoid content
of various solvent extracts from in vivo and in vitro grown Trifolium pratense L. (Red Clover). BioMed Res. Int. 2015, e643285
(2015).
41. Piluzza, G. & Bullitta, S. Correlations between phenolic content and antioxidant properties in twenty-four plant species of tradi-
tional ethnoveterinary use in the Mediterranean area. Pharm. Biol. 49, 240–247 (2011).
42. Turumtay, E. A. et al. Correlation between phenolic compounds and antioxidant activity of Anzer tea (Thymus praecox Opiz subsp.
caucasicus var. caucasicus). Ind. Crops Prod. 52, 687–694 (2014).
43. Ismail, M. M., Alotaibi, B. S. & El-Sheekh, M. M. Therapeutic uses of red macroalgae. Molecules 25, 4411 (2020).
44. Moubayed, N. M. S., Al Houri, H. J., Al Khulaifi, M. M. & Al Farraj, D. A. Antimicrobial, antioxidant properties and chemical
composition of seaweeds collected from Saudi Arabia (Red Sea and Arabian Gulf). Saudi J. Biol. Sci. 24, 162–169 (2017).
45. Gomez-Zavaglia, A., Prieto Lage, M. A., Jimenez-Lopez, C., Mejuto, J. C. & Simal-Gandara, J. The potential of seaweeds as a source
of functional ingredients of prebiotic and antioxidant value. Antioxidants (Basel) 8, 406 (2019).
46. Sanjeewa, K. K. A., Kim, E.-A., Son, K.-T. & Jeon, Y.-J. Bioactive properties and potentials cosmeceutical applications of phlorotan-
nins isolated from brown seaweeds: A review. J. Photochem. Photobiol. B 162, 100–105 (2016).
47. Maneesh, A., Chakraborty, K. & Makkar, F. Pharmacological activities of brown seaweed Sargassum wightii (Family Sargassaceae)
using different in vitro models. Int. J. Food Prop. 20, 931–945 (2017).
48. Lim, S. et al. Evaluation of antioxidant activities of various solvent extract from Sargassum serratifolium and its major antioxidant
components. Food Chem. 278, 178–184 (2019).
49. Lee, K. J., Oh, Y. C., Cho, W. K. & Ma, J. Y. Antioxidant and anti-inflammatory activity determination of one hundred kinds of
pure chemical compounds using offline and online screening HPLC assay. Evid.-Based Complement. Altern. Med. 2015, e165457
(2015).
50. Amdoun, R. et al. The desirability optimization methodology; a tool to predict two antagonist responses in biotechnological
systems: case of biomass growth and hyoscyamine content in elicited Datura starmonium hairy roots. Iran J. Biotechnol. 16, e1339
(2018).
Acknowledgements
We acknowledge the lab members of Bioscience and Biotechnology University of Mataram for assistance in the
macroalgae sample collection.
Author contributions
The funding of this research was granted to E.S.P. Hence, E.S.P. was responsible for the overall experiment design,
methodology, investigation, analysis also the manuscript preparation. A.F. provided High Resolution Mass Spec-
trometry (HRMS) data of the extracts. F.F. and A.B.J. provided the HPLC data analysis. A.S.A. contributed in the
collections of macroalgae samples. N.W.R.M., B.K.I., and H.P. helped with sample preparation and biochemical
assays, A.L.S. and S.W. assisted with interpretation of the results and manuscript proofreading.
Funding
This research is funded by the grant provided by the Kementerian Pendidikan, Kebudayaan, Riset dan Teknologi
scheme of Basic Research 2021.
Competing interests
The authors declare no competing interests.
Additional information
Correspondence and requests for materials should be addressed to A.L.S.
Reprints and permissions information is available at www.nature.com/reprints.
Publisher’s note Springer Nature remains neutral with regard to jurisdictional claims in published maps and
institutional affiliations.
Open Access This article is licensed under a Creative Commons Attribution 4.0 International
License, which permits use, sharing, adaptation, distribution and reproduction in any medium or
format, as long as you give appropriate credit to the original author(s) and the source, provide a link to the
Creative Commons licence, and indicate if changes were made. The images or other third party material in this
article are included in the article’s Creative Commons licence, unless indicated otherwise in a credit line to the
material. If material is not included in the article’s Creative Commons licence and your intended use is not
permitted by statutory regulation or exceeds the permitted use, you will need to obtain permission directly from
the copyright holder. To view a copy of this licence, visit http://creativecommons.org/licenses/by/4.0/.
© The Author(s) 2021
Scientific Reports | (2021) 11:17876 | https://doi.org/10.1038/s41598-021-95769-y 9
Vol.:(0123456789)You can also read