Effect of Shear Bands Induced by Asymmetric Rolling on Microstructure and Texture Evolution of Non-Oriented 3.3% Si Steel - MDPI
←
→
Page content transcription
If your browser does not render page correctly, please read the page content below
materials
Article
Effect of Shear Bands Induced by Asymmetric Rolling
on Microstructure and Texture Evolution of
Non-Oriented 3.3% Si Steel
Zhiyong Fang, Yanhui Guo *, Bin Fu *, Liqun Wei, Jun Chen, Linghuan Pang and Zemin Wang
 School of Materials Science and Engineering, Shanghai Institute of Technology, Shanghai 201418, China;
 186081104@mail.sit.edu.cn (Z.F.); weiliqun@sit.edu.cn (L.W.); 196082109@mail.sit.edu.cn (J.C.);
 plh9009@sit.edu.cn (L.P.); wzm@sit.edu.cn (Z.W.)
 * Correspondence: gyh415@sit.edu.cn (Y.G.); fubin@sit.edu.cn (B.F.)

 Received: 27 September 2020; Accepted: 19 October 2020; Published: 22 October 2020

 Abstract: In the present work, the microstructure and texture of non-oriented 3.3% Si steel processed
 by asymmetric rolling (ASR) and subsequent annealing at different temperatures were compared
 with those obtained when using traditional symmetric rolling (SR). This work aims to reveal the effect
 of shear bands introduced by the ASR on the microstructure and texture evolution. The ASR sample
 reaches a recrystallization fraction of 62% at an annealing temperature of 650 ◦ C, which is 32% higher
 than that of the SR sample annealed at the same temperature. This can be attributed to the abundant
 shear bands introduced by the ASR, which serve as the heterogeneous nucleation sites for the
 recrystallized grains. When increasing the annealing temperature to 750 ◦ C, complete recrystallization
 could be observed in both asymmetric- and symmetric-rolled samples. When using an annealing
 temperature of 650 ◦ C, the γ-oriented grains were dominant in the surface layer, while strong
 Goss-oriented grains could be observed in the center in the ASR sample. This is due to the fragmented
 small subgrains with different orientations in the surface layer inhibiting the nucleation of Goss- and
 cube-oriented grains during the annealing. In contrast, numerous Goss- and cube-oriented grains
 were formed in the surface layer after complete recrystallization when the ASR sample was annealed
 at a temperature of 750 ◦ C. This may be related to the higher thermal energy, which benefits the
 nucleation of the Goss- and cube-oriented grains. In addition, ASR significantly increased the strength
 of η-fiber after complete recrystallization when compared with SR. This work might be helpful to
 design the rolling and the subsequent annealing processes.

 Keywords: non-oriented silicon steel; asymmetric rolling; microstructure and texture; Goss;
 shear band

1. Introduction
     Non-oriented silicon steel has excellent magnetic properties and is widely used in industries [1–3].
Researchers aim for the continuous improvement of the magnetic properties of non-oriented silicon
steel. Generally, magnetic induction is mainly dependent on the texture, while the core loss,
the sum of hysteresis loss and the eddy current loss, are minimized at the optimum grain size.
Consequently, the recrystallization behavior during the annealing process can significantly affect the
magnetic properties of non-oriented silicon steel [4–8]. There are two common methods to improve
the magnetic properties of materials [9]. The first one is to fine-tune the alloy composition of the
material and introduce new precipitation particles to control the evolution of the texture during the
recrystallization process [10,11]. The other and currently most common method is to optimize the
microstructure and texture by processing technology, such as twin roll casting or rolling [12,13].

Materials 2020, 13, 4696; doi:10.3390/ma13214696                               www.mdpi.com/journal/materials
Materials 2020, 13, 4696                                                                            2 of 16

      Studies have shown that the recrystallized grains preferentially nucleate at the shear bands [8,14],
whose orientation directly controls the texture evolution during the recrystallization. Goss grains
are mainly nucleated in the deformed grains with the {111} , {111}  and {112}
orientations within the shear bands. The nucleation of new cube grains also takes place within shear
bands, but the density of nuclei is lower than that of Goss grains [15,16]. Therefore, shear bands
are closely related to these textures, which improve the magnetic properties of the material after
annealing. It has been reported that asymmetric rolling process (ASR) is an efficient way to introduce
shear deformation, which induces the formation of shear bands in the material, compared with the
conventional symmetric rolling (SR) [17,18].
      In ASR, the speeds of the two rollers are different, and hence strong shear deformation is formed
across the entire sheet thickness [19–21]. Logically, this shear deformation is asymmetrically distributed
in the material and differs from that imposed by conventional symmetric rolling (SR). Besides the
symmetry, the effective plastic strains reached by the ASR are larger than those obtained by the SR
at the same rolling reduction [22–26]. In recent years, many studies have been performed on ASR
of alloys and steel [22,27,28]. The researchers pointed out that ASR can produce more severe shear
deformation, which is beneficial to refine the recrystallized grains [23,29]. With respect to the magnetic
properties, silicon (Si) steel provides one example where the ASR can simultaneously increase the
magnetic induction and decrease the iron loss with a maximum amplitude of 0.011 T and 0.50 W/kg [21].
Silva et al. [30] also found that the ASR Si steel exhibits significantly enhanced magnetic properties
compared with the SR one under the same recrystallization condition. However, fewer studies have
been conducted on the effect of shear bands on the microstructure and texture evolution of non-oriented
silicon steel.
      For the present work, Si steel was asymmetrically and symmetrically rolled with subsequent
annealing at different temperatures. The optical microscope (OM) and the electron backscatter
diffraction (EBSD) were used to characterize the microstructure and texture of the samples. The main
proposal of this work is to understand the mechanism of the microstructure and texture evolution
during the annealing from the viewpoint of shear bands. The results of this work might be helpful to
design the rolling and subsequent annealing processes.

2. Experimental Procedure
      The as-received sheet has a thickness of 2 mm and a chemical composition of 0.006% C, 3.3%
Si, 0.2% Mn, 0.03% P and 0.006% S (in mass percent). The sheet was asymmetrically cold-rolled to
0.5 mm by 0.08 mm reduction per pass. The upper and lower rollers with the equivalent diameters of
180 mm had velocities of 13 turns/min and 10 turns/min, respectively. For comparison, the SR was also
performed with the same setup, and the roller speed was 10 turns/min. Samples were cut from the
asymmetrically and symmetrically rolled sheets to be used as references.
      The schematic illustration and the finite element analysis (FEA) of the ASR are presented in
Figure 1. The simulations were carried out by using the software MSC Marc. The setup of the FEA
speed ratio was equivalent to the real rolling, and the rolling reduction was set to 20%. The deformation
zone was the area between the entrance and the exit. The difference in rotational speed between upper
and lower rollers caused an asymmetric deformation of the sheet, as shown in Figure 1b, which stayed
in good agreement with [18]. Microscopically, the grid distortions were also asymmetric (see the
asymmetric deformed grids in Figure 1b). Due to the asymmetric deformation, the neutral point at the
upper interface deviated from that of the lower interface in the rolling direction (RD), as shown by
the yellow arrows in Figure 1b. This heterogeneously distributed shear deformation may lead to the
formation of shear bands comprising fine sub-grains [8].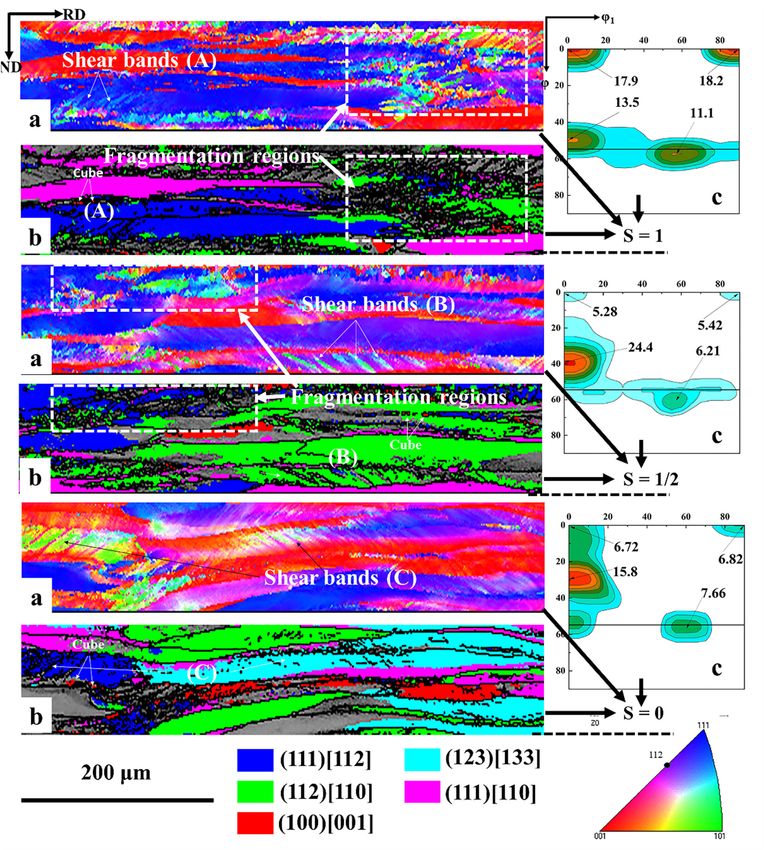
and S = 0 represents the center layer. The evolution of the main textures such as {001} , {112}
, {111} , {111} , {011}  (Goss) and {001}  (cube) were monitored. The first
four orientations are usually observed in the cold-rolled and annealed texture of steel. The last
orientation is preferred for the magnetic properties of non-oriented electrical steel because it has an
easy magnetization
Materials 2020, 13, 4696 direction of [100] in a plane parallel to the surface of the sheet [31,32]. 3 of 16

     Figure
      Figure 1.  Schematicillustration
             1. Schematic    illustrationand
                                           andthe
                                                thefinite
                                                     finiteelement
                                                             element   analysis
                                                                     analysis  of of
                                                                                  thethe asymmetric
                                                                                      asymmetric       rolling
                                                                                                    rolling    (ASR).
                                                                                                            (ASR).  (a)
     (a) Schematic
      Schematic   of of
                     ASRASR  deformationzone.
                           deformation      zone.(b)(b)Distortions
                                                        Distortionsofofrectangular
                                                                         rectangulargrids
                                                                                       grids predicted
                                                                                             predicted by the finite
                                                                                                                 finite
     element   analysis (FEA).
      element analysis   (FEA).The
                                 Thearrows
                                       arrowsindicate
                                               indicate thethe  locations
                                                             locations     of the
                                                                       of the      neutral
                                                                              neutral  pointpoint
                                                                                             at theatupper
                                                                                                      the upper   and
                                                                                                            and lower
     lower  surfaces.
      surfaces.

       The cold-rolled steel strips were annealed in a box electric furnace in temperature range from 600 to
 3. Results
850 ◦ C with interval of 50 ◦ C for 5 min. After annealing, samples were cut from the sheets and manually
polished    and etched with 4% nital solution (96% alcohol + 4% nitric acid). Then, the microstructures
 3.1. Microstructure
were observed using an OM. Note that the observed plane was the cross-section between the RD
and
 3.1.1.normal  directionafter
         Microstructure  (ND).   The recrystallized
                               Rolling              fractions and the grain size were determined by the
                                       without Annealing
software Image J. The EBSD analysis was performed on the cross-sections, which covered the entire
        Figure 2 presents the optical microstructure of the RD–ND plane covering the entire thickness
thickness of the sheets. The measurement data from EBSD were processed by orientation imaging
 of the sheets directly after rolling (without annealing). Obviously, two different deformation areas,
microscopy (OIM) and channel 5 analysis software to obtain data such as the recrystallization fraction,
 which are denoted as regions A and B in Figure 2a and regions C and D in Figure 2b, can be observed.
the entire thickness orientation distribution function (ODF) figures and the ODF figures of different
 The degree of etching has a significant relationship with the energy it contains [15,16]. The regions A
layers. Here, a parameter S, which is defined as S = 2 d/t, where t and d are the thickness and the
 and C have high energy, which is related to the rich defects such as shear bands or dislocations that
distance from the measuring layer to the center layer, respectively, is used to denote the observed
 they contain, and are easy to etch, resulting in the dark area in the OM image. In contrast, the regions
layers. Accordingly, S = 1 represents the near surface layer with the upper roller, and S = 0 represents
 B and D contain low energy and are relatively difficult to etch, so the area appears bright. The
the center layer. The evolution of the main textures such as {001} , {112} , {111} ,
{111} , {011}  (Goss) and {001}  (cube) were monitored. The first four orientations are
usually observed in the cold-rolled and annealed texture of steel. The last orientation is preferred for
the magnetic properties of non-oriented electrical steel because it has an easy magnetization direction
of [100] in a plane parallel to the surface of the sheet [31,32].
Materials 2020, 13, 4696                                                                                    4 of 16

3. Results

3.1. Microstructure

3.1.1. Microstructure after Rolling without Annealing
     Figure 2 presents the optical microstructure of the RD–ND plane covering the entire thickness
of the sheets directly after rolling (without annealing). Obviously, two different deformation areas,
which are denoted as regions A and B in Figure 2a and regions C and D in Figure 2b, can be observed.
The degree of etching has a significant relationship with the energy it contains [15,16]. The regions A
and C have high energy, which is related to the rich defects such as shear bands or dislocations that they
  Materials 2020, 13, x FOR PEER REVIEW                                                                4 of 15
contain, and are easy to etch, resulting in the dark area in the OM image. In contrast, the regions B and
D contain low energy and are relatively difficult to etch, so the area appears bright. The distributions of
  distributions of the two types of deformation areas are different in the SR and ASR samples. In the
the two types of deformation areas are different in the SR and ASR samples. In the ASR sample, the dark
  ASR sample, the dark etching area is more homogeneously distributed along the ND direction.
etching area is more homogeneously distributed along the ND direction. Furthermore, more shear
  Furthermore, more shear bands, which are indicated by the arrows, can be observed in the ASR
bands, which are indicated by the arrows, can be observed in the ASR sample. Note that the shear
  sample. Note that the shear bands in the ASR sample exhibit different orientation compared with
bands in the ASR sample exhibit different orientation compared with those in the SR sample. The shear
  those in the SR sample. The shear bands in the ASR sample have a larger inclination angle around
bands in the ASR sample have a larger inclination angle around 40◦ with the RD, while the inclination
  40° with the RD, while the inclination angle between the shear bands and RD in the SR sample
angle between the shear bands and RD in the SR sample amounts to an approximate value of 30◦ .
  amounts to an approximate value of 30°. This observation is in accordance with the results of [33].
This observation is in accordance with the results of [33].

      Figure    Optical
             2. 2.
        Figure           microstructure
                   Optical               ofof
                            microstructure  sample processed
                                              sample         byby
                                                     processed  (a)(a)
                                                                    SRSR
                                                                       and (b)(b)
                                                                         and    ASR. The
                                                                                  ASR.   arrows
                                                                                       The      indicate
                                                                                           arrows        thethe
                                                                                                  indicate
      shear bands   in the samples.
        shear bands in the samples.

3.1.2. Microstructure after Annealing
   3.1.2. Microstructure after Annealing
       Figure 3 shows the optical microstructure covering the entire thickness of the sheets after annealing.
         Figure 3 shows the optical microstructure covering the entire thickness of the sheets after
After annealing at 600 ◦ C, no recrystallization nuclei are generated in either the ASR or SR samples,
   annealing. After annealing at 600 °C, no recrystallization nuclei are generated in either the ASR or SR
indicating that the samples might be still in the recovery stage. Upon increasing the annealing
   samples, indicating that the samples might be still in the recovery stage. Upon increasing the
temperature, nucleation and subsequent growth of the recrystallized grains can be clearly observed.
   annealing temperature, nucleation and subsequent growth of the recrystallized grains can be clearly
It should be mentioned that the size of the recrystallized grains increases and the grain size distribution
   observed. It should be mentioned that the size of the recrystallized grains increases and the grain size
gradually becomes uniform with temperature increase. Quantitatively, the average grain size increases
   distribution gradually becomes uniform with temperature increase. Quantitatively, the average grain
from 31.4 µm (20.5 µm) at 750 ◦ C to 60.4 µm (62.5 µm) at 850 ◦ C for the ASR (SR) sample. The mean
   size increases from 31.4 μm (20.5 μm) at 750 °C to 60.4 μm (62.5 μm) at 850 °C for the ASR (SR) sample.
square deviation of the ASR sample at 850 ◦ C amounts to 16.6 µm, which is lower than that of the SR
   The mean square deviation of the ASR sample at 850 °C amounts to 16.6 μm, which is lower than that
sample (23.5 µm), indicating a more uniform grain size distribution in the ASR sample. Note that the
   of ◦the SR sample (23.5 μm), indicating a more uniform grain size distribution in the ASR sample.
750 C is the temperature at which a complete recrystallization is achieved in both samples.
   Note that the 750 °C is the temperature at which a complete recrystallization is achieved in both
   samples.
         Figure 4 represents the recrystallization fraction as a function of the annealing temperature. At
   an annealing temperature of 650 °C, the ASR sample exhibits a recrystallization fraction of 62%, which
   is significantly higher than that of the SR sample with a fraction of 30%. Both in the ASR and SR
   samples, the recrystallization fraction increases with the annealing temperature increasing. In
   addition, at higher temperatures, the rate of increase of the recrystallization fraction decreases in the
   ASR sample, while the SR sample shows a relatively constant rate (see the slopes of the ASR and SR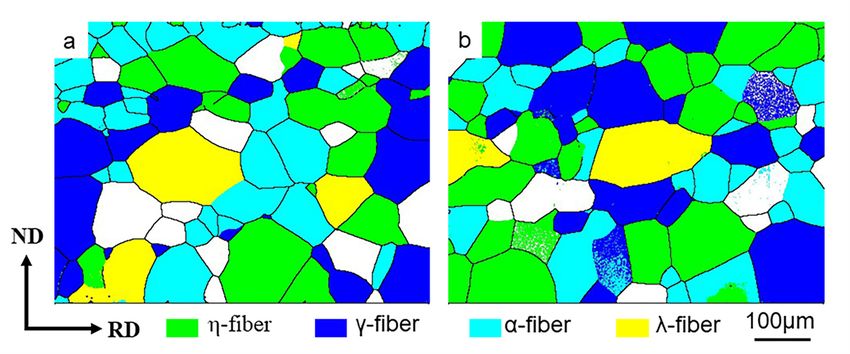
Materials 2020, 13, 4696                                                                                    5 of 16
Materials 2020, 13, x FOR PEER REVIEW                                                                       5 of 15

      Figure3.3.Optical
     Figure      Optical   microstructure
                        microstructure      of samples
                                       of samples       annealed
                                                  annealed          at different
                                                           at different annealingannealing temperatures.
                                                                                  temperatures.           (a)
                                                                                                (a) Symmetric
      Symmetric
     rolling (SR);rolling (SR); (b) ASR.
                   (b) ASR.

     Figure 4 represents the recrystallization fraction as a function of the annealing temperature.
At an annealing temperature of 650 ◦ C, the ASR sample exhibits a recrystallization fraction of 62%,
which is significantly higher than that of the SR sample with a fraction of 30%. Both in the ASR
and SR samples, the recrystallization fraction increases with the annealing temperature increasing.
In addition, at higher temperatures, the rate of increase of the recrystallization fraction decreases in
the ASR sample, while the SR sample shows a relatively constant rate (see the slopes of the ASR
and SR curves in Figure 4). Furthermore, it is well known that a longer annealing time is beneficial
to the recrystallization, i.e., the longer the annealing time, the higher the recrystallization fraction.
However, here we mainly focus on the temperature effect rather than the time effect.

     Figure 4. Recrystallized fraction as a function of annealing temperature. The black line is
     approximated to the nucleation speed at a specific recrystallization temperature.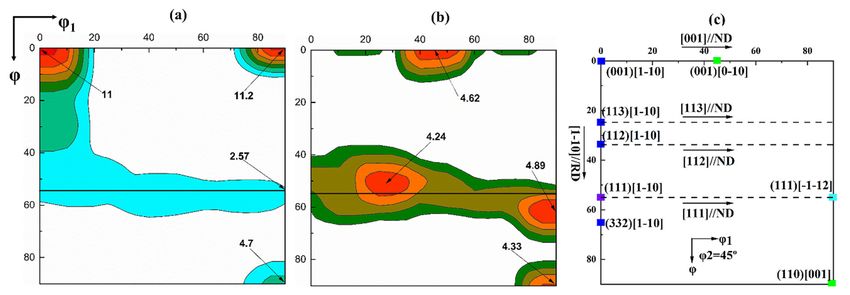
Figure 3. Optical microstructure of samples annealed at different annealing temperatures. (a)
Materials 2020, 13, 4696 6 of 16
Symmetric rolling (SR); (b) ASR.
Materials 2020, 13, x FOR PEER REVIEW 6 of 15
Figure4.4.Recrystallized
Figure fraction
Recrystallized as a function
fraction of annealing
as a function temperature.
of annealing The black line
temperature. Theis approximated
black line is
to the nucleation
3.2. Texture
approximated to speed at a specific
the nucleation recrystallization
speed temperature. temperature.
at a specific recrystallization
3.2. Texture
3.2.1. Texture after Rolling without Annealing
3.2.1.Figure
Texture after Rolling
5 shows the ODF without
figures Annealing
of the entire thickness after the ASR and SR. After the SR, the
textures
Figureshow a strong
5 shows the ODFα-fiber (//RD)
figures with thickness
of the entire a peak atafter {112}the
ASR andand SR. relatively
After the weak
SR,
λ- (//ND) and γ-fibers (//ND). However, after the ASR,
the textures show a strong α-fiber (//RD) with a peak at {112} and relatively weak the λ- and γ-fibers become
significantly
λ- (//ND) stronger, and the {112}
and γ-fibers component
(//ND). However, is still
afterstrongest,
the ASR,but theweaker
λ- andthan that ofbecome
γ-fibers the SR
sample. Previous
significantly studies
stronger, andhave found
the {112} that component
the shear bandsis stillconsisting
strongest,ofbut strong
weaker{111}
than
thatand {111}
of the SR
-oriented grains are preferential nucleation sites for Goss texture
sample. Previous studies have found that the shear bands consisting of strong {111} and {111} during recrystallization
[14,15,34]. Therefore,
-oriented grainsASR is expectednucleation
are preferential to produce a stronger
sites for GossGoss texturetexture
during during recrystallization.
recrystallization To
[14,15,34].
further study the effect of asymmetric rolling on the texture along the
Therefore, ASR is expected to produce a stronger Goss texture during recrystallization. To furtherthickness of the sample, the
orientation
study the effectdistribution function
of asymmetric (ODF)
rolling figures
on the of different
texture along thelayers are of
thickness also
thecompared,
sample, theasorientation
shown in
Figure 6. After
distribution the ASR,
function (ODF)thefigures
strongest {001}
of different layersand
arethe
alsosecond
compared,strongest γ-fiber
as shown with orientations
in Figure 6. After the
ASR, the strongest {001} and the second strongest γ-fiber with orientations such as of
such as {111} develop at the surface. However, in the other layers, the strength the
{111} {112}
orientation is significantly enhanced, and the strengths of the {001}
develop at the surface. However, in the other layers, the strength of the {112} orientation is and {111}
orientations dramatically
significantly enhanced, andweaken. As a whole,
the strengths the texture
of the {001} and components
{111} of orientations
the center layer and the
dramatically
weaken. As a whole, the texture components of the center layer and the subsurface layer are surface
subsurface layer are similar. However, the texture of the center layer differs from that of the similar.
in that a strong γ-fiber texture appears at the surface layer, while it is relatively
However, the texture of the center layer differs from that of the surface in that a strong γ-fiber texture weak in the center
layer.
appears at the surface layer, while it is relatively weak in the center layer.
5. The
Figure 5.
Figure The ϕφ22 == 45°
45◦ section
section of
of the
the orientation
orientation distribution
distribution function
function (ODF)
(ODF) obtained
obtained from
from electron
electron
backscatter diffraction
backscatter diffraction (EBSD)
(EBSD) after
after cold
cold rolling.
rolling. (a)
(a) SR;
SR; (b)
(b) ASR;
ASR; (c)
(c) typical
typical texture
texture components and
components and
orientation rotation path displayed in the ϕ2 = 45◦ section of the ODF.
orientation rotation path displayed in the φ2 = 45° section of the ODF.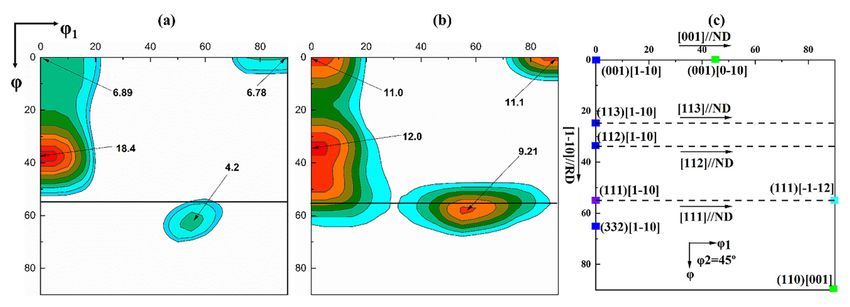
Figure 5. The φ2 = 45° section of the orientation distribution function (ODF) obtained from electron
backscatter diffraction (EBSD) after cold rolling. (a) SR; (b) ASR; (c) typical texture components and
Materials 2020, 13, 4696 7 of 16
orientation rotation path displayed in the φ2 = 45° section of the ODF.
Materials 2020, 13, x FOR PEER REVIEW 7 of 15
Figure 6. ϕ2 = 45 sections of the ODF at different layers in the ASR cold-rolled sample.
◦
Figure 6. φ2 = 45° sections of the ODF at different layers in the ASR cold-rolled sample.
3.2.2. Texture during
during Recrystallization
Recrystallization
ODF images of the entire thickness of the samples after annealing at 650 and 750 ◦°C C (ASR) are
demonstrated in in Figure 7. Partial recrystallization occurs at an annealing temperature650
Figure 7. Partial recrystallization occurs at an annealing temperature of of °C.
650The◦ C.
γ-fiber
The (mainly
γ-fiber {111}{111}
(mainly
and {111} )
and {111} )
is reduced, whilewhile
is reduced, the Goss texture
the Goss is enhanced.
texture The
is enhanced.
strength
The of {001}
strength of {001}
orientation
orientation does notnot
does change.
change. Regarding
Regardingthetheprevious
previousresearch
research results
results [15,31]
and the data from this study, study, itit is
is suggested
suggested thatthat Goss-oriented
Goss-oriented grains
grains nucleate within the γ-fiber
grains or at the grain boundaries. The Goss-oriented grains grow by consuming the γ-fiber-oriented γ-fiber-oriented
grains. The strengths
The strengths of of the {001} -oriented grains of the ASR samples do
-oriented grains of the ASR samples do not change after
annealing at a temperature of 650 °C ◦ C (see Figures 5b and 7a), indicating
indicating these
these grains
grains are
are stable.
stable.
annealing temperature
Increasing the annealing temperature to 750 ◦°C,
to 750 the grains
C, the grains with
with the {100}
the {100} orientation are
exhausted (see Figure 7a,b). At At thethe same
same time, the cube orientation
orientation appears
appears in the ODF, while the
strength ofof the
the Goss
Goss orientation
orientation does
does not not significantly
significantly change,
change, as
as shown
shown in inFigure
Figure7b.
7b.
Figure 7. The φ ϕ22 ==45°
45◦section
sectionofofthe
theODF
ODFobtained
obtainedfrom
fromEBSD
EBSD after
after annealing
annealing (ASR). (a) Annealing at
◦
650 °C; ◦
C; (b) annealing at 750 °C; C; (c)
(c) typical
typical texture
texture components
components and orientation rotation path displayed
in
in the φ2 ==45°
the ϕ 45◦section
sectionofofthe
theODF.
ODF.
Figure
Figure 88 shows
showsthetheODF
ODFofofdifferent
differentlayers
layersininthetheASR
ASR sample
sample after annealing.
after annealing. After
Afterannealing
annealingat
650 ◦ C, the surface of the sample shows a strong γ-fiber, as shown in the third subfigure (from left to
at 650 °C, the surface of the sample shows a strong γ-fiber, as shown in the third subfigure (from left
right) in in
to right) Figure
Figure8a.8a.
InInthe
thesubsurface
subsurface layer,
layer,thethe {112}
{112} component
componentisis completely
completely consumed
consumed as as
aa result of the cold rolling (see the second subfigures in Figures 6 and 8a), but a
result of the cold rolling (see the second subfigures in Figures 6 and 8a), but a strong {001} strong {001}
component,
component, aa relatively
relatively weak γ-fiber and
weak γ-fiber and Goss
Goss texture
texture are
are available.
available. In In contrast,
contrast, in
in the
the center
center layer,
layer,
the α-fiber produced by the cold rolling is relatively stable, and this texture
the α-fiber produced by the cold rolling is relatively stable, and this texture is almost completelyis almost completely
retained,
retained, as asshown
shownininthethefirst
firstsubfigure
subfigureininFigure
Figure 8a.8a.
Comparing
Comparing thethe
first subfigure
first subfigurein Figure 6 and
in Figure the
6 and
first subfigure in Figure 8a, it can be observed that the γ-fiber is almost completely
the first subfigure in Figure 8a, it can be observed that the γ-fiber is almost completely consumed, consumed, while the
Goss ◦
whiletexture
the Goss strength
textureisstrength
significantly enhanced. enhanced.
is significantly When the temperature is raised to is
When the temperature 750 C, the
raised to surface
750 °C,
the surface is dominated by η-fiber ({100} and {110} ) texture, as shown in the third
subfigure in Figure 8b. The subsurface layer is mainly dominated by γ- and λ-fibers (see the second
subfigure in Figure 8b).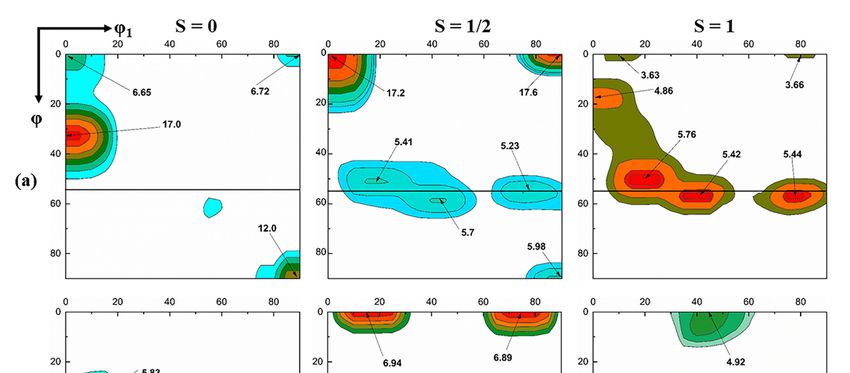
Materials 2020, 13, 4696                                                                                            8 of 16

is dominated by η-fiber ({100}  and {110} ) texture, as shown in the third subfigure in
Figure 8b. The subsurface layer is mainly dominated by γ- and λ-fibers (see the second subfigure in
 Materials 2020, 13, x FOR PEER REVIEW                                                        8 of 15
Figure 8b).

      Figure 8. ϕ2 = 45◦ sections of the ODF at different layers after annealing (ASR). (a) Annealing at 650 ◦ C;
       Figure
      (b):     8. φ2 = at
           annealing   45°750
                           sections
                              ◦ C.  of the ODF at different layers after annealing (ASR). (a) Annealing at 650
       °C; (b): annealing at 750 °C.
3.2.3. Texture Comparison after Complete Recrystallization
 3.2.3. Texture Comparison after Complete Recrystallization
       Figure 9 shows the texture distribution of the entire thickness of the SR and ASR samples after
       Figure
annealing    at 9850 ◦ C. Figure
                  shows    the texture  distribution
                                  10 compares           of the entire
                                                 the volume           thickness
                                                               fraction            of the texture
                                                                         of four typical   SR and fibers
                                                                                                    ASR samples
                                                                                                            measured after
                                                                                                                        by
 annealing
channel       at 850 °C.
          5 analysis       Figurefor
                        software   10 the
                                      compares
                                          SR andthe ASR volume   fraction
                                                          samples,   with aofmaximum
                                                                               four typical   texture of
                                                                                           deviation   fibers◦  measured
                                                                                                          20 from    each
 by channel
ideal          5 analysis
       orientation.         software
                      The η-fiber      for the
                                   fraction  in SR
                                                theand    ASR samples,
                                                     SR sample   amountswith     a maximum
                                                                             to 24.5%,  while indeviation     of 20° from
                                                                                                  the ASR sample      it is
 each ideal
33.4%.         orientation.
          Meanwhile,          The η-fiber
                          the γ-fiber       fraction
                                      fraction   in theinASR
                                                           the sample
                                                               SR sample      amounts
                                                                        is 6.2%  lower to    24.5%,
                                                                                          than  that while
                                                                                                     in the inSRthe   ASR
                                                                                                                  sample.
Itsample
    can beitconcluded
             is 33.4%. Meanwhile,
                         that the ASRthecanγ-fiber
                                             increase fraction in theof
                                                        the strength  ASR     sample
                                                                         η-fibers,     is 6.2%
                                                                                    which       lower than
                                                                                            is beneficial      that in the
                                                                                                           in improving
 SR sample.
the   magneticItproperties
                  can be concluded     that the ASR
                              of non-oriented           can increase the strength of η-fibers, which is beneficial
                                                  Si steel.
 in improving the magnetic properties of non-oriented Si steel.

      Figure 9. Four typical textures in symmetric-rolled (a) and asymmetric-rolled samples (b) after
      annealing at 850 °C.
by channel 5 analysis software for the SR and ASR samples, with a maximum deviation of 20° from
each ideal orientation. The η-fiber fraction in the SR sample amounts to 24.5%, while in the ASR
sample it is 33.4%. Meanwhile, the γ-fiber fraction in the ASR sample is 6.2% lower than that in the
SR sample. It can be concluded that the ASR can increase the strength of η-fibers, which is beneficial
Materials 2020, 13, the
in improving        4696magnetic properties of non-oriented Si steel.                          9 of 16

     Figure 9. Four typical textures in symmetric-rolled (a) and asymmetric-rolled samples (b) after
      Figure2020,
    Materials 9. Four    typical textures in symmetric-rolled (a) and asymmetric-rolled samples (b) after
     annealing  at 13,
                   850x ◦FOR
                          C. PEER REVIEW                                                                         9 of 15
      annealing at 850 °C.

     Figure 10. Comparison of four typical texture components after annealing at 850 ◦ C for SR and
     ASR samples.

4. Discussion
          Figure 10. Comparison of four typical texture components after annealing at 850 °C for SR and ASR
4.1. Effectsamples.
            of Rolling Mode on the Microstructure after Rolling and Annealing
     Compared with the SR, ASR will induce additional shear stress, which will cause the steel
    4. Discussion
sheets to undergo more severe shear deformation [31]. Currently, although the fundamental theory
regarding the formation of shear bands is still under debate, it can be generally accepted that shear
band4.1.
      is Effect
         caused of Rolling
                   by shearMode   on the Microstructure
                             deformation     on specific after
                                                         shear Rolling  and whether
                                                                 systems,   Annealingit is crystallographic [32]
or non-crystallographic
          Compared with [35].the SR,InASR
                                       this will
                                            context, ASR
                                                 induce     can produce
                                                        additional   shear more
                                                                            stress,shear
                                                                                    whichbands   compared
                                                                                           will cause         with
                                                                                                       the steel  sheets
SR [29,30].  At themore
    to undergo      same time,
                           severeit has beendeformation
                                     shear    confirmed that   theCurrently,
                                                           [31].   difference in etching degree
                                                                               although           is related to the
                                                                                           the fundamental       theory
    regarding the formation of shear bands is still under debate, it can be generally accepted that shear
    band is caused by shear deformation on specific shear systems, whether it is crystallographic [32] or
    non-crystallographic [35]. In this context, ASR can produce more shear bands compared with SR
    [29,30]. At the same time, it has been confirmed that the difference in etching degree is related to the
    stored energy of the deformation bands after cold rolling [15]. The higher the stored energy, the easier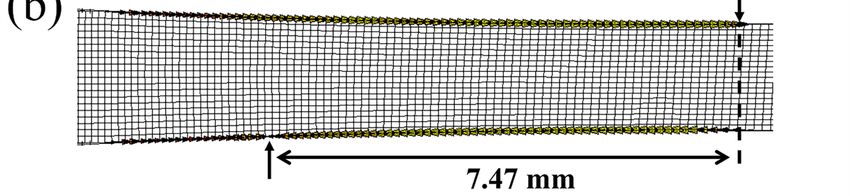
Materials 2020, 13, 4696                                                                          10 of 16

stored energy of the deformation bands after cold rolling [15]. The higher the stored energy, the easier
the etching. Therefore, we can observe that the shear bands tend to distribute at the surface and
subsurface of the steel sheets after symmetric rolling, such as region A in Figure 2, while they are also
available in the center layer after ASR, such as region C in Figure 2. It is well known that shear bands
can provide more nucleation positions for new crystallized grains [15,36,37]. Thus, when the annealing
temperature is 650 ◦ C, numerous nucleation positions are preferentially provided in the ASR sample
containing more shear bands rather than the SR sample, where the bright-etched elongated grains with
lower stored energy retain. Therefore, the recrystallization fraction increase rate of the ASR sample is
much higher than that of the SR sample after annealing at 650 ◦ C, as shown in Figure 4. At higher
temperatures, the increase of recrystallization fraction decelerates in the ASR sample, while in the
SR sample, this rate roughly remains as a constant. This may be related to the lower driving force
(P) of the bright-etched regions of the ASR sample. In physical metallurgy, the migration velocity (V)
of a moving interface is generally considered to be the product of mobility (M) and driving force (P),
i.e., V = M·P [38]. Because the driving force (P) of the remaining bright-etching region of the ASR
sample is low, a larger mobility (M) is needed to achieve the migration speed of the mobile interface.
Note that the mobility (M) is exponentially dependent of the temperature. In addition, Figure 11
shows the microstructure and texture of asymmetric-rolled sample after annealing at 650 ◦ C. We find
that the deformation zones without nucleation are mainly {100} - and {112} -orientated.
It has been shown that the {100}  and {112}  orientations have the lowest storage energy
during the texture evolution [15]. More energy is necessary to activate the nucleation in these zones,
corresponding to the complete recrystallization at a higher annealing temperature of 750 ◦ C. Here it is
worth mentioning that in the SR sample, the recrystallization fraction curve in Figure 4 shows relative
uniform slope, i.e., the recrystallization fraction equably increases with the increase of annealing
temperature. This is due to the fact that the {100}  and {112}  orientations with low storage
energy are absent in the SR samples.
Materials 2020, 13, x FOR PEER REVIEW 10 of 15
with the2020,
Materials increase
13, 4696of annealing temperature. This is due to the fact that the {100} and {112}11
of 16
orientations with low storage energy are absent in the SR samples.
Microstructure ◦ C.
Figure 11.Microstructure
Figure 11. andand texture
texture of asymmetric-rolled
of asymmetric-rolled sample
sample after annealing
after annealing at(a)
at 650 °C. 650EBSD
(a) EBSDpole
inverse inverse pole
figure figure
map; map; (b)
(b) image image
quality quality
map mapGoss
showing showing Goss crystals
and cube and cube crystals
within thewithin the
deformed
deformed
matrix. matrix.
4.2. Analysis of Texture Evolution after Asymmetric Rolling and Annealing
4.2. Analysis of Texture Evolution after Asymmetric Rolling and Annealing
Figure 12 shows the microstructure and texture at different layers (mainly including S = 0,
S = 1/2Figure
and S12=shows theafter
1 layers) microstructure
the ASR. EBSD and texture at different
measurements layers
confirm (mainly
that including
the {111} andS = 0, S=
{100}
1/2 and S = 1 layers)
-oriented after bands
deformation the ASR. EBSD decrease
gradually measurements
and the confirm that the {111}
{112} -oriented andbands
deformation {100}
-oriented deformation bands gradually decrease and the {112} -oriented
gradually increase from the surface to the center layer. This may be related to the stability of the crystaldeformation
bands gradually
orientation and theincrease from on
shear stress thethe
surface to the
material center
during layer.[34].
rolling ThisInmay be related
addition, Park toandthe stability
Szpunar of
[15]
the crystal stored
calculated orientation
energyandforthe
theshear stress
α-fiber andon the material
γ-fiber duringinrolling
components [34]. In
cold rolled addition, Park
polycrystalline and
steels
Szpunar [15] calculated stored energy for the α-fiber and γ-fiber components
and claimed that the stored energy introduced into the deformed specimens is in increasing order for in cold rolled
polycrystalline
the {100} ,steels
{112}and claimed
, {111}that the and
stored energy
{111} introduced into the
orientations. Thisdeformed
means that specimens
deformed is
in increasing order for the {100} , {112} , {111} and {111}
{111} and {111} grains should be consumed first and deformed {100} and {112} orientations. This
means grains
that deformed
should be {111}
last,
eitherand
by {111}
nuclei
or bygrains should be consumed
the recrystallized first and
grains, which havedeformed
already
nucleated. This corresponds to our finding that the {111} and {111} orientation strengthsMaterials 2020, 13, 4696 12 of 16
are significantly reduced, while the {100} orientation strength remains almost unchanged
after annealing at 650 ◦ C, as shown in Figure 7a. In addition, since the recrystallization nucleation
preferentially occurs at the shear bands, the orientation of the deformed matrix around the shear
bands has a great influence on the orientation of the recrystallized grains. Figure 12 shows that
the orientations of the shear bands and the surrounding deformation matrix are very different at
different layers. The matrix orientation is {111} at the surface, {112} at the subsurface
and {111} and {123} at the center layer. This may be related to the evolution path
of grain orientation during cold rolling [39,40]. Related studies have shown that the shear bands
embedded in the {112} -oriented deformation matrix mainly provide the nucleation position for
the cube- and Goss-oriented recrystallization grains [15], and the shear bands embedded in the {111}
- and {111} -oriented deformation matrixes are the preferential nucleation positions of
the Goss-oriented recrystallization grains [14,15,40–42]. Therefore, the center layer has obvious Goss
orientation after annealing at 650 ◦ C, as shown in Figure 11b. However, few Goss-oriented grains are
observed at the surface, as shown in Figure 11b, although orientation of the deformed matrix around
the shear bands at the surface is {111} . This may be related to the fragmentation phenomenon
after cold rolling. Figure 12 shows that the ASR produces severe fragmentation at the surface and
subsurface of the sample, while the center layer is relatively bright. The broken small subgrains with
different orientations can serve as the core of nucleation during annealing. Therefore, they have the
ability to compete with new Goss- and cube-oriented grains. As a result, the growth of Goss- and
cube-oriented grains is inhibited to a certain extent at lower annealing temperature. With the increase
of annealing temperature, the inhibited Goss- and cube-oriented grains have sufficient energy to grow
by swallowing the γ-fiber-oriented grains. Until 750 ◦ C, the γ-fiber-oriented grains at the surface of the
sample are almost consumed. Thus, the surface layer of the sample shows a strong η-fiber texture after
complete recrystallization, as shown in Figure 8b. However, after annealing at 750 ◦ C, the strength of
the γ-fiber texture in the center layer significantly increases, as shown in Figure 8b, staying in good
agreement with the literature [4,43]. Studies have shown that at higher temperature, {111} - and
{111} -oriented grains easily form large-angle grain boundaries that have a high migration rate
with neighboring oriented grains. Then, the large-angle grain boundaries can swallow the surrounding
deformed grains (lower energy α-fiber-oriented grains), thereby significantly enhancing the strength
of the γ-fiber texture.Materials 2020, 13, 4696 13 of 16
Materials 2020, 13, x FOR PEER REVIEW 12 of 15
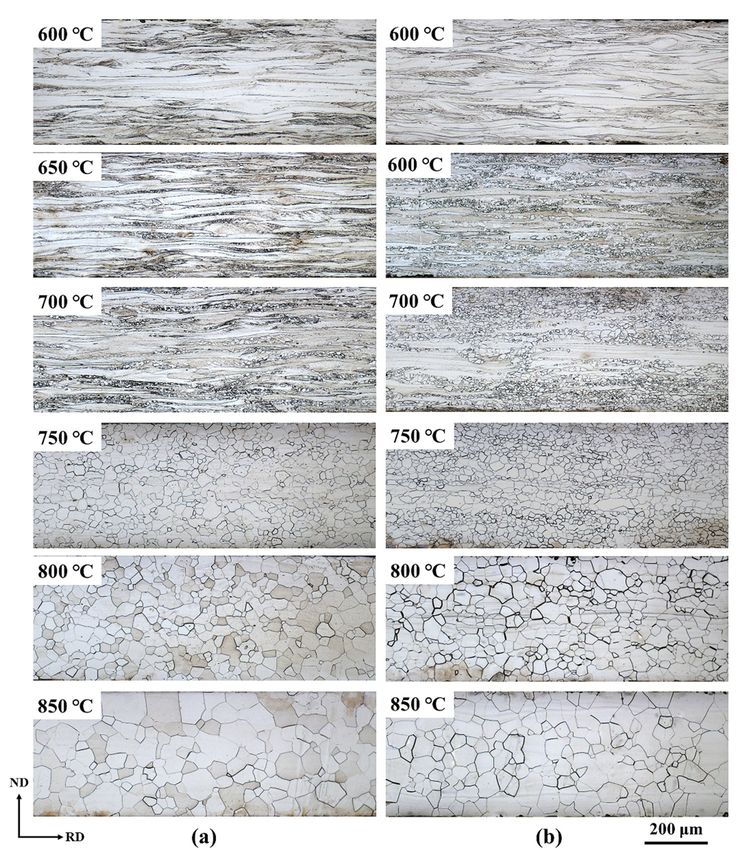
Figure
Figure12.12. Microstructure and texture
Microstructure and textureafter
afterasymmetric
asymmetricrolling.
rolling.(a)(a) EBSD
EBSD inverse
inverse pole
pole figure
figure map;
map; (b)
(b) image
image quality
quality mapmap showing
showing orientation
orientation within
within thethe deformed
deformed matrix
matrix andand shear
shear bands;
bands; (c) (c) texture
texture (φ2
(ϕ = 45
= 245°
◦ section, Bunge notation.
section, Bunge notation.
5. Conclusions
5. Conclusions
In the present work, evolution of the microstructure and texture of non-oriented 3.3% Si steel after
In the present work, evolution of the microstructure and texture of non-oriented 3.3% Si steel
ASR and SR with/without subsequent annealing have been investigated and compared. The conclusions
after ASR and SR with/without subsequent annealing have been investigated and compared. The
drawn from the results can be summarized as follows:
conclusions drawn from the results can be summarized as follows:
(1) Compared with the SR sample, the shear bands in the ASR sample are more abundant. The shear
(1) Compared with the SR sample, the shear bands in the ASR sample are more abundant. The shear
bands have a larger inclination angle with the RD, generally around 40◦ . In addition, the surface
bands have a larger inclination angle with the RD, generally around 40°. In addition, the surface
and sub-surface layers of the ASR sample have obvious grain fragmentation.
and sub-surface layers of the ASR sample have obvious grain fragmentation.
(2) ◦ C, the recrystallization fraction of the ASR sample reaches 62%, which is
(2) After annealing
After annealing atat 650
650 °C, the recrystallization fraction of the ASR sample reaches 62%, which is
significantly
significantly higher
higher than
than that
that of
of the
the SR
SR sample
sample(30%).
(30%). Moreover,
Moreover,whenwhenincreasing
increasingthe
theannealing
annealing
temperature, the rate of increase of the recrystallization fraction decreases.
temperature, the rate of increase of the recrystallization fraction decreases.
(3)
(3) Compared
Compared withwiththe theSR,SR,
thethe
ASRASR only only changes
changes the strength
the strength of thecomponents;
of the texture texture components;
especially,
especially,
the strength of the γ-fiber texture is enhanced. No new components are observed. are
the strength of the γ-fiber texture is enhanced. No new components observed.
There are also
There are also great
great differences in thedifferences
evolution ofintexture
the evolution of layers
in different texture
in in
thedifferent layers
ASR sample. in annealing
After the ASR
at 650 °C, the nucleation of Goss- and cube-oriented grains is inhibited at the surface layer, while
Goss- and cube-oriented grains are nucleated in the center layer. However, after annealing atMaterials 2020, 13, 4696 14 of 16
sample. After annealing at 650 ◦ C, the nucleation of Goss- and cube-oriented grains is
inhibited at the surface layer, while Goss- and cube-oriented grains are nucleated in the center
layer. However, after annealing at 750 ◦ C with complete recrystallization, the surface layer
completely consists of η-fiber-oriented grains, while the central layer is dominated by the
γ-fiber-oriented grains.
(4) After annealing at 850 ◦ C, the through-thickness grain orientation in the ASR sample is mainly
η-fibers. Both the γ-fibers as the main texture and η-fibers as the subsidiary texture coexist in the
SR sample. Thus, the ASR can significantly increase the strength of η-fibers.
Author Contributions: Data curation, Y.G. and B.F.; funding acquisition, Y.G.; investigation, Z.F. and J.C.;
software, Z.F. and L.P.; supervision, L.W. and Z.W.; writing—original draft, Z.F., Y.G. and B.F.; writing—review
& editing, Z.F. and Y.G. All authors have read and agreed to the published version of the manuscript.
Funding: This research was funded by the Shanghai Alliance Program [No. LM201946], and the APC was funded
by the Shanghai Alliance Program [No. LM201946].
Conflicts of Interest: The authors declare no conflict of interest.
References
1. Zhang, Y.; Lan, M.-F.; Wang, Y.; Fang, F.; Lu, X.; Yuan, G.; Misra, R.; Wang, G.-D. Microstructure and texture
evolution of thin-gauge non-oriented silicon steel with high permeability produced by twin-roll strip casting.
Mater. Charact. 2019, 150, 118–127. [CrossRef]
2. Jiao, H.; Xu, Y.; Zhao, L.; Misra, R.; Tang, Y.; Zhao, M.; Liu, D.; Hu, Y.; Shen, M. Microstructural evolution
and magnetic properties in strip cast non-oriented silicon steel produced by warm rolling. Mater. Charact.
2019, 156, 109876. [CrossRef]
3. Liu, H.-T.; Schneider, J.; Li, H.-L.; Sun, Y.; Gao, F.; Lu, H.-H.; Song, H.-Y.; Li, L.; Geng, D.-Q.; Liu, Z.-Y.; et al.
Fabrication of high permeability non-oriented electrical steels by increasing recrystallization texture
using compacted strip casting processes. J. Magn. Magn. Mater. 2015, 374, 577–586. [CrossRef]
4. Park, J.-T.; Szpunar, J.A. Texture Development during Grain Growth in Nonoriented Electrical Steels. ISIJ Int.
2005, 45, 743–749. [CrossRef]
5. Sidor, J.; Verbeken, K.; Gomes, E.; Schneider, J.; Rodriguez-Calvillo, P.; Kestens, L. Through process texture
evolution and magnetic properties of high Si non-oriented electrical steels. Mater. Charact. 2012, 71, 49–57.
[CrossRef]
6. Wu, S.-Y.; Lin, C.-H.; Hsu, W.-C.; Chang, L.; Sun, P.-L.; Kao, P.-W. Effect of Heating Rate on the Development
of Annealing Texture in a 1.09 wt.% Si Non-oriented Electrical Steel. ISIJ Int. 2016, 56, 326–334. [CrossRef]
7. Xie, L.; Yang, P.; Zhang, N.; Zong, C.; Xia, D.; Mao, W. Formation of {100} textured columnar grain structure
in a non-oriented electrical steel by phase transformation. J. Magn. Magn. Mater. 2014, 356, 1–4. [CrossRef]
8. Paolinelli, S.D.C.; Da Cunha, M.A.; Cota, A.B. The influence of shear bands on final structure and magnetic
properties of 3% Si non-oriented silicon steel. J. Magn. Magn. Mater. 2008, 320, e641–e644. [CrossRef]
9. Shi, C.; Jin, Z.; Ren, H.; You, J. Effect of lanthanum on recrystallization behavior of non-oriented silicon steel.
J. Rare Earths 2017, 35, 309–314. [CrossRef]
10. Fang, F.; Lan, M.-F.; Lu, X.; Zhang, Y.; Wang, Y.; Yuan, G.; Cao, G.; Xu, Y.; Misra, R.; Wang, G.-D. The impact
of niobium on the microstructure, texture and magnetic properties of strip-cast grain oriented silicon steel.
J. Magn. Magn. Mater. 2017, 442, 1–7. [CrossRef]
11. Cardoso, R.F.D.A.; Brandao, L.; Da Cunha, M.A. Influence of grain size and additions of Al and Mn on the
magnetic properties of non-oriented electrical steels with 3 wt. (%) Si. Mater. Res. 2008, 11, 51–55. [CrossRef]
12. Lan, M.-F.; Zhang, Y.-X.; Fang, F.; Lu, X.; Wang, Y.; Yuan, G.; Cao, G.-M.; Misra, R.; Wang, G.-D. Effect of
annealing after strip casting on microstructure, precipitates and texture in non-oriented silicon steel produced
by twin-roll strip casting. Mater. Charact. 2018, 142, 531–539. [CrossRef]
13. Sahoo, G.; Singh, C.; Deepa, M.; Dhua, S.; Saxena, A. Recrystallization behaviour and texture of non-oriented
electrical steels. Mater. Sci. Eng. A 2018, 734, 229–243. [CrossRef]
14. Ushioda, K.; Hutchinson, W.B. Role of shear bands in annealing texture formation in 3% Si-Fe (111)[112]
single crystals. ISIJ Int. 1989, 29, 862–867. [CrossRef]Materials 2020, 13, 4696 15 of 16
15. Park, J.-T.; Szpunar, J.A. Evolution of recrystallization texture in nonoriented electrical steels. Acta Mater.
2003, 51, 3037–3051. [CrossRef]
16. Fang, F.; Zhang, Y.; Lu, X.; Wang, Y.; Lan, M.; Yuan, G.; Misra, R.; Wang, G. Abnormal growth of {100} grains
and strong Cube texture in strip cast Fe-Si electrical steel. Scr. Mater. 2018, 147, 33–36. [CrossRef]
17. Ma, C.; Hou, L.; Zhang, J.; Zhuang, L. Influence of thickness reduction per pass on strain, microstructures
and mechanical properties of 7050 Al alloy sheet processed by asymmetric rolling. Mater. Sci. Eng. A 2016,
650, 454–468. [CrossRef]
18. Guo, X.; Deng, Y.; Zhang, Y.; Zhang, J.; Zhang, X. Microstructure and microtexture evolution of shear bands
in Al–Cu single crystal during asymmetric rolling. Mater. Charact. 2017, 128, 37–42. [CrossRef]
19. Kim, K.-H.; Lee, D.N. Analysis of deformation textures of asymmetrically rolled aluminum sheets. Acta Mater.
2001, 49, 2583–2595. [CrossRef]
20. Zhang, F.; Vincent, G.; Sha, Y.; Zuo, L.; Fundenberger, J.; Esling, C. Experimental and simulation textures in
an asymmetrically rolled zinc alloy sheet. Scr. Mater. 2004, 50, 1011–1015. [CrossRef]
21. Sha, Y.; Zhang, F.; Zhou, S.; Pei, W.; Zuo, L. Improvement of recrystallization texture and magnetic property
in non-oriented silicon steel by asymmetric rolling. J. Magn. Magn. Mater. 2008, 320, 393–396. [CrossRef]
22. Bintu, A.; Vincze, G.; Picu, R.; Lopes, A. Effect of symmetric and asymmetric rolling on the mechanical
properties of AA5182. Mater. Des. 2016, 100, 151–156. [CrossRef]
23. Lee, J.-K.; Lee, D.N. Texture control and grain refinement of AA1050 Al alloy sheets by asymmetric rolling.
Int. J. Mech. Sci. 2008, 50, 869–887. [CrossRef]
24. Simões, F.J.P.; De Sousa, R.J.A.; Gracio, J.; Barlat, F.; Yoon, J.W. Mechanical behavior of an asymmetrically
rolled and annealed 1050-O sheet. Int. J. Mech. Sci. 2008, 50, 1372–1380. [CrossRef]
25. Tamimi, S.; Correia, J.P.; Lopes, A.B.; Ahzi, S.; Barlat, F.; Gracio, J. Asymmetric rolling of thin AA-5182 sheets:
Modelling and experiments. Mater. Sci. Eng. A 2014, 603, 150–159. [CrossRef]
26. Kim, H.-K.; Kim, H.-W.; Cho, J.-H.; Lee, J.-C. High-formability Al alloy sheet produced by asymmetric rolling
of strip-cast sheet. Mater. Sci. Eng. A 2013, 574, 31–36. [CrossRef]
27. Uniwersał, A.; Wroński, M.; Wróbel, M.; Wierzbanowski, K.; Baczmański, A. Texture effects due to asymmetric
rolling of polycrystalline copper. Acta Mater. 2017, 139, 30–38. [CrossRef]
28. Lin, N.; Liu, S.; Liu, Y.; Fan, H.; Zhu, J.; Deng, C.; Liu, Q. Effects of asymmetrical rolling on through-thickness
microstructure and texture of body-centered cubic (BCC) tantalum. Int. J. Refract. Met. Hard Mater. 2019, 78,
51–60. [CrossRef]
29. Kim, J.-K.; Jee, Y.-K.; Huh, M.-Y.; Jeong, H.-T. Formation of textures and microstructures in asymmetrically
cold rolled and subsequently annealed aluminum alloy 1100 sheets. J. Mater. Sci. 2004, 39, 5365–5369.
[CrossRef]
30. Silva, J.; Júnior, E.B.; Moraes, N.; Botelho, R.; Felix, R.; Brandao, L. Influence of different kinds of rolling on
the crystallographic texture and magnetic induction of a NOG 3 wt% Si steel. J. Magn. Magn. Mater. 2017,
421, 103–107. [CrossRef]
31. Brasche, F.; Wang, J.; Timokhina, I.; Haase, C.; Lapovok, R.; Molodov, D.A. Mechanical twinning and texture
evolution during asymmetric warm rolling of a high manganese steel. Mater. Sci. Eng. A 2019, 764, 138183.
[CrossRef]
32. Paul, H.; Driver, J.; Maurice, C.; Piatkowski, A. The role of shear banding on deformation texture in low
stacking fault energy metals as characterized on model Ag crystals. Acta Mater. 2007, 55, 575–588. [CrossRef]
33. Mehdi, M.; He, Y.; Hilinski, E.J.; Kestens, L.A.; Edrisy, A. The evolution of cube ({001}) texture in non-oriented
electrical steel. Acta Mater. 2020, 185, 540–554. [CrossRef]
34. Jiao, H.; Xu, Y.; Qiu, W.; Xu, H.; Misra, R.; Du, Y.; Li, J.; Wang, G. Significant effect of as-cast microstructure
on texture evolution and magnetic properties of strip cast non-oriented silicon steel. J. Mater. Sci. Technol.
2018, 34, 2472–2479. [CrossRef]
35. Jia, N.; Eisenlohr, P.; Roters, F.; Raabe, D.; Zhao, X. Orientation dependence of shear banding in
face-centered-cubic single crystals. Acta Mater. 2012, 60, 3415–3434. [CrossRef]
36. Rajmohan, N. Neutron diffraction method for stored energy measurement in interstitial free steel. Acta Mater.
1997, 45, 2485–2494. [CrossRef]
37. Jiao, H.; Qiu, W.; Xiong, W.; Zhang, Y.; Fang, F.; Cao, G.-M.; Li, C.; Yu, Y.; Xu, Y. Effect of recrystallization
annealing temperature on microstructure, texture and magnetic properties of non-oriented silicon steel
produced by strip casting. Procedia Eng. 2017, 207, 2078–2082. [CrossRef]Materials 2020, 13, 4696 16 of 16
38. Takata, N.; Ikeda, K.; Nakashima, H.; Tsuji, N. In Situ EBSP Analysis of Grain Boundary Migration during
Recrystallization in Pure Aluminum Foils. Mater. Sci. Forum 2007, 558, 351–356. [CrossRef]
39. Inagaki, H. Fundamental Aspect of Texture Formation in Low Carbon Steel. ISIJ Int. 1994, 34, 313–321.
[CrossRef]
40. Wang, Y.-P.; An, L.-Z.; Song, H.-Y.; Wang, G.-D.; Liu, H.-T. Dependence of recrystallization behavior on
initial Goss orientation in ultra-thin grain-oriented silicon steels. J. Magn. Magn. Mater. 2020, 499, 166290.
[CrossRef]
41. Samajdar, I.; Cicale, S.; Verlinden, B.; Van Houtte, P.; Abbruzzesse, G. Primary recrystallization in a grain
oriented silicon steel: On the origin of goss {110} grains. Scr. Mater. 1998, 39, 1083–1088. [CrossRef]
42. Mehdi, M.; He, Y.; Hilinski, E.J.; Edrisy, A. Texture Evolution of a 2.8 Wt Pct Si Non-oriented Electrical Steel
and the Elimination of the h111i//ND Texture. Met. Mater. Trans. A 2019, 50, 3343–3357. [CrossRef]
43. Hutchinson, W.B. Development of Textures in Recrystallization. Met. Sci. 1974, 8, 185–196. [CrossRef]
Publisher’s Note: MDPI stays neutral with regard to jurisdictional claims in published maps and institutional
affiliations.
© 2020 by the authors. Licensee MDPI, Basel, Switzerland. This article is an open access
article distributed under the terms and conditions of the Creative Commons Attribution
(CC BY) license (http://creativecommons.org/licenses/by/4.0/).You can also read