Effective management of sea cucumber fisheries and the beche-de-mer trade in Melanesia
←
→
Page content transcription
If your browser does not render page correctly, please read the page content below
Effective management of sea cucumber fisheries and
                          the beche-de-mer trade in Melanesia

                         Crick Carleton,1 John Hambrey,2 Hugh Govan,3 Paul Medley4 and Jeff Kinch5

     Introduction                                                              4. Market makers are struggling to find new sources
                                                                                  of supply, and the market is entering a period with
     Sea cucumber fisheries are the second-most valuable                          a declining rate of increase in the volume of global
     capture-based, export fishery in the South Pacific, but                      supplies.
     sustainably managing these fisheries has proven to be
                                                                               5. Those involved in sea cucumber trading can make
     very difficult over the years. In years of peak exploita-
                                                                                  substantial short-term profit in return for limited
     tion, production has been valued at over USD 50 mil-
                                                                                  investment and at low risk. This, in combination
     lion, but in poor years the value has been only a fraction
                                                                                  with lax or non-existent control on exploitation and
     of this. Better management, combined with (current)
                                                                                  trade, and the absence of transparency, supports cor-
     higher prices could increase the value of the fishery, but
                                                                                  rupt and illegal activity.
     potential income is being lost as a result of persistent
     overfishing and wild swings in productivity resulting                     Bringing the sea cucumber industry under responsible
     from overexploitation.                                                    and sustainable management is of utmost importance.
                                                                               The key elements of management are well known, but the
     Market demand currently exceeds global supply, and
                                                                               practicalities of putting these in place are problematic. A
     prices are rising, particularly for more sought-after spe-
                                                                               key priority is to break or moderate the boom-and-bust
     cies of sea cucumber. Rather than strengthening the
                                                                               cycle typical of this industry. A more considered, stra-
     position of sea cucumber fishers, however, the lure of
                                                                               tegic and coordinated approach to managing supplies
     easy money and market forces are encouraging poor
                                                                               could greatly strengthen the position of the industry,
     practices and mis-management. Overexploitation often
                                                                               to the distinct benefit of national economies and rural
     results in fisheries being closed (for periods of up to 10
                                                                               coastal and island communities. These issues form the
     years or more) to allow stocks to recover.
                                                                               focus of this study.
     It could be argued that this is simply “business as usual”
     — a valuable renewable resource is rising in value, and a
     range of people are seeking to profit from this unfolding                 The study
     opportunity — but five aspects of the current circum-
                                                                               A recent study by Nautilus Consultants6 focused on the
     stances surrounding this fishery and trade are particu-
                                                                               sea cucumber fishery and its associated trade in five
     larly disturbing.
                                                                               countries: Papua New Guinea (PNG), Solomon Islands,
     1. The stocks are so depleted that each boom-and-bust                     Vanuatu, Fiji and Tonga. The study formed part of an
        cycle yields less than half the volume of product as it                initiative by the Australian Centre for International
        did formerly.                                                          Agricultural Research (ACIAR) that was implemented
     2. Sea cucumbers play an important role in maintain-                      by SPC, and responds to concerns raised by Melanesian
        ing the health of many marine habitats; where they                     country leaders and more broadly by the Heads of Fish-
        are absent or present in low numbers, ecosystem                        eries of Pacific Island countries and territories (PICTs).
        structure and function are altered.                                    The intention of the study was to raise the profile of
     3. The high value of prime sea cucumber product is                        sea cucumber fisheries by highlighting the poten-
        encouraging households to focus on sea cucumber                        tial economic returns from a sustainable fishery, and
        fishing and processing at the expense of subsistence                   the wealth lost through inadequate management, and
        and other revenue-generating activities, and encourag-                 identify effective approaches to the management of sea
        ing greater dependence on imported products, requir-                   cucumber fisheries in the Pacific, with an initial focus
        ing that households earn more from sea cucumbers.                      on Melanesia.

     1
         Nautilus Consultants, United Kingdom (crick@nautilus-consultants.co.uk)
     2
         Hambrey Consulting, United Kingdom
     3
         Independent Consultant, Fiji
     4
         Independent Consultant, United Kingdom
     5
         Principal, National Fisheries College (NFC) and the Nago Island Mariculture and Research Facility (NIMRF), Papua New Guinea
     6
         Full report available at: http://www.spc.int/DigitalLibrary/Doc/FAME/Reports/Carleton_13_BDM_Management.pdf

24                                              SPC Fisheries Newsletter #140 - January/April 2013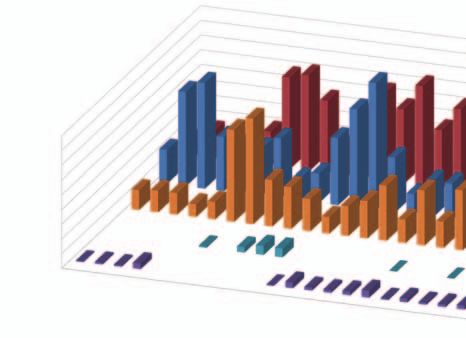
Effective management of sea cucumber fisheries and the beche-de-mer trade in Melanesia

The scoping study sought to:                                                  This article presents the results of the study in two parts:

•    profile the current and historic structure, operation                    Part A.
     and scale of sea cucumber harvesting and export in                       Provides a general introduction to sea cucumber fisher-
     the five countries;                                                      ies and the beche-de-mer trade in the study countries;
                                                                              presents production estimates for each of the five coun-
•    estimate the scale of revenues being foregone as a
                                                                              tries; and presents estimates of the economic loss result-
     result of persistent overexploitation and the boom-
                                                                              ing from mis-management, which ultimately results in
     and-bust nature of the fisheries;
                                                                              fishery closure.
•    identify fiscal and trade tools that could be used to
     better control production and trade;                                     Part B.
                                                                              Discusses potential solutions to better manage these
•    identify how management regimes could be                                 fisheries, with an emphasis on economic and trade man-
     strengthened to encourage sustainable exploitation                       agement tools.
     and to boost income to peripheral coastal and island
     communities; and                                                         The commentary and data presented in this article are
•    identify potential for regional cooperation — with a                     summaries of the report by Nautilus Consultants titled:
     particular focus on member countries of the Melane-                      “Effective management of sea cucumber fisheries and
     sian Spearhead Group — in strengthening manage-                          the beche-de-mer trade in Melanesia: Bringing the
     ment and increasing trade revenue.                                       industry under rational control”.

Part A: The sea cucumber industry and the beche-de-mer trade in
        Melanesia, and economic loss from overexploitation

An introduction to the sea cucumber                                           breathing apparatus (UBA), which is discouraged and
                                                                              illegal in Melanesian countries.7 Not only is the use of
industry                                                                      UBA dangerous, but it results in the harvesting of larger
Beche-de-mer is the trade name for dried sea cucum-                           numbers of mature adults, which adversely impacts
ber, which generally refers to the cooked and dried form                      spawning and stock recovery.
of some 60 commercially traded species. The product is
considered a food delicacy, especially in Asian markets,                      Sea cucumber harvesting most typically follows a boom-
and is also used in powdered form in Chinese medicines.                       and-bust pattern of exploitation. More heavily fished
                                                                              stocks take longer to recover; recovery can take several
Sea cucumbers inhabit a wide range of habitats across                         decades, and some stocks may never recover. If a stock is
coastal shallows and reef ecosystems and play an impor-                       fished before it has fully recovered, both harvest volume
tant ecological role.                                                         and average individual size will decrease. Underpin-
                                                                              ning this relationship is the fact that most sea cucum-
While 35 sea cucumber species are traded across Mela-                         bers are broadcast spawners with a pelagic larval stage,
nesia, examination of production and export records                           during which larvae are carried by sea currents for up
suggests that 21 species make up more than 90% of pro-                        to 20 days. Therefore, stock recovery depends on hav-
duction volume, and just 8 species make up over three-                        ing a sufficient concentration of spawning adults, the
quarters of production value.                                                 larvae finding suitable substrate on which to settle, and
                                                                              a sufficient proportion of young surviving long enough
Some of the most valuable sea cucumber species can
                                                                              to recruit to the commercially exploitable population.
be found (in healthy populations) at densities of 10–30
                                                                              Populations are particularly susceptible to local extinc-
per hectare, whereas lower-value species can be found
                                                                              tion as a result of overfishing because recruitment across
at densities of several hundred or several thousand per
                                                                              large stretches of ocean is problematic.
hectare. The higher-value species are typically har-
vested by free divers, whereas the lower-value species                        The range of species that make up the beche-de-mer
are more commonly harvested with less discrimination                          trade from the countries under study is shown in Table 1
through shallow water gleaning. Specimens found in                            and listed according to the estimated 2012 in-country
deeper water are sometimes harvested using a weighted                         purchase value (producer and/or processor selling to
impaling device, and some fishers use an underwater                           buyer and/or exporter) for A-grade dried beche-de-mer.

7
    In recent years, however, Fiji has issued a limited number of licenses for harvesting sea cucumbers using UBA gear.

                                                                                                                                             25
Effective management of sea cucumber fisheries and the beche-de-mer trade in Melanesia

     Table 1. The main sea cucumber species traded in the western and central Pacific.

                                                                                                        Purchase                          Av. weight
                                                                                                      price USD kg-1       Value             t yr-1
      Code Common name                                              Scientific name                      (dried)a          groupb      (beche-de-mer)c

      SF      sandfish                                              Holothuria scabra                        90               H                70
      WTF     white teatfish                                        Holothuria fuscogilva                    84               H               159
                                                                                          +
      GSF     golden sandfish                                       Holothuria lessoni                       60               M                  -
      BTF     black teatfish                                        Holothuria whitmaei                      53               M                29
      GF      greenfish                                             Stichopus chloronotus                    50               M                19
      PRF     prickly redfish / pineapple fish                      Thelenota ananas                         45               M                30
      BF      deepwater blackfish / Panning’s blackfish             Actinopyga palauensis                    45               M                  1
      DRF     deep water redfish                                    Actinopyga echinites                     45               M                  8
      SRF     surf redfish                                          Actinopyga mauritiana                    39               M                45
      BF      blackfish / hairy blackfish                           Actinopyga miliaris                      20                L               26
      CF      curryfish                                             Stichopus herrmanni                      20                L               53
      STF     stonefish                                             Actinopyga lecanora                      20                L               18
      TF      tigerfish / leopardfish                               Bohadschia argus                         20                L               74
      SNF     snakefish                                             Holothuria coluber                       16                L               86
      PNF     peanutfish / dragonfish / warty                       Stichopus horrens                        14                L                 7
                                                                                          *
      CHF     chalkfish / brownspotted sandfish                     Bohadschia similis                       14                L               48
      BSF     brown sandfish                                        Bohadschia vitiensis *                   14                L                 3
      FF      flowerfish / orangefish / ripple fish                 Pearsonothuria graeffei                  14                L               97
      AMF     amberfish                                             Thelenota anax                           14                L               48
      LF      lollyfish / reef lollyfish                            Holothuria atra                          11               VL              182
      ETF     elephant trunkfish                                    Holothuria fuscopunctata                 11               VL               42
      PKF     pinkfish                                              Holothuria edulis                          6              VL               18

      Notes
      a
        The estimated price at which A-grade dried product was bought from producers.
      b
        Product grouped by price bracket: H = high; M = medium; L = low; VL = very low.
      c
        The average amount of dried product of each species exported each year from the countries under study, based on production over 15 years
        (incorporating periods when fisheries closed), 1996–2012.
      +
        Golden sandfish has previously been classified as H. scabra var. versicolor but has recently been re-classified as H. lessoni, a separate species
        (Kinch et al. 2008).
      *
        Species with taxonomy due to be reviewed (Kinch et al 2008) – B. similis now renamed B. marmorata (Uthicke et al. 2010).

     Productivity is commonly shown in terms of peak                               The broad scale of harvests and exports is shown in Fig-
     exports; however, data indicate that heavy harvesting                         ure 1, where the 15-year average annual value of exports
     in one year impairs productivity in future years. In four                     of beche-de-mer by species is shown, together with the
     of the five countries under study, sustained high fish-                       equivalent volume of sea cucumbers harvested (live
     ing pressure on stocks has resulted in fisheries closures                     weight estimates). Interestingly, the largest biomass har-
     to allow stocks to recover. To better reflect potential                       vested is of the low value lollyfish sea cucumber and the
     productivity, the average production over a period that                       second-largest is of the very high-value white teatfish.
     includes at least two boom-and-bust cycles is presented.
     Accordingly, average exports over 15 years, including
     low or zero harvests when fisheries have been closed, are                     Regional beche-de-mer production
     shown in the final column of Table 1.
                                                                                   The beche-de-mer industry is a complex multi-species,
     At current purchase prices, 15-year average production                        multi-layered industry that requires analysis at multiple
     for the 5 countries under study is valued at some USD                         levels (from global to local). Good datasets on the total
     20 million per year, rather than upwards of USD 50 mil-                       volume of exports by each country under study are avail-
     lion, which has been ascribed to one-off peak produc-                         able (early figures for Tonga are absent) and the species
     tion from all PICTs.                                                          composition of exports is available, but inconsistent

26                                               SPC Fisheries Newsletter #140 - January/April 2013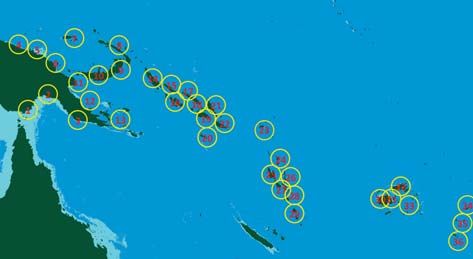
Effective management of sea cucumber fisheries and the beche-de-mer trade in Melanesia
harvest volume - tonnes live weight Beche-de-mer purchase value USD ‘000s
12,000 6,000
10,000 5,000
Live weight (in tonnes)
Value (in USD 1000s)
8,000 4,000
6,000 3,000
4,000 2,000
2,000 1,000
0 0
Sa sh
L sh
k t fish
rf sh
Ti sh
Br Sna sh
Pr san h
ly sh
Cu fish
Gr fish
be h
Ch fish
ha lac h
tru sh
ep Sto sh
sh
h
bl sh
s a sh
er sh
h
Go Flo fish
fis
Am nfis
s
ep Pe kfis
fis
fi
Su atfi
fi
dfi
rfi
ick dfi
kfi
nt kfi
fi
dfi
at efi
er tfi
en rfi
at
nk
nd
Bl olly
ow ke
d
rr y
k
nd
r
at nu
ge
e
al
n
ac
n
ee
re
re
re
te
e
w
P i
a
B
te
n
ac
hi
w
ld
W
w
ep
De
El
De
Commercially exploited species
Figure 1. Sea cucumber species ordered by value of average harvests, also showing the equivalent
harvest volume (tonnes live weight for five countries under study). Notes: Not all beche-de-mer purchased by traders is A-grade;
purchases comprise a range of sizes of animals and are processed to different standards. Accordingly, the prices used in calculating value
have been discounted from those shown in Table 1, discounted by 20% for white and black teatfish, and 30% for all other species.
2000
1750
Weight of dried sea cucumber (in tonnes)
1500
1250
1000
750
500
250
0
71
74
77
81
84
87
91
94
97
01
04
07
11
72
73
75
76
78
79
80
82
83
85
86
88
89
90
92
93
95
96
98
99
00
02
03
05
06
08
09
10
12
19
19
19
19
19
19
19
19
19
20
20
20
20
19
19
19
19
19
19
19
19
19
19
19
19
19
19
19
19
19
19
19
19
20
20
20
20
20
20
20
20
20
Years
Figure 2. Exports of beche-de-mer from the five countries under study, 1986–2012, tonnes of product (dried weight).
Source: Fisheries Department statistics from Fiji, Papua New Guinea, Solomon Islands, Tonga and Vanuatu.
across the data series (species-discriminated data for analysis, the study consolidated production and harvest
Vanuatu are poor). statistics, by species, at the provincial level (see Fig. 5).
When looking at the management of sea cucumber Figure 2 shows the combined exports of beche-de-mer
fisheries, national-level statistics are too general and for the five countries over the period 1971–2012. The
greater disaggregation is required. To better inform such graphic has been overlain with a polynomial trendline,
27
Effective management of sea cucumber fisheries and the beche-de-mer trade in Melanesia
reflecting the broad changes in export across this time products — although high-volume, low-markup species,
series. In broad terms, the evolution of the fisheries has such as lollyfish, have particular merit from a socioeco-
been low-level exploitation through the 1970s, with nomic perspective.
steady growth of exploitation in the 1980s that reached
Over the period illustrated in Figure 2, prices have
a peak in the early 1990s. Harvests dropped off after
strengthened, so while volume has declined, in dol-
this but a secondary, lower-level peak was reached in
lar terms the overall value of production has generally
the late 1990s. Concerns about widespread overfishing
increased, which creates a false sense of security around
of stocks resulted in the closure of fisheries in the Solo-
the status of stocks. Furthermore, the species mix has
mon Islands (2006), Vanuatu (2008) and PNG (2009);
shifted to lower-value species and the overall volume
the Tongan fishery was closed from 1997 for 10 years.
has decreased substantially (for many species the aver-
In the late 2000s, with most fisheries subject to a mora-
age size of individuals harvested has declined as well).
torium, regional production was being provided by Fiji
Recent harvests have declined in scale and quality, and
and Tonga only8 stocks in both of these countries are
even with “rest” periods, stocks are not returning to the
now thought to be overexploited, and fishing pressure
levels found in the 1980s.
will have to be reduced to allow for stock recovery.9
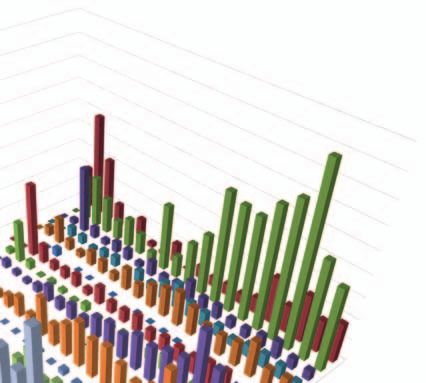
Figure 3 shows the same dataset disaggregated by coun-
The increasing demand for beche-de-mer can be largely
try, noting that four of the five fisheries were subject to a
ascribed to the increased demand from China, resulting
moratorium late in the data series.
from economic growth and rising incomes. As beche-
de-mer supplies from traditional sources are reduced, Given its geographic size, PNG is consistently the high-
the trade has sought new sources, but these in turn have est sea cucumber producer among the five countries,
also been overexploited (Purcell et al. 2012; To and Shea with significant but lesser volumes produced by Fiji and
2012). The result has been substantial upward pressure the Solomon Islands. Production from Tonga in 2008
on market prices: pries for lower-value species have typi- and 2009 exceeded that of Fiji, but it is clear that despite
cally increased by two to three-fold over the last seven the ten-year moratorium and the setting of provincial
years, while higher-value species have increased four fishing quotas (which were considered conservative at
or five-fold. Given this, buyers and exporters encour- the time), the fishery has been all but fished-out over the
age fishers to focus on exploiting high-value species — course of two seasons.
attractive because these are low-volume, high-mark-up
900
Weight of dried sea cucumber
800
700
600
(in tonnes)
500
400
Papua New Guinea
300
200
Fiji
100
- Solomon Islands
86
87
88
19
89
19
90
19
91
19
92
19
Tonga
93
19
94
19
95
19
96
19
97
19
98
19
99
19
00
19
01
19
02
20
03
20
Vanuatu
04
20
05
20
06
20
07
20
08
20
09
20
10
20
11
20
12
20
20
20
Vanuatu Tonga Solomon Islands Fiji Papua New Guinea
Figure 3. Export volume of beche-de-mer, 1986–2012, tonnes of product (dried weight).
8
Note that New Caledonia, not included in this study, is a significant regional beche-de-mer producer and exporter.
9
The Tonga fishery has been closed again as from the beginning of 2013.
28 SPC Fisheries Newsletter #140 - January/April 2013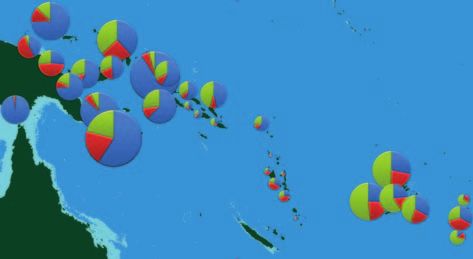
Effective management of sea cucumber fisheries and the beche-de-mer trade in Melanesia

         90,000

           80,000

                70,000

                  60,000

    Weight of       50,000
    dried sea
    cucumber         40,000
       (kg)
                         30,000

                           20,000

                             10,000

                                  0

                                      1990
                                        1991
                                          1992
                                            1993                                                                                                                                          sandfish
                                              1994                                                                                                                                    white teatfish
                                                 1995                                                                                                                             black teatfish
                                                                                                                                                                               greenfish
                                                   1996                                                                                                                    prickly redfish
                                                     1997                                                                                                              deep water redfish
                                                        1998                                                                                                       surf redfish
                                                          1999                                                                                                 blackfish
                                                                                                                                                           curryfish
                                                             2000
                                                   Year                                                                                               stonefish
                                                                2001
                                                                                                                                                  tigerfish
                                                                  2002                                                                        snakefish               Species
                                                                       2003                                                              dragonfish
                                                                         2004                                                       chalkfish
                                                                              2005                                              flowerfish

                                                                                2006                                      brown sandfish
                                                                                                                    amberfish
                                                                                     2007
                                                                                                              lollyfish
                                                                                        2008
                                                                                                        elephant trunkfish
                                                                                            2009   pinkfish

    Figure 4. Estimated volume of dried beche-de-mer exports originating from Milne Bay Province, Papua New Guinea, by species.
                                                          Source: Papua New Guinea’s National Fisheries Authority trade database.

Figure 4 gives an example of production data at the                                                  exhausted and that the average size of each species har-
provincial level (Milne Bay Province, PNG), where it is                                              vested decreases over time. Accompanying the decline
evident that much effort was put into harvesting sand-                                               in average sea cucumber size is a shift to exploit lower-
fish in the early period of this time series, with harvests                                          value species.
quickly dropping off and not building up again until
about 10 years later. By the late 1990s, white teatfish                                              Overall, the indications are that historic levels of exploi-
and lollyfish had clearly become the main targets of fish-                                           tation are not sustainable, and that different harvesting
ing effort, which were accompanied by high harvests of                                               strategies could sustain both higher biomass extraction,
black teatfish, greenfish, prickly redfish, tigerfish and                                            and higher average value of sea cucumbers extracted.
brown sandfish, but these harvests quickly decreased as
the resources became depleted.                                                                       The study compiled data at the provincial level for each
                                                                                                     country, and Figure 5 shows provincial and district
Analysis of the boom-and-bust cycles typical of sea                                                  boundaries. Production by province is shown in Figure
cucumber fisheries shows that, in general, the heights                                               6, where the reported volume of beche-de-mer exports
of earlier cycles are rarely repeated; by all indications,                                           over the 15-year period 1997–2011 has been averaged,
stocks do not fully recover. Analysis of the changing                                                and then valued, based on a representative species mix
harvests of the different species over time also confirms                                            for that province. The value of production is shown
this pattern. Anecdotal evidence suggests that the larger                                            on the basis of the following categories: high-value,
specimens available at the outset of a boom are soon                                                 medium-value and low-value species (see Table 1).

                                                                                                                                                                                                       29
Effective management of sea cucumber fisheries and the beche-de-mer trade in Melanesia

                                                                                             As a cross-check, shallow water
                                                                                             area (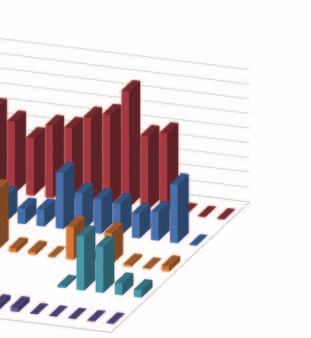
Effective management of sea cucumber fisheries and the beche-de-mer trade in Melanesia
12
10
Quantity exploited
8
6
4
2
-
1 2 3 4 5 6 7 8 9 10 11
12 13
14 15
16 17
18 19
20 21
22 23
Year 24 25
26 27
28 29
30
stable exploitation (150 t) level boom-and-bust exploitation (138 t) declining boom-and-bust (100 t) exhausted
Figure 8 . Example of the resource yield from different exploitation patterns.
there would be 9 years of little to no income, and the • At this point in the exploitation cycle, most coun-
exhausted fishery would produce 15 years of little to no tries found it necessary to close exhausted fisheries
income. In addition, the unit value of catches achieved in order to allow them to recover; in Fiji, where no
each year is likely to decline across each boom-and-bust closures have implemented, the statistical record
cycle as larger specimens are removed from the fishery indicates that the underlying scale of harvests is
and the focus shifts to smaller and lower-value species. declining steadily, and has been buoyed up, to an
extent, by the official licensing of UBA fishing.
In practice, in the countries under study, the evolution
of sea cucumber fisheries — as supported by the statis- Clearly, the potential economic impact on coastal and
tical record, anecdotal evidence from interviews, and island communities can be highly significant because
illustrated in Figures 2 and 4 — is as follows: unsustainable practices lead to the stock being system-
atically depleted through fishing. To put this into per-
• Fishing effort steadily increased in the early years,
spective, the example of Tonga is a salutary lesson (see
going beyond levels that could be readily replaced
Fig. 9). Long-term overexploitation of the sea cucumber
and building to levels of extraction beyond the
fishery forced the government to call for a 10-year mora-
replacement capacity of the resource.
torium in 1997. The fishery was re-opened for a month
• In subsequent years, harvests of the primary target in 2008, seven months in 2009, three months in 2010 and
species were much reduced (both in volume and four months in 2011. From harvest and trade statistics,
in size) and effort shifted to other
species; the latter target species
2008 2009 2010 2011
were subsequently fished down. 250
Weight of beche-de-mer
• Exploitation of lower-value species
200
proceeded throughout the cycle,
(tonnes)
but increased once higher-value 150
species became difficult to find;
over time, these resources were 100
also depleted, and effort shifted to
species that were not previously 50
exploited.
0
• As high-value stocks recovered,
Value of beche-de-mer
this attracted more fishing effort; 15.00
following a long period of relatively
(USD kg-1)
flat prices, from the mid-2000s 10.00
prices for most high-value species
steadily increased, which encour- 5.00
aged fishers to dedicate more effort
0
to harvesting high-value species, Vava'u Ha'apai Tongatapu
with extraction again far beyond
sustainable levels. Figure 9. Evolution of sea cucumber harvests in Tonga.
31
Effective management of sea cucumber fisheries and the beche-de-mer trade in Melanesia

     it evident that the main stocks were all but fished out by                            cucumber harvesting and processing every year,
     the end of 2010, particularly higher-value species. The                               and the harvesting regime becomes more predict-
     subsequent two years of harvests focused on very low-                                 able; bearing in mind that many of these fisheries
     value species and the fishery was closed at the beginning                             are currently overexploited and/or in recovery, this
     of 2013. It is unclear when this will be re-opened, but the                           more stable management regime would need to be
     extent to which stocks have been depleted suggests the                                preceded by a period of managed stock recovery.
     need for a 5–10 year period for stock recovery.
                                                                                      •    There is arguably less pressure to engage in illegal,
     Regularly depleting stocks results in lower revenues than                             unreported and unregulated fishing.
     could be achieved using alternate harvesting and manage-                         •    More consistent and predictable levels of income
     ment strategies —specifically, harvesting stocks at lower                             are likely to provide greater incentive for coastal and
     annual levels so that both the scale and quality of harvests                          island communities to take increased control over
     can be sustained over medium and longer terms.                                        their fisheries..
     Much can be done to strengthen the long-term scale                               •    The provincial focus is likely to provide impetus for
     and value of harvests, and therefore many benefits from                               significant improvement in the capacity of provinces
     these fisheries have been foregone as a result of recent                              to manage and monitor coastal fisheries.
     and current systems of management. This is illustrated
     in Figure 10, using actual harvest figures. To remove the                        On this basis, regional harvests in 2006 totalled 930
     issue of rising prices across the time series, current con-                      tonnes (t), representing a current value of USD 15.8 mil-
     stant prices are applied.                                                        lion. Under a more moderate exploitation regime, we
                                                                                      estimate that the harvest volume could have been on the
     This exercise suggests that more sustainable manage-                             order of 850 t, representing a current value of USD 18.4
     ment10 might yield 10% less in export volume, but 25%                            million. In subsequent years, the sea cucumber fisher-
     more in export value without the processing discount                             ies of PNG, Solomon Islands and Vanuatu were closed
     (valued at buy-in price), and 50% more if the processing                         to allow stocks to recover, and to compensate for pre-
     discount is applied. Limited to the time series covering                         vious excessive harvests. Tonga’s sea cucumber fishery
     the last 15 years, the difference is still greater — about                       was opened, but was all but exhausted by the end of
     a 5% increase in volume over the period — but an 80%                             2012, and Fiji’s fishery has remained open, but harvests
     increase in value without the processing discount, and                           have been well below those achieved in the 1980s and
     a 100% increase in value with the processing discount.                           1990s. From 2007 to 2012, the five countries under study
                                                                                      exported an average of 600 t of beche-de-mer per year,
     Using constant prices (based on current buy-in prices),                          whereas under the precautionary management regime
     this suggests that annual income to coastal and island                           this would have been closer to 1,000 t per year, and
     communities would have ranged from between USD 24                                increased annual revenues by about USD 13 million.
     million at the highest peak in the late 1990s, down to a
     current level of some USD 4 million. Under the more                              This exercise demonstrates the significant economic loss
     precautionary and sustainable scenario described above,                          that results from overexploitation (a high proportion of
     this would translate into an annual value of between                             lower-value species, smaller animals and poor process-
     USD 16 million and USD 22 million every year.                                    ing practices), which ultimately results in fishery mora-
                                                                                      toria where no revenues are realised. More precautionary
     Across the most recent 15-year time series, this trans-                          production levels, with improved processing and fishery
     lates into revenue generation of some USD 160 million                            management, increase economic value (a higher-value
     under current circumstances, and USD 320 million                                 species mix and larger sea cucumbers) with no need for
     under more precautionary management and improved                                 moratoria, and so revenues are realised every year.
     standards of processing. Clearly, the difference is huge,
     but it also comes with other distinct advantages:                                Part B hereafter discusses management strategies that
                                                                                      facilitate improved fishery and trade management,
     •     Under the more precautionary management regime                             which translate to higher economic return value derived
           there is no need for moratoria, so coastal and                             from these important fisheries.
           island communities can generate income from sea

     10
           It should be stressed that this analysis is based primarily on the trade record, albeit with some recognition of biological processes. In terms of
          determining a biologically sustainable level of exploitation, key data (size, distribution of animals, and the area over which they exist) that would
          enable the calculation of stock size, biomass, and maximum sustainable yield (MSY) are missing, except in the work currently being undertaken
          in Vanuatu, where stock assessments are being prepared on a small-area basis (Leopold et al. 2013 and Duvauchelle 2010). As an alternate
          approach to modelling stock size, stock condition and MSY, we have undertaken preliminary modelling of the trade and value record (with
          encouraging results), and are of the strong view that this warrants further work. The figures emerging from this modelling, which was based on
          the trade series for Milne Bay, bear credible similarity to exploitation levels proposed by NFA, but we would caution that further work needs to
          be undertaken to bring these approaches together in support of a single fishery management proposal.

32                                                  SPC Fisheries Newsletter #140 - January/April 2013
Effective management of sea cucumber fisheries and the beche-de-mer trade in Melanesia
2000 Regional exports of beche de mer
Weight of dried sea cucumber (t)
1800 (tonnes of dried weight). Taken
1600 from export statistics for the five
1400 countries under study.
1200
1000
800
600
400
200
0
71
77
84
94
04
73
75
79
82
86
88
90
92
96
98
00
02
06
08
10
12
19
19
19
19
20
19
19
19
19
19
19
19
19
19
19
20
20
20
20
20
20
Year
40 Likely average unit buy-in price at
Value (USD kg-1)
30 today’s prices (USD kg-1 of dried
weight) (i.e. price reflects changes
20 in species mix and size).
10 Red = overexploitation
Blue = sustainable exploitation
0
71
77
84
94
04
73
75
79
82
86
88
90
92
96
98
00
02
06
08
10
12
19
19
19
19
20
19
19
19
19
19
19
19
19
19
19
20
20
20
20
20
20
Year
2000 35,000 Smoothed production
Weight of dried sea cucumber (t)
1800 curve under current
30,000 Value (USD 1000s)
1600 overexploited scenario.
25,000 Solid line is production
1400
(tonnes of dried weight;
1200 20,000 left-hand axis); dotted
1000 line is value, including
800 15,000 20% discount for poor
600 processing (USD 1000s;
10,000
right-hand axis).
400
5000
200
0 0
71
77
84
94
04
73
75
79
82
86
88
90
92
96
98
00
02
06
08
10
12
19
19
19
19
20
19
19
19
19
19
19
19
19
19
19
20
20
20
20
20
20
Year
2000 35,000 Smoothed production
Weight of dried sea cucumber (t)
1800 curve under sustainable
30,000
Value (USD 1000s)
1600 scenario. Solid line is
1400 25,000 production (tonnes of
dried weight; left-hand
1200 20,000 axis); dotted line is value,
1000 including 20% discount
800 15,000 for poor processing
600 10,000 (USD 1000s; right-hand
400 axis).
5000
200
0 0
71
77
84
94
04
73
75
79
82
86
88
90
92
96
98
00
02
06
08
10
12
19
19
19
19
20
19
19
19
19
19
19
19
19
19
19
20
20
20
20
20
20
Year
Figure 10. Illustrations of valuation of beche-de-mer exports under different assumptions.
33Effective management of sea cucumber fisheries and the beche-de-mer trade in Melanesia
Part B: Managing sea cucumber fisheries and the beche-de-mer trade
Approaches to managing sea 2. Pressure on fisheries in recent years has been increas-
ingly intense, and is associated with:
cucumber fisheries
• improved market access and high prices;
This section introduces global experiences in manag- • increased use of boats, which allow for the exploi-
ing sea cucumber fisheries, including an assessment of tation of previously virgin stock; and
the strengths and weaknesses of alternative approaches,
• poverty11 coupled with income generating aspi-
and opportunities to reinforce implementation of these
ration, which results in an incentive to fish even
approaches through economic and fiscal measures.
when sea cucumber densities are extremely low.
Status and pressures 3. Sea cucumbers are highly vulnerable to overexploi-
tation because they are:
Experience of sea cucumber fisheries management in
• sedentary, shallow water animals and readily
the Pacific and globally has been reviewed and sum-
accessible to harvesting;
marised by Kinch et al. (2008), Purcell et al. (2013),
and Anderson et al. (2011). Many management issues • long-lived, slow maturing, broadcast spawners
are also addressed in Purcell et al. (2012). According to dependent on minimum densities for successful
these and other studies, the key management issues per- reproduction; and
taining to sea cucumber fisheries include the following. • harvested as mixed-species fisheries. When target
species dip below commercial densities, fishers
1. Significant problems associated with managing sea continue to fish. Although they are targeting other
cucumber species, with many or most species show- species, they nonetheless continue to catch the pre-
ing signs of overexploitation. For example: vious target species, pushing these further below
• 38% of sea cucumber fisheries globally are cur- viability, and possibly towards local extinction.
rently overexploited (Purcell et al. 2013), and
many of these in the Pacific; Management response
• regional assessments have revealed that popula- A wide range of management instruments have been
tion declines from overfishing occurred in 81% applied, mediated through customary marine tenure,
sea cucumber fisheries, average harvested body provincial and national government initiatives, aid pro-
size declined by 35%, harvesters moved from jects and non-governmental organisations. They have
near to offshore regions in 51% and from high- included size limits, gear restrictions, spatial and tempo-
to low-value species in 76% of sea cucumber ral closures, quotas and marine reserves.
fisheries;
The use of different management measures in sea
• 38% of sea cucumber fisheries remain unregu- cucumber fisheries worldwide has been reviewed by
lated, and illegal catches were of concern in half Purcell et al. 2009, and the frequency of use of these
of these (Anderson et al. 2011). measures is summarised in Table 3.
Table 3. Use of different management tools in sea cucumber fisheries worldwide (after Purcell et al. 2009).
Management tool Proportion of sea cucumber fisheries
Moratoria 39%
Gear restrictions 39%
Minimum size limits 34%
Catch quotas 28%
Fleet controls (numbers or size of vessels) 22%
Rotational harvest strategies (industrial fisheries only) 5%
11
Stock depletion and overexploitation has been shown to be correlated with low human development index and poor enforcement of regulations
(Purcell et al. 2013).
34 SPC Fisheries Newsletter #140 - January/April 2013Effective management of sea cucumber fisheries and the beche-de-mer trade in Melanesia
Generally speaking, these management tools have failed part to the difficulties of stock assessment, which in
to curb overfishing. The main reasons relate to power- turn is related to:
ful drivers and the ease of overexploitation as described
above, as well as more practical issues of limited funds • the number of species involved;
and lack of enforcement, especially where large numbers • the difficulty of identifying larvae;
of widely dispersed fishers are involved. • cryptic juveniles;
This management failure has led to crisis management • the difficulty of tagging soft-bodied animals;
in the form of moratoria, which have been introduced in • there being no clear age-weight relationship; and
many countries in the Pacific and elsewhere, including • difficulties in establishing recruitment to the spawn-
the Commonwealth of the Northern Mariana Islands, ing stock.
Costa Rica, mainland Ecuador, Egypt, Fiji, India, Mau-
ritius, Mayotte (France), mainland Panama, Papua New Young and adult sea cucumbers (excluding juveniles)
Guinea, Solomon Islands, Tanzania, Tonga, Vanuatu and are, however, relatively easy to find, measure, weigh and
Venezuela (Purcell 2010). Despite these extreme meas- count, and size distributions and density mapping by
ures, populations of some species have failed to recover; species is relatively straightforward. Estimating poten-
in some examples no recovery has occurred even 50 tial productivity from habitat mapping coupled with
years after fishing stopped (Battaglene and Bell 2004), some biological characteristics may offer a way forward,
and local extinctions have been reported (Friedman et but is complicated by the limited availability of habitat
al. 2011). maps, and the fact that the relative distribution of dif-
ferent sea cucumber species is not clearly delimited by
habitat (although there are clear differences in the prob-
There are, however, some examples of what appear to be ability of finding a particular species in one habitat over
sustainable sea cucumber fisheries, and Purcell et al. (2013)
another). Nonetheless, the combination of habitat map-
concluded that success relates to a number of factors, includ-
ping and density surveys might enable rough estimates
ing enforcement capacity, number of species harvested, fleet
(vessel) controls, limited entry controls, and rotational clo- of productivity and stock status (see Hamel and André-
sures. It is, however, unclear that these factors apply to sea fouët 2010; Hajas 2011; Skewes et al. 2010; Skewes et al.
cucumber fisheries in Melanesia. 2006; Skewes et al. 2004; Preston and Lokani 1990) and
possibly modelling estimates of target reference points.
In Melanesia, the stock health has been periodically mon-
There is also a widespread view, especially in the Pacific itored through surveys focused on recording the densities
Islands, that more effective management will depend on of different species in different habitats. Over time, these
empowering local management systems with help, sup- data have been used to develop threshold values of what
port or advice from central government fisheries admin- might be considered indicators of a healthy stock.
istrations, although successful instances of this are
limited. According to Purcell et al. (2009), co-manage- The study explored the potential use of species trade data
ment systems existed in just 12% of sea cucumber fish- (an index of catch) and value data (a proxy for effort)
eries, although a greater emphasis is anticipated. Given as a means of assessing stock size and MSY (using a
the very strong incentives that encourage overfishing, methodology adapted from Vasconcellos and Cochrane
however, and the high vulnerability of sea cucumbers to 2005). Acceptable model fitting was achieved, yielding
overexploitation, it is clear that empowering local com- estimates of stock size, MSY and the likely impacts of
munities is likely to be only one part of a more com- different harvest control rules (HCRs). The conclusion
prehensive approach to regulating and managing sea was that this is a valid and practical means of estimat-
cucumber exploitation. ing key stock parameters where good time series trade
data (discriminated by species) are available. The value
It is notable that the use of fiscal and economic tools of such modelling could only be further strengthened
to reinforce fisheries management is hardly referred where additional datasets were available, indicating the
to in the literature on sea cucumber management; and size composition of exports, and the spatial distribution
indeed, is little discussed in the general fisheries man- of each species (linking to habitat data).
agement literature, except in relation to quota valuation
and trading.
Regulations and potential HCRs
Stock assessment Depending on the information available and the man-
One of the weaknesses of management to date has been agement institutions in place, general restrictions or
the lack of a clear relationship between the state of the more specific HCRs or targets for the country, district,
stock and management response. This relates in large lagoon or reef may be set.
35Effective management of sea cucumber fisheries and the beche-de-mer trade in Melanesia
Density limits would raise questions, although the ability to store
beche-de-mer makes strict policing of closed seasons at
Minimum viable population density has been discussed the point of export difficult. It is for this reason that the
as a possible HCR. Bell et al. (2008) review the limited use of national closed seasons should be accompanied
research on minimum viable densities for successful by the application of per-species export caps as a means
fertilisation in sea cucumbers, and speculate that the of making stockpiling and contravention of other less
“threshold densities to avoid depensation for most tropi- commercially attractive controls. Accordingly, it is for
cal sea cucumbers will be in the range of 10–50 indi- the purposes of controlling trading rather than fishing
viduals ha-1 over substantial areas, depending on species activity that it is recommended that national closed sea-
and location”. Purcell (2009) suggests the following rules sons should be maintained, ideally lasting between six
of thumb:Effective management of sea cucumber fisheries and the beche-de-mer trade in Melanesia
information (e.g. fishermen’s or trader’s views on catch Such tools can also be used to support and/or deliver
per unit of effort, average sizes caught, and abundance). particular policy objectives, including the potential
to recoup all or part of the costs of management and
Given the largely sessile nature of these organisms, the regulation.
limited range of larval dispersion and recruitment to
commercial stocks, and the very local nature of exploita- In the following section we discuss these tools under
tion, the setting of quotas is not a precise activity, and four distinct headings:
while it should provide a useful control at national and
provincial levels, it would be inappropriate to extend • information and its veracity — informing policy and
this particular system to the local level. We propose that practice;
local communities be encouraged to set and apply HCRs • limiting resource access as a means of encouraging
based on changes in the average size of sea cucumbers economic as well as biological optimisation — input
harvested, thereby shifting effort between stocks or controls and output controls;
stock groups and, where feasible, using area closures. • cost recovery mechanisms, and a subset of fiscal
incentives to specific behaviour patterns and policy
Implementation objectives; and
• providing disincentives to non-compliance and ille-
There are three key elements to the effective implemen-
gal behaviour.
tation of harvest control rules:
• address the factors that drive overexploitation;
• agree on practical and effective harvest control rules;
Informing policy
and
Information
• strengthen compliance through legal and financial
incentives or disincentives. Defining, monitoring and adjusting fiscal, economic
and trade measures requires access to good and depend-
able information. All of the countries studied have well-
Most measures would be more effective if they were com- developed trade data collection systems, but data are
bined with limited fishing seasons (input control), con- collected inconsistently and not routinely used for man-
trols on fishing methods (input control), minimum size agement purposes.
restrictions (output control), and more effective monitor-
ing throughout the supply chain (output control). Much valuable information can be obtained from trade
datasets, which provide a potent basis for managing the
beche-de-mer trade and sea cucumber exploitation.
Broader measures The major weaknesses identified in the collection and
collation of trade and harvest data are that data collec-
Re-stocking and stock enhancement offer some oppor-
tion protocols are not applied consistently, and the data
tunities to re-establish depleted fisheries.
are not routinely checked and analysed (a process that
Limits to entry, including restricted allocation of indi- would allow the information to be used for manage-
vidual quotas, are likely to be controversial for a small- ment purposes, and expose inconsistencies and errors).
scale fishery with very broad participation, such as that Crucial data are not routinely collected on purchases, by
for sea cucumber. It is also likely to be difficult to imple- species and by province.
ment unless a particular community with very strong
internal ties and well-established and respected local Transparency
authority systems decides to implement such a system.
As long as data are hidden from view, and are incom-
plete and unprocessed, management of sea cucumber
Fiscal, economic and trade measures fisheries and exports will continue to be subject to com-
Sector management can be improved substantially mercial and political pressures that result in activities
through the use of a variety of fiscal, economic and trade that are at odds with established policies and plans and,
tools as a means of: more importantly, sustainability of the resource and
continued revenue generation.
• regulation;
To improve transparency of the beche-de-mer trade, it is
• providing incentives or disincentives to certain recommended that:
behaviour; and
• providing the environment within which market • each country make clear, unambiguous annual dec-
forces can encourage and maintain discipline. larations regarding industry performance and the
37Effective management of sea cucumber fisheries and the beche-de-mer trade in Melanesia
rules that will govern industry performance in the • primary (i.e. excluding household and village-based
subsequent period; consolidators) beche-de-mer buyers and processors
• fishery and supply chain data be used for manage- operating at the provincial level be required to hold
ment and control purposes; a buyer or processor license, a condition of which
requires the provision of monthly species-based
• customs and fisheries departments share as much
data related to volume, value and species that move
information as legal and commercial confidentiality
throughout the processing facility, including details
limits allow, especially with regard to beche-de-mer
of the source fishery.
shipments prior to export; and
• exporters declare the species composition and source
(by province) for each shipment, with this informa- Production and export caps
tion made available to fisheries departments.
Export caps as an economic measure
Resource access The main management issue with sea cucumber fisheries
is persistent overexploitation. One of the key drivers for
One of the main categories of economic control is limit- such behaviour is the value of the resource, and the ease
ing access to the resource and the product. with which it can be converted into cash. Downstream
intermediaries such as buyers, processors, exporters and
Licensing importers all profit from the beche-de-mer trade. The
extent to which they profit from this business also drives
Licensing fishermen is problematic in a widely dis- these intermediaries to encourage the flow of more
persed, small-scale fishery that has limited management product along the supply chain, thereby contributing to
and administrative resources, and has traditionally the overexploitation of sea cucumber resources. Cap-
relied on local-level, customary management. It is more ping, such as limiting trade volumes, provides an effec-
practical to license the businesses that handle prod- tive means of reducing such behaviour and encourages
uct throughout the supply chain (i.e. those involved in other forms of profit optimisation (e.g. a focus on qual-
export, intermediary buyers, and processors where such ity over volume).
activity is centralised, such as in Tonga).
It is recognised that deriving a numerical basis for deter-
When licensing, it is important to consider drafting mining sustainable levels of exploitation is difficult, expen-
eligibility criteria that restrict eligibility to the types of sive and time consuming; however, moderating export
business that the national (and possibly regional) policy levels is a simple means of encouraging more responsible
seeks to encourage. In the process of confirming eligi- and sustainable behaviour, and is inherently an economic
bility, licensing authorities should be encouraged to tool because it operates as a constraint on business.
enquire into who controls the companies, how they are
financed, and how they can demonstrate that they are While it is appropriate to set the export cap at the same
not engaged in any form of transfer pricing.12 level as a stock management tool, it has a different ori-
gin. Governments lack the resources to micro-manage
Increasing the cost of an export licence may also be a exploitation at the local level, but placing an upper limit
means of discouraging applications from less serious on exports can be relatively easily policed, and supports
businesses. the work of resource managers.
It is recommended that: Export caps should be established on a species basis, and
• all exporters be required to hold a valid license, and as wherever possible should be informed by information
a condition of that license be required to provide data on stock management requirements. Crucially, however,
on all purchases, by species and origin of product; export caps should be put in place as a precautionary
measure even where no clear stock management infor-
• exporters be required to provide details of the aver- mation is available. Such caps can be periodically reset
age size (length, weight) per bag of each species on the basis of feedback on stock conditions.
shipped, and that bags contain a single species to
facilitate verification; Species-specific export caps should, therefore, be set as
• the eligibility criteria for export licenses exclude a precautionary measure, even where a consensus on
operations unlikely to fully comply with license con- the status of sea cucumber stocks and harvest limits is
ditions, with greater scrutiny of the integrity and absent. Where possible, such export caps should be sub-
background of the business principals and partners; divided at the provincial level so as to even out supply.
12
Transfer pricing typically seeks to declare sale prices on commercial invoices, manifests and customs declarations that are substantially below
the value of the product, as a means of reducing the scale of any export levies that may attach to the export, and as a means of artificially return-
ing profits to the importing rather than the exporting country. Transfer pricing is most commonly found in trade arrangements where the importer
is a major direct or indirect investor in the exporting company, through shareholding, trade financing or provision of working capital.
38 SPC Fisheries Newsletter #140 - January/April 2013Effective management of sea cucumber fisheries and the beche-de-mer trade in Melanesia
Cost recovery and economic incentives (specifically, the costs and revenues associated with
the beche-de-mer value chain); and
Actual and potential mechanisms for cost recovery
include: • consideration be given to applying a per-piece levy
on different beche-de-mer species.
• export levies on product value;
• licensing of exporters;
• licensing of processors; and
Monitoring, control and surveillance,
• access charges.
and measures to discourage illegal,
unreported and unregulated fishing
At present, most governments recoup some of the
costs associated with managing this fishery through a
and trade
levy on export value, which is based on quantity and
(usually) a notional value, with the latter often under- Fishery closures force the trade underground
representative of export values. This system needs to It is well known that beche-de-mer is exported illegally
be revisited with the intention of ensuring that result- when sea cucumber fisheries are closed, and that in
ing revenues are realistic in the context of beche-de- response to this, increased MCS resources are deployed
mer market value. Customs and fisheries departments in an effort to discourage and curtail such activity. The
should require that a detailed commercial importer evidence (from inside the countries of this study and
invoice form part of customs export documentation on through discussions with traders in Hong Kong and
which levies can be calculated. mainland China) suggests that illegal shipments con-
tinue to be made. This is considered to be a direct result
Variable export levies could be deployed as a means of of closing these fisheries.
encouraging desired behaviour. A key issue is that in
overexploited fisheries, fishers have little option but to For various reasons — in combination with socioeco-
catch and sell smaller animals. Assuming that minimum nomic and market conditions — there is strong support
legal size limits are enforced, another management con- for shifting sea cucumber harvesting from a boom-and-
trol is to apply a levy per piece of beche-de-mer exported. bust cycle to a more level and predictable fishery, year
For example, a levy of USD 1 per piece would discourage after year. It is evident that closure of at least some fish-
exporters from shipping smaller sized beche-de-mer. If eries simply results in the trade going underground, as
the levy is set at the right level, it encourages buying and communities and exporters seek to continue generating
selling larger beche-de-mer. Such a levy could be applied cash income and profits. This results in stocks being
to all species, or only to those species considered threat- overfished, with all activities performed outside the law,
ened with overexploitation. beyond the control of fisheries managers. In addition,
closing the fishery without management cost-recovery
A secondary positive effect of such a policy would be forces governments to increase MCS expenditures.
increased pressure on customs and fisheries depart-
ments to inspect and weigh a sample of each export
shipment. This would result in increased monitoring Fishing with UBA gear
and control of the trade, and monitoring and record- The illegal harvesting of sea cucumbers using UBA
ing of the average size of product shipped. The resulting gear is thought to be taking place in all countries. The
data would help managers assess the impact and inform deeper water sea cucumber resources are considered to
the adjustment of export caps, and contribute to stock provide an essential reservoir of adult breeding stock of
assessment modelling and the setting of catch limits. key species, and exploitation of these stocks is thought to
adversely impact recruitment and re-stocking in overex-
Revenues are also achieved through licensing exporters
ploited areas in shallower water.
and processors.
Existing bans on the use of UBA gear in sea cucumber
In conclusion, it is recommended that:
harvesting should be maintained, with increased effort
• all beche-de-mer production be subject to a manage- to enforce the bans.
ment levy collected at the point of export through an
In conclusion, it is recommended that:
ad valorem (according to value) tariff, and that the
provision of a valid commercial invoice be a prereq- • sea cucumber fisheries be managed to preclude the
uisite of customs clearance; need for closures — stocks should be rebuilt and
• the fee accompanying the issuing of export licenses then managed more conservatively; and
be significant; • the use of UBA gear in exploiting sea cucum-
• to facilitate the setting of license fees, export levies ber resources be banned, and the ban effectively
and variable per-species levies be further studied enforced.
39You can also read