Effects of an Omega-3 and Vitamin D Supplement on Fatty Acids and Vitamin D Serum Levels in Double-Blinded, Randomized, Controlled Trials in ...
←
→
Page content transcription
If your browser does not render page correctly, please read the page content below
nutrients
Article
Effects of an Omega-3 and Vitamin D Supplement on
Fatty Acids and Vitamin D Serum Levels in
Double-Blinded, Randomized, Controlled Trials in
Healthy and Crohn’s Disease Populations
Bobbi Brennan Laing 1,2, * , Alana Cavadino 3 , Stephanie Ellett 1,2 and
Lynnette R. Ferguson 1,2, *
 1   Faculty of Medical and Health Sciences, University of Auckland, Auckland 1023, New Zealand
 2   Nutrigenomics New Zealand, University of Auckland, Auckland 1023, New Zealand
 3   School of Population Health, University of Auckland, Auckland 1023, New Zealand;
     a.cavadino@auckland.ac.nz
 *   Correspondence: b.laing@auckland.ac.nz (B.B.L.); l.ferguson@auckland.ac.nz (L.R.F.);
     Tel.: +64-9–923-8418 (B.B.L.)

 Received: 12 March 2020; Accepted: 14 April 2020; Published: 18 April 2020

 Abstract: Two trials separately measured the bioavailability and impact on inflammation of a
 supplement taken daily containing 510 mg Docosahexaenoic acid (DHA), 344 mg Eicosapentaenoic
 acid (EPA), and 1000 IU of vitamin D (25-hydroxyvitamin D; 25(OH)D), for healthy and Crohn’s
 disease (CD) populations. Both trials were double blinded, randomized, placebo-controlled with
 cross-over. Participants were randomly allocated to groups A (placebo then supplement) or B
 (supplement then placebo). Both included a washout. Fatty acid (N-3 PUFAs) and vitamin D serum
 levels, plasma C-reactive protein (CRP), and stool calprotectin were measured before and after each
 treatment period. Outcome measures were analyzed using generalized linear mixed models, including
 terms for treatment, period, and a treatment-by-period interaction. The supplement significantly
 increased serum levels in healthy and CD groups for EPA (p < 0.001 and p < 0.001, respectively),
 Docosapentaenoic acid (p < 0.001 and 0.005), DHA (p < 0.001 and 0.006), the omega-3 index (p <
 0.001 and 0.001), and (vitamin D (p < 0.001 and 0.027). CRP and calprotectin measures showed no
 evidence of a treatment effect on inflammation; however, model estimation was imprecise for both
 outcomes, hence further research is required to elucidate potential inflammation effects. The nutrient
 supplement increased serum levels of key N-3 PUFAs and vitamin D in both populations, showing
 the preparation was readily bioavailable.

 Keywords: omega-3; eicosapentaenoic acid; docosahexaenoic acid; vitamin D; 25-hydroxyvitamin D
 (25(OH)D); C-reactive protein (CRP); calprotectin

1. Introduction
     Diet is a key component in the disease susceptibility of individuals.             Long chain
omega-3-polyunsaturated fatty acids (n-3 PUFA) and vitamin D (25-hydroxyvitamin D; 25(OH)D) are
associated with immune regulatory functions. Diets enriched in Eicosapentaenoic acid (EPA) and
Docosahexaenoic acid (DHA) in animal models have shown positive effects for chronic conditions [1–3].
Studies in humans have shown these fatty acids are a component of optimal diets for reducing the
risks associated with cancer and cardiovascular disease [4–6]. N-3 PUFA have also been shown
to be beneficial in reducing inflammation, especially in people with inflammatory disorders [7–11].
These fatty acids have been used as dietary supplements for some chronic conditions [1,12–14].

Nutrients 2020, 12, 1139; doi:10.3390/nu12041139                              www.mdpi.com/journal/nutrients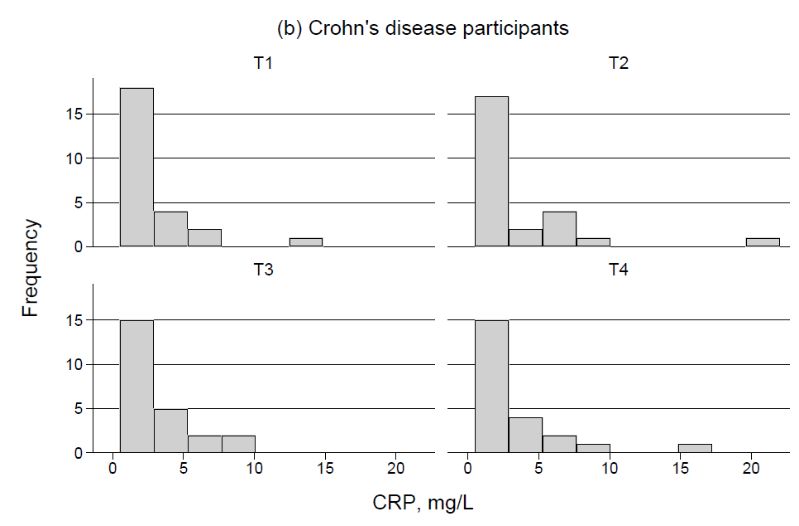
Nutrients 2020, 12, 1139                                                                             2 of 23

N-3 PUFA have furthermore been identified as precursors of mediators such as Resolvins, Protectins,
and Maresins, which stimulate anti-inflammatory and pro-resolving mechanisms [15]. In addition,
the sum of EPA and DHA in erythrocyte membranes and expressed as a percentage of total erythrocyte
fatty acids (the omega-3 index), is used as a risk factor measure diseases such as coronary heart
disease [16,17].
      Vitamin D is associated with many immune regulatory functions [18–20]. Vitamin D deficiency
has been associated with increased risk of diseases in adults such as osteomalacia, inflammatory bowel
disease (IBD), hypertension, heart disease, and multiple sclerosis [21–23]. Furthermore, vitamin D has
been implicated in seventeen varieties of cancer through its influence on signaling pathways [24–31].
The active form of vitamin D (1,25(OH)2 D3 ) also modifies the nucleotide-binding oligomerization
domain containing 2 (NOD2) defensin beta2 innate immune pathway, which is defective in some
people with IBD, particularly those with Crohn’s disease (CD) [32].
      C-reactive protein (CRP) is a measure of acute inflammation or infection [33]. Calprotectin is a
key protein found in the intracellular fluid of inflammatory cells and can be measured in the feces as
an indicator of the migration of neutrophils through the bowel wall to the fecal material, a measure of
bowel inflammation [34]. Fecal calprotectin scores for adults have been developed and compared to
endoscopy results, CRP, blood leukocytes, and the CD activity index, and found to be reliable marker
compared to these and is useful in discerning between mild, moderate, and highly active CD [35].
      In this study, the first double blind, randomized control trial (RCT) conducted was designed to
test the specific effect of a nutrient supplement (Lester’s Oil® ). This supplement, made in New Zealand
(NZ) is a new generation, long chain omega-3 PUFA and vitamin D supplement that had been available
for 18 months before the first RCT began. The first RCT was conducted to ascertain the supplement’s
safety, and to measure its effects on bioavailability and inflammation [36]. This was required by the NZ
Health and Disability ethics committee before a trial could be undertaken to measure these effects of
the supplement in people with CD. In the trial with healthy people, the placebo was an encapsulated
medium chain triglyceride (MCT) [37]. MCTs have been long used in clinical nutrition for the dietary
management of malabsorption syndromes [38], and have an appropriate safety profile that has led to
extensive use in clinical trials [39–43]. However, an early analysis of the data for the healthy participant
trial indicated that the four week washout period was not sufficient, suggesting a carry-over effect of
MCT on the vitamin D and fatty acid results [37]. For the CD trial, therefore, each of the intervention
and washout periods were extended to six weeks, and the formulation for the placebo was changed
from MCT to one containing long chain n-3 PUFA only.
      The aim of both studies was to investigate the effects of the nutrient supplement (Lester’s Oil® ) in
both trials, in particular the extent to which these fatty acids and vitamin D were taken up and utilized,
and whether the inflammatory markers CRP and fecal calprotectin were modified by this intervention.

2. Materials and Methods
     The study design for both trials was double blinded, randomized, placebo-controlled with
cross-over. The study population for each group was recruited from Auckland, New Zealand, with
an aim of even gender selection, with ages between 20–65 years. A person independent to the study
coded participants names once healthy participants were accepted into the first trial of the first study,
and they also randomly allocated them into one of the two arms of the study. In the second trial, CD
participants were drawn from the database of an earlier IBD study; therefore their existing codes were
used for the CD participants, and they were randomly allocated by a person independent to the study
into one of the two arms of the study. All participants and researchers were blinded to the treatment
regime until the trial was completed.
     Participants were randomly allocated to groups A or B. In each intervention period (four weeks
for the healthy population and six weeks for the CD population respectively), group A received the
placebo first, while group B received the nutrient supplement first (Figure 1). After a washout period
Nutrients 2020, 12, 1139 3 of 23
(four weeks for the healthy and six weeks for the CD subjects respectively), group A received the
supplement
Nutrients 2020, 12, xand
FOR group B received the placebo.
PEER REVIEW 3 of 23
Figure 1. Study
Study Design.
Design.
TheThe number
number of of participants
participants chosenfor
chosen foreach trial (n =
eachtrial = 30) was
was based
basedon ona apower
power calculation
calculation forforthethe
primary endpoint of vitamin D, using data from Jørgensen et al. [44].
primary endpoint of vitamin D, using data from Jørgensen et al. [44]. After three months of vitamin After three months of vitamin D3 D3
intake,
intake, Jørgensen
Jørgensen et et
al.al. reporteda awithin-person
reported within-personmean mean difference in invitamin
vitaminDDofof 2727nmol/L
nmol/L (standard
(standard
deviation
deviation (SD)(SD)= 29=nmol/L),
29 nmol/L), with with no reported
no reported change
change in vitamin
in vitamin D forD forthethe placebo
placebo group.
group. BasedBasedon onthese
n =
assumptions, n = 27 patients were required for 90% power to detect a difference in vitamin D as small as
these assumptions, 27 patients were required for 90% power to detect a difference in vitamin D as 27
smallatasa27
nmol/L, nmol/L, at
two-sided a two-sided
0.05 significance 0.05 significance level.
level.
ForFor the the interventions,
interventions, participants
participants werewere asked asked
to take to their
take their two nutrient
two nutrient capsules
capsules or placebo
or placebo capsules
capsules together daily, with their lunch or dinner meal. A total of
together daily, with their lunch or dinner meal. A total of four fasting blood samples were collected four fasting blood samples were from
eachcollected
individual from each individual
during the study; one during the study;
sample before onethe sample before the(T1),
first intervention first one
intervention
sample after (T1),theonefirst
sample after
intervention (T2),the onefirst intervention
sample after the(T2),
washoutone sample after and
period (T3), the washout
finally, one period (T3),
sample atand finally,
the end onelast
of the
sample at (T4;
intervention the endFigureof the
1).last
Bothintervention
trials were(T4; Figure 1).
conducted Boththe
from trials were conducted
beginning from the
of the autumn beginning
season to early
of the
winter in autumn
New Zealand season(fromto early
Marchwinter in New
to June). TheZealand (from March
time periods for each tointervention
June). The time wereperiods
based on forthe
each intervention were based on the outcomes of previous intervention
outcomes of previous intervention studies involving fatty acids, which showed the most effective length of studies involving fatty acids,
timewhich
requiredshowed the most
for uptake, effective length
distribution, of time requiredof
and interconversion forn-3
uptake, distribution,
fatty acids. In healthyandvolunteers
interconversionreaching
of n-3
steady fatty
levels canacids.
take up In healthy volunteers
to four weeks [45–49]. reaching
Ethical steady
approval levels cantrials
for the take with
up tohealthy
four weeks
and CD [45–49].
subjects
Ethical approval for the trials with healthy and CD subjects
was given by the New Zealand (NZ) Health and Disability Ethics committees (Ethics approval was given by the New Zealand (NZ)No:
Health and Disabilitywhich
NTY/11/11/109/AM105) Ethics committees
gave approval(Ethics
for the approval
trial withNo: NTY/11/11/109/AM105)
healthy subjects and for the trial which withgavethose
approval for the trial with healthy subjects and for
with CD (No: 15/CEN/153/AM01). All participants provided written consent. the trial with those with CD (No: 15/CEN/153/AM01).
All participants
Inclusion provided written
and exclusion consent.
criteria were as follows. In order to confirm that the selected participants met
the requiredInclusion and exclusion
conditions for thecriteria
study,weretwo as follows. In order
questionnaires to confirm that
(pre-screening andthe selectedwere
dietary) participants
conducted
met the required conditions for the study, two questionnaires (pre-screening
online before the beginning of the trial (Figures 2 and 3). Participants were excluded if they had: cancer and dietary) were in
the conducted
last five years online before
(bar the beginning
non-melanoma skinof cancers);
the trial (Figures
intestinal 2 and 3). Participants
disorders were excluded
for the healthy participants if they(e.g.,
had: cancer
Irritable Bowel in the last five
Syndrome, CD, years (bar non-melanoma
or Ulcerative skin cancers);
colitis); prescription intestinalchanges
medication disorders for the
in the lasthealthy
12 weeks;
wereparticipants
pregnant; (e.g.,smoked Irritable
moreBowelthan 10Syndrome,
pack years CD, or Ulcerative
(more than onecolitis);
pack ofprescription medication
cigarettes daily changeshad
for 10 years);
in the
taken last 12 weeks;
antibiotics were
in the last pregnant;
month; smoked
or were more thinning
on blood than 10 pack years (e.g.,
medicine (moreAspirin).
than oneParticipants
pack of cigarettes
with CD
daily for 10 years); had taken antibiotics in the last month; or were
also had to provide a list of current medicines and were screened by a gastroenterologist to ensure on blood thinning medicine (e.g.,they
wereAspirin).
in remissionParticipants withofCD
at the start thealso had
trial. Alltoparticipants
provide a list of current
were also asked medicines and vitamin
not to take were screened
D, fish by a
oil/flax
seedgastroenterologist
oil, or similar products to ensure they the
during were in remission
study and refrain at the
from start of themore
having trial.than
All participants
four portions were alsofish
of oily
asked
(e.g., not toor
mackerel take vitamin
salmon) in D, fish oil/flax seed oil, or similar products during the study and refrain from
a week.
having more than four portions of oily fish (e.g., mackerel or salmon) in a week.Nutrients 2020, 12, 1139 4 of 23
Nutrients 2020, 12, x FOR PEER REVIEW 4 of 23
Figure 2. Consort diagram for trial for healthy participants.
Figure 2. Consort diagram for trial for healthy participants.
2.1. Capsules for the Intervention and Placebo
The nutrient supplement capsule (Lester’s Oil®) contained six ingredients: omega-3 fish oil,
(DHA > 255 mg, EPA > 170 mg), vitamin D3 (500 IU), co-Enzyme Q10 (50 mg), zeaxanthin (0.82 mg),
leutin (3 mg), and astaxanthin (500 mcg). It also contained natural mixed tocopherols and vitamin
E with ascorbyl palmitate (1 mg), and was enclosed in a soft gel composed of gelatin, glycerin soft
gel, beeswax, and natural annatto. Two of these were taken daily. Lester’s Oil® was produced at
a Good Manufacturing Practices (GMP) certified facility, Auckland, New Zealand. This product
has passed the international fish oil standards (IFOS) program, which is an independent third-party
assessment program for fish oils, and meets the Global Organization for EPA and DHA (GOED) limits
for peroxide value and p-anisidine values. Marketed as a ‘healthy aging complex’, this supplement
is a well-characterized omega-3 PUFA-based oil with added bioactives, and has been available as a
commercial product since 2013.
The placebo capsules for the healthy trial participants contained 850 mg per capsule of MCT
sourced from Croda, Singapore (CRODAMOL GTCC-LQ-(SG), product code GE83907/0190/8S02).
The heavy metal contamination guarantee was less than 10 ppm. The oil contained the following
fatty acid distillates (FAD)C6:0 caproic 0.0–2.0%; FAD-C8:0 caprylic 50.0–80.0%; FAD-C10:0 capric
20.0–50.0%; and FAD-C12:0, lauric < 0.03%.
The one long chain n-3 PUFA fish oil placebo capsule used for the trial with CD participants
contained purified fish oil (2000 mg). Each capsule contained concentrated ω-3-ethyl esters (33% EPA
< 22% DHA). This was equivalent to 650 mg marine triglycerides, 360 mg EPA, and 240 mg DHA.
Each capsule also contained orange oil (2.0 mg) and -d-The alpha-tocopherol 1300 IU/g (1.15 mg).Nutrients 2020, 12, 1139 5 of 23
Each capsule was enclosed in a gelatin shell composed of gelatin (230 mg), glycerol (104 mg), and purified
water
Nutrients 2020,(37
12, xmg).
FOR This
PEER was sourced
REVIEW from the same GMP certificated facility as the nutrient capsule.5 of 23
Figure 3. Consort diagram for trial for CD participants.
Figure 3. Consort diagram for trial for CD participants.
2.2. Outcome Measurements
2.1. Capsules for the Intervention and Placebo
Outcomes of interest were fatty acid and vitamin D serum levels, CRP plasma, and stool calprotectin
The nutrient
(Table 1). Each supplement
outcome was capsule
measured (Lester’s Oil®) contained
from collected samplessix at ingredients:
each time point omega-3
(T1–T4).fish
Foroil, (DHA
each trial,>
255 mg, EPAof>19
a total 170 mg),
fatty vitamin
acids were D 3 (500 IU), co-Enzyme Q10 (50 mg), zeaxanthin (0.82 mg), leutin (3 mg),
measured. For the present study, the n-3 PUFA measurements of interest
and astaxanthin (500 mcg). It also contained
were EPA (C20:5), Docosapentaenoic acid (DPA; natural mixed
22.5), DHAtocopherols
(C22:6), and and vitamin index.
the omega-3 E withTheseascorbyl
n-3
palmitate (1 mg), and was enclosed in a soft gel composed of gelatin, glycerin
PUFA were of particular interest as diets enriched in EPA and DHA in animal models have shown soft gel, beeswax, and natural
annatto. Twoeffects
positive of these
for were
chronictaken daily. Lester’s
conditions, Oil®have
and studies was shown
produced at aand
cancer Good Manufacturing
cardiovascular diseasePractices
were
(GMP) certified facility, Auckland, New Zealand. This product has passed
lower in people whose diets had higher levels of these fatty acids [50–54]. There is some evidence the international fish oil
that
standards
DPA (IFOS)
may actprogram, which
as a source is an and
for EPA independent
DHA, hence third-party
DPA was assessment program
also of particular for fish[55,56].
interest oils, andDuemeets
to
the Global Organization for EPA and DHA (GOED) limits for peroxide value and
the short time for this trial (four or six weeks in each intervention group), changes in fatty acids would p-anisidine values.
Marketed as anotable
be most ‘healthy aging complex’,
in serum, rather thanthis supplement
in red blood cells,is athus
well-characterized
serum measuresomega-3 PUFA-based
of fatty acids were used oil
with added
insteadbioactives,
of the red and
bloodhascellbeen available
measures as a commercial
of fatty acids (whichproduct since 2013.
is the preferred measure for the omega-3
The placebo capsules for the healthy trial participants contained
index [16]). For fatty acid measurements, serum aliquots of 500 µL were stored 850 mg per capsule of MCT sourced
in Eppendorf tubes
from at
Croda, ◦Singapore (CRODAMOL GTCC-LQ-(SG), product code GE83907/0190/8S02).
−80 C for later evaluation using the analysis of fatty acid methyl esters (FAMEs) by AgResearch The heavy metal
contamination
Ltd., New guarantee
Zealand [57] waswith lessliquid
thanchromatography
10 ppm. The oilmass contained the following
spectrometry (LC-MS)fatty[58]. acid distillates
This measure
(FAD)C6:0
is based on the changes in metabolites produced with the ingestion of the nutrient capsules orFAD-
caproic 0.0%–2.0%; FAD-C8:0 caprylic 50.0%–80.0%; FAD-C10:0 capric 20.0%–50.0%; and the
C12:0,placebo.
lauric < It
0.03%.
is used to determine the extent to which the lipids ingested are utilized. Increasing the
The oneoflong
intake chain
lipids doesn-3
notPUFA
always fishequate
oil placebo capsule and
to utilization useduptake.
for the trial with CD participants contained
purified fish oil (2000 mg). Each capsule contained concentrated ω-3-ethyl esters (33% EPA < 22% DHA).
This was equivalent to 650 mg marine triglycerides, 360 mg EPA, and 240 mg DHA. Each capsule also
contained orange oil (2.0 mg) and - d-The alpha-tocopherol 1300 IU/g (1.15 mg). Each capsule was enclosed
in a gelatin shell composed of gelatin (230 mg), glycerol (104 mg), and purified water (37 mg). This was
sourced from the same GMP certificated facility as the nutrient capsule.Nutrients 2020, 12, 1139 6 of 23
Table 1. Outcome measures: fatty acids, markers related to inflammation and vitamin D.
Measure Details
Eicosapentaenoic acid (EPA) µg/mL, C20:5
Docosapentaenoic acid (DPA) µg/mL, C22:5
Docosahexaenoic acid (DHA) µg/mL, C22:6
Omega-3 index (using serum measures) µg/mL, sum of EPA and DHA
Calprotectin µg/g
C-reactive protein mg/L, reference range 0.5–5
Vitamin D nmol/L, serum 25(OH)D
For vitamin D, serum aliquots of 80 µL were stored in Eppendorf tubes at −80 ◦ C for later
evaluation using isotope-dilution liquid chromatography-tandem mass spectrometry (LCMS), which is
currently recognized as the gold standard for the measurement of serum concentrations [59]. Samples
were processed by the Canterbury Health Laboratories in Christchurch, NZ. There are several methods
to measure the biomarker for vitamin D [60]. The international vitamin D external quality assurance
scheme reports 16 types of measures [52]. In these two trials the vitamin D LCMS analysis was chosen.
CRP levels from blood plasma were measured using the CRP assay kit from Roche (Roche/Hitachi
cobas c 311, cobas c 501/502, Catalogue number 07 6993 2). The CRP analysis was performed by
LabPlus, Auckland, NZ [61]. The plasma (1 mL) samples for CRP analysis were collected in Eppendorf
tubes and processed on the same day. Calprotectin scoring was measured from 20 mL stool samples
using Bühleman’s Quantum Blue quantitative lateral flow assay.
2.3. Statistical Analysis
Separate analyses were carried out for data from each of the two trials. Participant characteristics,
anthropometric measurements, and outcome measurements were assessed for balance between
groups A and B at baseline within each trial using a chi-square test for categorical variables, and the
non-parametric Kruskall–Wallis test to compare continuous variables. In order to describe the
differences between the two trial populations, these baseline variables were also directly compared
between healthy participants and CD participants.
Generalized linear mixed models were used to estimate treatment differences in each outcome
measure while accounting for within-subject correlations arising from the cross-over design. Changes in
fatty acid measures, calprotectin, and vitamin D levels were analyzed using a gamma distribution
and a log link function to satisfy normality assumptions without the need for transformation of
outcome variables [62]. All models included random effects for individuals, and fixed effects for
period, treatment (nutrient supplement vs. placebo), a period by treatment interaction (to account
for potential carry-over effects), and a covariate to adjust for the baseline measurements. The use
of period-dependent baselines in analysis of cross-over data using random subject effects has been
shown to result in biased estimation of treatment effects, and is therefore not recommended [63].
The average of the two baseline measurements for each participant was therefore included in the
model as a covariate. Results are presented as estimated marginal treatment and period effects and the
interaction (carry-over) effect, with 95% confidence intervals and p-values. Statistical significance was
set as p-value < 0.05. All analyses were conducted using Stata version 16 [64].
2.4. Trial Registration
Both trials were registered with the Australian New Zealand Clinical Trials Registry (ANZCTR).
(Registration number ACTRN12616001316493 for the healthy population and registration number
ACTRN 12615000855527) for the CD population.Nutrients 2020, 12, 1139 7 of 23
3. Results
Thirty participants enrolled in the trial as healthy subjects (Table 2, Figure 2), of which 29 began
and 27 participants completed the whole trial. Twenty-seven participants with CD (Tables 2 and 3)
enrolled for the trial, of which 25 began and 24 completed the whole trial (Figure 3). In both trials,
one individual from group B withdrew from the study before the end of the first treatment period,
and both these (n = 2) were excluded from all further analyses. CD participants had higher average
body mass index (BMI; p = 0.03) compared to the healthy participants, and there were no participants of
non-European ethnicity in the CD trial compared to eight (27.6%) of the healthy participants. The two
trial participant groups did not differ significantly by any other factors (Table 2). More details on the
characteristics and phenotypes of the CD participants can be found in the Appendix A Table A1.
Table 2. Baseline characteristics of healthy and Crohn’s disease participants who began each trial.
Group A Group B
Measure, Units
n (%) or Median (Q1, Q3) n (%) or Median (Q1, Q3)
Healthy Participants N = 15 N = 14
Male 6 (40%) 8 (57%)
Past Smoker 4 (27%) 1 (7%)
Non-European Ethnicity 4 (27%) 4 (29%)
Age, years 48.2 (26, 54) 50.9 (26.8, 54.3)
Height, cm 171 (163, 176) 173 (167, 178)
Weight, kg 69.7 (59.3, 84.1) 75.1 (58.9, 95.8)
BMI, kg/m2 23.2 (21.5, 28.0) 24.1 (21.0, 27.7)
Crohn’s Disease Participants N = 13 N = 12
Male 4 (31%) 3 (25%)
Past Smoker 3 (23%) 4 (33%)
Non-European Ethnicity 0 0
Age, years 49.0 (43.0, 58.0) 46.5 (42.0, 51.0)
Height, cm 168 (163, 179) 165 (161, 174)
Weight, kg 81.4 (75.0, 88.8) 78.1 (68.8, 81.1)
BMI, kg/m2 27.3 (23.6, 29.0) 26.6 (24.8, 30.0)
Table 3 summarizes the outcome measurements within each trial separately for each treatment
group and at each study timepoint. There were no significant differences within either trial between
group A and B at baseline (p > 0.05 for all comparisons). Comparison of the participant groups
between the two trials at baseline showed that DHA was lower on average amongst the CD participants
(p = 0.02), whilst levels of calprotectin (p < 0.001), CRP (p < 0.01), and vitamin D (p < 0.001) were all
higher on average in CD participants compared to the healthy trial participants (Table 3).
Table 4 presents results from the generalized linear mixed model analysis of the outcome measures
over the two study periods. There was evidence that the nutrient supplement intervention significantly
increased fatty acid levels compared to the placebo, with similar effect sizes in both trials for each
of EPA, DPA, DHA, and the omega-3 index (p < 0.001 for all comparisons, Table 4). There was no
evidence of a period effect for the fatty acid measures, however there was some suggestion of a potential
carry-over effect for EPA, DHA, and the resulting omega-3 index (p < 0.1 for all three models; Table 4).Nutrients 2020, 12, 1139 8 of 23
Table 3. Summary of outcome measures at each time point by group for healthy and Crohn’s disease participants.
Measure Group T1, Median (Q1, Q3) * T2, Median (Q1, Q3) T3, Median (Q1, Q3) T4, Median (Q1, Q3)
Healthy Participants (N = 29) (N = 29) (N = 28) (N = 27)
A 29.3 (23.0, 40.1) 26.6 (19.9, 32.2) 24.6 (17.4, 28.4) 66.4 (58.9, 72.6)
EPA, µg/mL
B 28.4 (22.3, 34.0) 75.6 (61.8, 106) 32.5 (27.4, 40.1) 33.8 (19.0, 40.1)
A 18.5 (14.1, 20.9) 16.0 (11.6, 18.5) 14.5 (13.1, 17.6) 21.2 (17.0, 22.5)
DPA, µg/g
B 15.9 (14.8, 19.8) 19.5 (17.1, 26.1) 16.6 (14.1, 18.5) 17.2 (14.5, 19.1)
A 63.0 (55.6, 95.3) 59.5 (51.7, 75.4) 59.9 (53.2, 71.9) 81.3 (76.4, 93.8)
DHA, µg/g
B 60.1 (42.5, 79.9) 85.7 (76.2, 101) 57.8 (52.0, 84.3) 63.3 (47.9, 71.6)
Omega-3 index (EPA + DHA), A 88.7 (80.5, 128) 86.6 (70.3, 106) 79.2 (73.9, 98.0) 156 (120, 163)
µg/mLUsing serum measures B 87.2 (72.8, 110) 162 (140, 206) 89.4 (79.5, 119) 88.8 (72.5, 122)
A 70.0 (63.0, 76.0) 62.0 (59.0, 70.0) 58.5 (49.0, 67.0) 64.0 (54.0, 68.0)
Vitamin D -25(OH)D, nmol/L
B 62.0 (56.0, 67.0) 65.0 (61.0, 75.0) 58.0 (50.0, 66.0) 46.0 (40.0, 64.0)
A 32.0 (20.4, 62.9) 25.2 (23.1, 43.9) 18.2 (10.4, 33.6) 38.0 (20.1, 49.5)
Calprotectin, µg/g
B 28.7 (20.6, 38.6) 34.6 (26.9, 59.3) 26.4 (17.4, 33.8) 24.6 (19.7, 49.7)
A 0.5 (0.5, 0.5) 0.5 (0.5, 1.0) 0.5 (0.5, 2.0) 0.5 (0.5, 0.5)
CRP, mg/L
B 0.5 (0.5, 2.0) 0.5 (0.5, 3.0) 0.5 (0.5, 1.0) 0.5 (0.5, 2.0)
Crohn’s Disease Participants (N = 24) (N = 24) (N = 24) (N = 24)
A 30.6 (26.1, 38.2) 57.0 (44.1, 60.3) 40.1 (31.5, 46.3) 69.4 (58.2, 94.0)
EPA, µg/mL
B 20.3 (17.9, 35.7) 55.7 (34.4, 68.5) 29.1 (14.8, 36.2) 54.7 (26.0, 69.5)
A 15.7 (14.2, 22.4) 20.7 (14.9, 27.2) 19.9 (14.5, 22.9) 22.6 (16.8, 29.8)
DPA, µg/g
B 14.1 (11.9, 18.4) 16.8 (14.7, 23.8) 13.1 (11.1, 21.3) 16.6 (14.2, 21.8)
A 55.1 (38.6, 69.8) 63.6 (55.2, 76.2) 59.5 (57.8, 77.3) 80.8 (71.3, 88.8)
DHA, µg/g
B 51.2 (38.7, 55.8) 71.8 (56.7, 89.7) 50.1 (36.5, 64.3) 56.8 (43.8, 75.8)
Omega-3 index (EPA + DHA), A 83.5 (74.2, 107.9) 114 (104, 149) 104 (89.0, 119) 146 (132, 184)
µg/m Using serum measures B 75.4 (54.0, 83.1) 130 (95.0, 157) 87.0 (57.2, 104) 75.4 (54.0, 83.1)
A 78.0 (73.0, 87.0) 78.0 (74.0, 95.0) 67.0 (58.0, 79.0) 68.0 (60.0, 79.0)
Vitamin D -25(OH)D, nmol/L
B 87.0 (75.0, 94.0) 85.0 (76.0, 94.0) 70.0 (60.0, 77.0) 63.0 (51.0, 69.0)
A 108 (77.3, 219) 120 (65.9, 823) 458 (140, 722) 116 (65.4, 179)
Calprotectin, µg/g
B 147 (81.7, 189) 235 (68.8, 414) 140 (48.3, 333) 121 (53.3, 709)
A 2.0 (0.9, 3.5) 1.2 (0.6, 4.5) 1.4 (0.9, 4.2) 1.3 (1.1, 4.8)
CRP, mg/L
B 1.2 (0.5, 3.8) 2.2 (0.5, 6.1) 0.8 (0.5, 4.1) 1.9 (0.5, 4.6)
* All p-values >0.05 from Kruskall–Wallis test of baseline (T1) differences between groups A and B within each trial. CRP: C-reactive protein.Nutrients 2020, 12, 1139 9 of 23
Table 4. Results for analysis of treatment effects on outcome measures using generalized linear mixed models adjusted for average baseline values.
Treatment Effect; Period Effect;
Carry-Over Effect *
LO vs. Placebo Period 2 vs. Period 1
Outcome Measure
Marginal Mean Marginal Mean Treatment-by-Period
p-Value p-value p-Value
Difference (95% CI) Difference (95% CI) Interaction (95% CI)
Healthy Participants, N = 29 **
EPA, µg/mL 47.0 (35.8, 58.3)lower values recorded in the second period of both trials, although a larger period effect was observed
amongst the CD participants (Table 3, Figure 4). There was also a statistically significant carry-over effect
for vitamin D in the CD trial (p = 0.01), indicating an insufficient wash-out period in this trial.
There were no significant treatment effects for calprotectin in either trial, although models were
imprecisely estimated
Nutrients 2020, 12, 1139 with wide confidence intervals, particularly for the CD analysis (Table 4).10Results
of 23
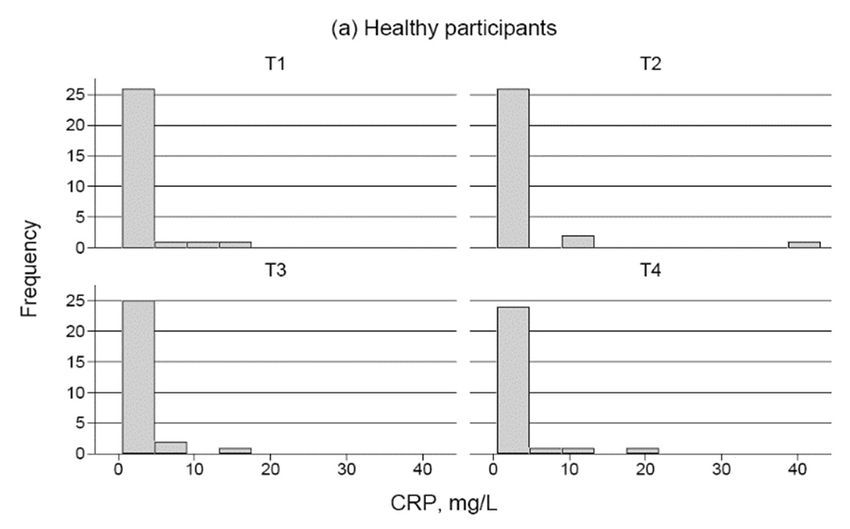
from the analysis of changes in CRP are not presented due to the high number of individuals with a CRP
level below the reference range of 0.5 mg/L, which lead to a highly skewed distribution (Appendix Figure
Table 4 shows that there was a significant treatment effect for vitamin D, with increases for the
A1) and a resulting lack of model convergence. This skew was particularly evident in the trial with healthy
nutrient supplement compared to the placebo in both trials; however the treatment effects were notably
participants, where 70.2% of CRP measurements across the trial were recorded asNutrients 2020, 12, 1139 11 of 23
using any clinically relevant cut off for CRP levels, due to the relatively low levels of CRP for the most
recorded measurements in both study populations.
4. Discussion
The significance of these results is discussed, as well as the possible effects of the MCT placebo in
the trial with healthy participants. The challenges in interpreting the results of the two inflammation
measures (CRP and calprotectin) are also highlighted.
4.1. EPA (C20:5), DHA (C22:6), and DPA (C22:5)
The results of these two trials showed that the fatty acids of interest EPA, DHA, DPA, the omega-3
index, and the vitamin D serum levels significantly increased in those taking the nutrient supplement
in both the healthy population and those with CD. The results of the first trial on healthy people
compares favorably with the results of the RCT by Minihane at al. [65], a prospective study based on
the Fish Oil Intervention and Genotype (FINGEN) study designed to investigate the responsiveness of
a range of established and putative markers of Cardiovascular disease (CVD) risk to a modest-dose
fish-oil intervention on an adult population (n = 312). This trial with each arm of an 8 week duration
and a wash-out period of 12 weeks showed that for a fish oil supplement providing 0.7 or 1.8 g EPA +
DHA/d and a placebo of 80:20 mixture of palm oil and soybean oil, plasma EPA increased by 1.3%
and 2.2% of total fatty acids, respectively, and DHA increased by 1.9% and 2.5% in total fatty acids
(all p < 0.001). The authors concluded daily doses of EPA + DHA as low as 0.7 g showed clinically
meaningful blood pressure reductions.
The systematic review in 2012, on omega-3 fatty acids RCTs and IBD by Cabré et al. [66] and a
more recent overview by Marton et al. [67] in 2019 showed the beneficial effects of omega-3 for IBD
populations. However, a number of limiting factors were highlighted in these reviews: the small
numbers in some trials, the cross-over design for trials testing for remission (which was thought to be
inappropriate considering the relapsing nature of IBD); the combinations of n-3-PUFA with prebiotics
and antioxidants; and the use of placebos such as olive oil which have shown anti-inflammatory
properties [66]. Despite these limitations taking EPA, DHA, and DPA in a nutrient supplement is
increasingly being prescribed for those with chronic conditions. These fatty acids are now being used
in specific dietary supplements in arthritis [1,14]. EPA is also being used in medical conditions such as
hypertriglyceridemia. The USA Federal Drug Agency (FDA) has approved a fish oil capsule (Lovaza)
for this purpose [12,13]. Similarly the REDUCE-IT trial showed the use of Vascepa (icosapent ethyl,
(IPE), a high-purity EPA agent) at 2 g twice a day was effective for the reduction of triglycerides in those
with known cardiac disease or at high risk of developing it [68]. EpaNova (omega-3 carboxylic acids)
is another formulation that the ‘STRENGTH’ Trial [69] used to reduce the risk of major cardiovascular
events in patients with mixed dyslipidemia. However, the latter was very recently discontinued as
results were showing a lack of benefit to patients [70].
These trials show omega-3 fatty acids can have a positive impact on people’s health. Therefore it
is important that studies on omega-3 nutrient supplements continue in IBD populations so that the
most optimal formulation and effective dose for a supplement containing EPA, DHA, and DPA, and
also with additions like vitamin D can be found and for whom it would provide the most benefit.
In vitro models have shown that these fatty acids can have an effect on the tight junctions associated
with the gut wall. EPA and DHA were shown to change the lipid environment in the membrane
micro-domains of tight junctions, preventing occluding (essential for tight junction stability and
maintaining barrier function), Zonula occludens-1 (ZO-1) redistribution, and the distortion of tight
junction morphology [71]. These fatty acids also reduced Interferon-gamma (IFN-γ) and tumor necrosis
factor (TNF)-alpha induced transepithelial electrical resistance [72]. CD is associated with defects in
tight junctions, therefore these fatty acids may help improve the barrier function of people with this
disease. In studies with cancer induced cachexia, which is thought to be associated with intestinalNutrients 2020, 12, 1139 12 of 23
permeability and endotoxemia, therapeutic interventions with EPA were associated with improved
intestinal function and reduced inflammation [73].
People with IBD also show higher risk for bone loss than the general population [74]. EPA acid
derived resolvin E1 (RvE1) has been associated with prevention of bone loss and the induction of
bone generation. In a study using chemR23 transgenic (tg) mice, overexpressing the RvE1 receptor
(chemR23) on leukocytes, it was found that induced alveolar bone loss was lessened when compared
with wild type mice (p < 0.05). In the treatment of the parietal bone in vivo from a uniform craniotomy,
regeneration of the bone defect was also significantly enhanced both for wild type and chemR23tg (tg)
mice [75]. Kajarabille et al. noted in their review that n-3-PUFA affect the receptor activator of Nuclear
factor kappa-light-chain-enhancer of activated B cells Rank (NF-κβ Rank). This receptor is located on
the osteoclast and causes bone resorption, which directs osteoclast formation [76].
A study by Trebble et al. also showed that the addition of fish-oil plus antioxidants was associated
with higher EPA and DHA incorporation into peripheral blood mononuclear cells (PBMCs; p < 0.001)
and lower arachidonic acid (p < 0.006). There was also lower production of Interferon-gamma (IFN-γ;
p < 0.012) and of Prostaglandin E2 (PGE (2); p < 0.047) [77].
4.2. Omega-3 Index
When the data for the omega-3 index, (measured in serum in these trials) were summarized,
the results showed a significant increase when both groups took the nutrient supplement (Table 3).
This index, instigated by Harris and Von Schacky in 2004 was originally used as a risk factor for coronary
heart disease [78]. Since its original conception, it has also been applied to cognitive impairment in
the elderly, schizophrenia and depression [79–82], cardiovascular disease [83–87], and also on cancer.
Outcomes of these and other clinical trials have led health authorities to recommend consumption of
oily fish at least twice a week [88–90]. Others recommend daily supplementation for those people with
coronary heart disease (1 g) and those with hypertriglyceridemia (4 g) [91]. Despite the number of
clinical trials studies reviewing omega-3 fatty acids, not all come to the same conclusion. Studies such as
the OPERA study (n = 1516) and the ORIGIN trial (n = 12,536) and another by The Risk and Prevention
Study Collaborative Group on cardiac risk factors (n = 12,513), failed to show any benefit [87,92,93].
In the review by Mori [94] it was suggested that a number of factors could have contributed to this.
Examples of these were: using doses of omega-3 lower than 800–900 mg, the presence of confounding
comorbidities, medication interactions, or people already having a high intake of omega-3 through
their diet. The confounding factors which may have affected the more recent studies, have in this
study, been accounted for in the study design. Moreover, the FAMEs analysis, which detects the
extent to which an increase in the fatty acid is taken up and utilized, showed that this indeed occurred
significantly for EPA, DPA, and DHA.
4.3. Vitamin D
Vitamin D serum levels significantly increased in the healthy population (10.00 nmol/L average
increase for treatment vs. placebo; 95% CI: 3.34–13.67) and CD groups (4.69 nmol/L; 95% CI: 0.53 to
8.86) (Table 4) when they were on the nutrient intervention, implying that this source of vitamin D
(1000 IU daily) could be useful for people with low vitamin D levels. A larger dose of vitamin D
(2000 IU) may have increased vitamin D serum levels more. The Czech IBD interventional study by
Kojecký et al. [95] (abstract available only), where the local recommended dose is 600 IU/day, showed
that an average dose 1820 IU vitamin D/day increased the vitamin D levels of their IBD participants
from 60.2 ± 26.5 nmol/L to 68.1 ± 27.1 nmol/L (p < 0.001). In contrast, in the NZ study CD participants
had vitamin D levels well above this when they began their supplementation: Group A (placebo then
supplement), 78.0 nmol/L; Group B (supplement then placebo), 87.0 nmol/L (Table 3).
Vitamin D is one of the fat soluble vitamins, with the others being vitamins A, E, and K [96].
Although it can be sourced from food (hence the description of vitamin) its main source is sunlight [97].
However, many people do not have enough exposure to sunlight. This could be because they liveNutrients 2020, 12, 1139 13 of 23
mainly indoors, or at a latitude where sunlight sources of vitamin D are diminished (i.e., not in the
ultraviolet (UV) range of 290–313 nm), especially during winter, when they are outside, or due to their
use of sun block. With sun exposure in the appropriate UV range, the skin absorbs vitamin D and
triggers its production endogenously [98].
The recent VITamin D and OmegA-3 TriaL (VITAL), an RCT, using a nutrient supplement with a
daily vitamin D (2000 IU) and marine omega-3 fatty acids (1 g) to identify whether it reduced the risk
of cancer or cardiovascular disease, indicated that vitamin D reduced total cancer mortality but it did
not significantly reduce major CVD events or all-cause mortality. The updated metanalysis suggested
there needed to be more research to determine which individuals would derive the most benefit from
the supplement. [99]. Exploring the genetic profile of participants may identify these individuals.
Some research suggests that sufficient levels of vitamin D may also protect against the development
of IBD [100], and a recent study by Janssen et al. showed that increasing vitamin D concentrations
was associated with improved CD activity [101]. Metabolites of vitamin D act on anti-inflammatory
pathways and are involved in the maintaining the tight junctions between the epithelial cells of the
intestine [102,103]. There is also emerging evidence that vitamin D supplementation could diminish
the risk of influenza and COVID-19 infections and deaths [104]. Vitamin D supplementation could be
particularly important for populations that are immune suppressed, such as those with IBD. A study
by Arihiro et al. may endorse this. In their double blind RCT with vitamin D supplementation (500 IU)
in patients with CD (n = 55), they found the incidence of upper respiratory infection was lowered in
those who had low vitamin D levels (Nutrients 2020, 12, 1139 14 of 23
A study (N = 24) on equal numbers of healthy men and women compared two different lipid carriers
for vitamin D3 (peanut oil and an MCT). Vitamin D3 absorption was significantly higher with peanut
oil than with MCTs in both fasting and non-fasting states [113]. For this reason, and because MCT
appeared to also affect the fatty acid levels, MCT was not used as a control supplement in the trial with
CD participants and a refined fish oil was used instead [37].
In the trial of people with CD, vitamin D serum levels significantly increased in both groups when
the nutrition supplement was taken (Table 3, Figure 4). When participants began the phase of the trial
where they received the nutrient supplement, two people were deficient (with 39 nmol/L and 46 nmol/L
respectively) but both moved into the recommended range after six weeks of nutrient supplementation.
In the control group, all participants started in the recommended range but two dropped below the
recommended range by the end of six weeks exposure to the refined fish oil (33 nmol/L and 49 nmol/L
respectively. This suggests that the nutrient supplement was able to maintain the recommended levels
of vitamin D even though sunshine hours were decreasing. Of note, the group of participants with CD
began with higher average levels of vitamin D (83.3 nmol/L) than the group of healthy participants
who began with an average of 66.35 nmol/L, even though both groups began their trials at the same
time of the year. That there was a significant carry-over effect present in the vitamin D analysis for the
CD trial (p = 0.01) and borderline carry-over effect in the healthy trial (although this did not reach
statistical significance, p = 0.06) would suggest that the washout period was not long enough in second
trial with CD participants even though the washout period was extended from four to six weeks.
The half-life of vitamin D is 15 days [96,114].
The age range in both trial groups was also similar. In the healthy group, the median ages were
48.2 and 50.9 years for the initial intervention and control group respectively, and of the CD group
were 49 and 46.5 years respectively. As people age, their ability to metabolize vitamin D from sunlight
decreases. Aging has been reported to decrease the capacity of the skin to produce pre-vitamin D3 by
greater than two-fold [115,116]. Skin color also affects the ability of the skin to absorb vitamin D. In the
healthy group, three people described their ethic group as Chinese, European Zimbabwean, or NZ
Māori European, respectively. These participants may have had more melanin pigmentation in their
skin, which would decrease their capacity to absorb vitamin D from sunlight. There may also have
been genetic variant differences with respect to the genes involved in vitamin D metabolism in the
healthy group. This would have lowered the absorption of vitamin D and decreased their measured
vitamin D levels [117]. From the results of the trial with CD participants, it appears that in this sample
of people with CD, while on the nutrient supplement, their vitamin D levels were well within the
recommended range.
4.4. CRP
C-reactive protein (CRP) is produced in the liver and blood concentrations are used as an indicator
of inflammation in the body. It is an acute phase reactant and rising levels are used regularly as an
indicator of inflammatory conditions such as infections, atherosclerosis, heart disease, and rheumatoid
arthritis [118,119]. For both trials, CPR < 0.5 mg/L was considered to be in the healthy range.
The high-sensitivity (hs) CRP test, which is often used to check for risk of heart disease, was not
used in these two trials. No formal analyses for CRP were presented here due to issues with model
convergence and low statistical power. However, from the summaries of CRP measurements across
the time points in the two trials, it appeared that the nutrient supplement did not have any clear effects
with respect to inflammation as measured by CRP. The majority of people in both trials had CRP levels
that indicated they were in a non-inflammatory state.
4.5. Calprotectin
Calprotectin is a key protein found in the intracellular fluid of inflammatory cells and can be
measured in the feces as an indicator of the migration of neutrophils through the bowel wall to the
fecal material [120]. In this study, comparisons of the two participant groups at baseline showedNutrients 2020, 12, 1139 15 of 23 that levels of calprotectin were higher on average in CD participants (Table 2). In the CD group, fifty percent of the participants had calprotectin scores in the normal or clinically inactive range. Scores for calprotectin are: normal,
Nutrients 2020, 12, 1139                                                                                         16 of 23

Acknowledgments: We convey our sincere thanks to the participants who enrolled in the trials to assess the
nutrient supplement.
Conflicts of Interest: The authors declare they have no conflict of interest.

 Nutrients 2020,
Appendix      A12, x FOR PEER REVIEW                                                                          17 of 23

 Appendix A            Table A1. Characteristics of the participants in the Crohn’s disease trial.

                           Demographics                                              Phenotypes
                        Table A1. Characteristics of the participants in the Crohn’s disease trial.
                                     Number          %             Disease Location          Number      %
                       Demographics                                                   Phenotypes
            Gender         Male         7            28                            OGD          0         0
                          Female       Number
                                       17            68%             Disease Location
                                                                                 Jejunal        1   Number4    %
       Gender           Male               7           28                             OGD             0         0
              Age of diagnosis                        %                            Ileal        9        36
                       Female             17           68                            Jejunal          1         4
                         40
                      history
                          (A3)             1            4                          Anal
                                                                                     Rectal     1     1 4       4
            Family history Yes          3            12           Disease Behaviour   Anal            1         4
                         YesNo          5 3          2012                     Inflammatory 13
                                                                     Disease Behaviour                   52
                          Missing
                         No            17 5          6820                       Stenotic
                                                                                Inflammatory   10     13 40    52
               SmokingMissing
                        status              17         68                      Stenotic
                                                                          Fistulating        4       10 16     40
                          Smoker
             Smoking status               2           8                    Peri-anal
                                                                             Fistulating     4       4 16      16
                        Ex-smoker
                      Smoker             7 2         288                     Other
                                                                              Peri-anal      0       4 0       16
                        Non-smoker
                    Ex-smoker            16 7        6428      Surgery       None
                                                                                Other        9       0 36       0
                    Non-smoker
                     Infant History         16         64     Surgery           None
                                                                              Yes           17       9 68      36
                    Infant History                                               Yes                 17        68
                  Breast fed         15        63               EIM/Other disorders
               Breast fedSection
              Caesarean               1 15     463                EIM/Other disorders
                                                                             Joints          4          17
            Caesarean Section           1        4                              Joints                4        17
                Abbreviation:                                                 Skin           3          13
             Abbreviation:                                                       Skin                 3        13
                OGD: Oesophagogastroduodenoscopy                              Eyes           0           0
            OGD: Oesophagogastroduodenoscopy                                     Eyes                 0         0

      Figure
       Figure A1.  Distributionofof
               A1. Distribution     C-reactive
                                  C-reactive    protein
                                             protein    (CRP)
                                                     (CRP)     measurements
                                                           measurements         in healthy
                                                                        in the (a) the (a) healthy  and (b)disease
                                                                                           and (b) Crohn’s  Crohn’s
       trials.
      disease trials.
Nutrients 2020, 12, 1139 17 of 23
References
1. Calder, P.C. Omega-3 Polyunsaturated Fatty Acids and Inflammatory Processes: Nutrition Or Pharmacology?
Br. J. Clin. Pharmacol. 2013, 75, 645–662. [CrossRef]
2. Zhang, W.; Wang, H.; Zhang, H.; Leak, R.K.; Shi, Y.; Hu, X.; Gao, Y.; Chen, J. Dietary Supplementation
with Omega-3 Polyunsaturated Fatty Acids Robustly Promotes Neurovascular Restorative Dynamics and
Improves Neurological Functions After Stroke. Exp. Neurol. 2015, 272, 170–180. [CrossRef]
3. Cao, J.J.; Gregoire, B.R.; Michelsen, K.G.; Picklo, M.J. Increasing Dietary Fish Oil Reduces Adiposity and
Mitigates Bone Deterioration in Growing C57BL/6 Mice Fed a High-Fat Diet. J. Nutr. 2020, 150, 99–107.
[CrossRef]
4. Berquin, I.M.; Edwards, I.J.; Chen, Y.Q. Multi-Targeted Therapy of Cancer by Omega-3 Fatty Acids. Cancer Lett.
2008, 269, 363–377. [CrossRef] [PubMed]
5. Massaro, M.; Scoditti, E.; Carluccio, M.A.; Montinari, M.R.; De Caterina, R. Omega-3 Fatty Acids, Inflammation
and Angiogenesis: Nutrigenomic Effects as an Explanation for Anti-Atherogenic and Anti-Inflammatory
Effects of Fish and Fish Oils. J. Nutrigenet. Nutr. 2008, 1, 4–23. [CrossRef] [PubMed]
6. De Lorgeril, M.; Salen, P. New Insights into the Health Effects of Dietary Saturated and Omega-6 and
Omega-3 Polyunsaturated Fatty Acids. BMC Med. 2012, 10, 50. [CrossRef] [PubMed]
7. Patterson, E.; Wall, R.; Fitzgerald, G.; Ross, R.; Stanton, C. Health Implications of High Dietary Omega-6
Polyunsaturated Fatty Acids. J. Nutr. Metab. 2012, 2012, 539426. [CrossRef] [PubMed]
8. Park, J.; Kwon, S.; Han, Y.; Hahm, K.; Kim, E. Omega-3 Polyunsaturated Fatty Acids as Potential
Chemopreventive Agent for Gastrointestinal Cancer. J. Cancer Prev. 2013, 18, 201. [CrossRef] [PubMed]
9. Thomas, J.; Thomas, C.; Radcliffe, J.; Itsiopoulos, C. Omega-3 Fatty Acids in Early Prevention of Inflammatory
Neurodegenerative Disease: A Focus on Alzheimer’s Disease. BioMed Res. Int. 2015, 2015, 172801. [CrossRef]
[PubMed]
10. Ardisson Korat, A.V.; Malik, V.S.; Furtado, J.D.; Sacks, F.; Rosner, B.; Rexrode, K.M.; Willett, W.C.;
Mozaffarian, D.; Hu, F.B.; Sun, Q. Circulating very-Long-Chain SFA Concentrations are Inversely Associated
with Incident Type 2 Diabetes in US Men and Women. J. Nutr. 2020, 150, 340–349. [CrossRef]
11. Fletcher, J.; Cooper, S.C.; Ghosh, S.; Hewison, M. The Role of Vitamin D in Inflammatory Bowel Disease:
Mechanism to Management. Nutrients 2019, 11, 1019. [CrossRef] [PubMed]
12. Koski, R.R. Omega-3-Acid Ethyl Esters (Lovaza) for Severe Hypertriglyceridemia. Pharm. Ther. 2008, 33, 271.
13. National Institutes of Health. Omega-3 Fatty Acids. 2019. Available online: https://ods.od.nih.gov/factsheets/
Omega3FattyAcids-HealthProfessional/ (accessed on 19 April 2019).
14. Yates, C.M.; Calder, P.C.; Rainger, G. Pharmacology and Therapeutics of Omega-3 Polyunsaturated Fatty
Acids in Chronic Inflammatory Disease. Pharmacol. Ther. 2014, 141, 272–282. [CrossRef] [PubMed]
15. Serhan, C.N.; Chiang, N.; Dalli, J.; Levy, B.D. Lipid Mediators in the Resolution of Inflammation. Cold Spring
Harb Perspect. Biol. 2014, 7, a016311. [CrossRef] [PubMed]
16. Harris, W.S. The Omega-3 Index as a Risk Factor for Coronary Heart Disease. Am. J. Clin. Nutr. 2008, 87,
1997S–2002S. [CrossRef] [PubMed]
17. von Schacky, C. A Review of Omega-3 Ethyl Esters for Cardiovascular Prevention and Treatment of Increased
Blood Triglyceride Levels. Vasc. Health Risk Manag. 2006, 2, 251–262. [CrossRef] [PubMed]
18. Yin, K.; Agrawal, D.K. Vitamin D and Inflammatory Diseases. J. Inflamm. Res. 2014, 7, 69.
19. Gocek, E.; Studzinski, G.P. Vitamin D and Differentiation in Cancer. Crit. Rev. Clin. Lab. Sci. 2009, 46,
190–209. [CrossRef]
20. Haussler, M.R.; Whitfield, G.K.; Kaneko, I.; Haussler, C.A.; Hsieh, D.; Hsieh, J.; Jurutka, P.W. Molecular
Mechanisms of Vitamin D Action. Calcif. Tissue Int. 2013, 92, 77–98. [CrossRef]
21. Holick, M. (Ed.) Vitamin D and Health: Evolution, Biologic Functions, and Recommended Dietary Intakes for
Vitamin D Chapter 1, 2nd ed.; Springer Science & Business Media, Springer Nature Switzerland AG: Basel,
Switzerland, 2010; pp. 3–34.
22. Vimaleswaran, K.S.; Cavadino, A.; Berry, D.J.; Jorde, R.; Dieffenbach, A.K.; Lu, C.; Alves, A.C.;
Heerspink, H.J.L.; Tikkanen, E.; Eriksson, J. Association of Vitamin D Status with Arterial Blood Pressure
and Hypertension Risk: A Mendelian Randomisation Study. Lancet Diabetes Endocrinol. 2014, 2, 719–729.
[CrossRef]Nutrients 2020, 12, 1139 18 of 23
23. Anderson, J.L.; May, H.T.; Horne, B.D.; Bair, T.L.; Hall, N.L.; Carlquist, J.F.; Lappé, D.L.; Muhlestein, J.B.;
Intermountain Heart Collaborative IHC Study Group. Relation of Vitamin D Deficiency to Cardiovascular
Risk Factors, Disease Status, and Incident Events in a General Healthcare Population. Am. J. Cardiol. 2010,
106, 963–968. [CrossRef] [PubMed]
24. Wu, S.; Liao, A.P.; Xia, Y.; Li, Y.C.; Li, J.; Sartor, R.B.; Sun, J. Vitamin D Receptor Negatively Regulates
Bacterial-Stimulated NF-κB Activity in Intestine. Am. J. Pathol. 2010, 177, 686–697. [CrossRef] [PubMed]
25. Cheung, F.S.; Lovicu, F.J.; Reichardt, J.K. Current Progress in using Vitamin D and its Analogs for Cancer
Prevention and Treatment. Expert Rev. Anti. Infect. Ther. 2012, 12, 811–837. [CrossRef] [PubMed]
26. Krishnan, A.V.; Trump, D.L.; Johnson, C.S.; Feldman, D. The Role of Vitamin D in Cancer Prevention and
Treatment. Endocrinol. Metab. Clin. N. Am. 2010, 39, 401–418. [CrossRef] [PubMed]
27. Leyssens, C.; Verlinden, L.; Verstuyf, A. Antineoplastic Effects of 1,25(OH)2D3 and its Analogs in Breast,
Prostate and Colorectal Cancer. Endocr. Relat. Cancer 2013, 20, R31–R47. [CrossRef]
28. Mehta, R.G.; Peng, X.; Alimirah, F.; Murillo, G.; Mehta, R. Vitamin D and Breast Cancer: Emerging Concepts.
Cancer Lett. 2013, 334, 95–100. [CrossRef]
29. Pereira, F.; Larriba, M.J.; Munoz, A. Vitamin D and Colon Cancer. Endocr. Relat. Cancer 2012, 19, R51–R71.
[CrossRef]
30. Tang, J.Y.; Fu, T.; Lau, C.; Oh, D.H.; Bikle, D.D.; Asgari, M.M. Vitamin D in Cutaneous Carcinogenesis: Part, I.
J. Am. Acad. Dermatol. 2012, 67, 803.e1–803.e12. [CrossRef]
31. Trump, D.L.; Deeb, K.K.; Johnson, C.S. Vitamin D: Considerations in the Continued Development as an
Agent for Cancer Prevention and Therapy. Cancer J. 2010, 16, 1–9. [CrossRef]
32. Wang, T.; Dabbas, B.; Laperriere, D.; Bitton, A.J.; Soualhine, H.; Tavera-Mendoza, L.E.; Dionne, S.;
Servant, M.J.; Bitton, A.; Seidman, E.G. Direct and Indirect Induction by 1, 25-Dihydroxyvitamin D3
of the NOD2/CARD15-Defensin B2 Innate Immune Pathway Defective in Crohn Disease. J. Biol. Chem. 2010,
285, 2227–2231. [CrossRef]
33. Sands, B.E. Biomarkers of Inflammation in Inflammatory Bowel Disease. Gastroenterology 2015, 149,
1275–1285.e2. [CrossRef] [PubMed]
34. van Rheenen, P.F.; Van de Vijver, E.; Fidler, V. Faecal Calprotectin for Screening of Patients with Suspected
Inflammatory Bowel Disease: Diagnostic Meta-Analysis. BMJ 2010, 341, c3369. [CrossRef] [PubMed]
35. Schoepfer, A.M.; Beglinger, C.; Straumann, A.; Trummler, M.; Vavricka, S.R.; Bruegger, L.E.; Seibold, F. Fecal
Calprotectin Correlates More Closely with the Simple Endoscopic Score for Crohn’s Disease (SES-CD) than
CRP, Blood Leukocytes, and the CDAI. Am. J. Gastroenterol. 2010, 105, 162–169. [CrossRef] [PubMed]
36. Australian New Zealand Clinical Trials Registry. Effects of a Combined Vitamin D, Omega 3, Co-Enzyme
Q10, Zeaxanthin, Lutein and Astaxanthin Supplement (Lester’s Oil) on Healthy People. 2016. Available
online: http://www.ANZCTR.org.au/ACTRN12616001316493.aspx (accessed on 28 September 2019).
37. Ferguson, L.; Laing, B.; Ellett, S. Medium Chain Triglyceride Oil, an Intended Placebo with Unexpected
Adverse Effects. Ann. Clin. Lab. Res. 2016, 4. [CrossRef]
38. Turpeinen, A.; Merimaa, P. Functional Foods, 2nd ed.; Saarela, M., Ed.; Woodhead Publishing: Sawston
Cambridge, UK, 2011; pp. 383–400.
39. Marten, B.; Pfeuffer, M.; Schrezenmeir, J. Medium-Chain Triglycerides. Int. Dairy J. 2006, 16, 1374–1382.
[CrossRef]
40. Tsai, Y.; Park, S.; Kovacic, J.; Snook, J.T. Mechanisms Mediating Lipoprotein Responses to Diets with
Medium-Chain Triglyceride and Lauric Acid. Lipids 1999, 34, 895–905. [CrossRef]
41. Ozturk, B.; Argin, S.; Ozilgen, M.; McClements, D.J. Nanoemulsion Delivery Systems for Oil-Soluble Vitamins:
Influence of Carrier Oil Type on Lipid Digestion and Vitamin D 3 Bioaccessibility. Food Chem. 2015, 187,
499–506. [CrossRef]
42. Boisrame-Helms, J.; Said, A.; Burban, M.; Delabranche, X.; Stiel, L.; Zobairi, F.; Hasselmann, M.;
Schini-Kerth, V.; Toti, F.; Meziani, F. Medium-Chain Triglyceride Supplementation Exacerbates
Peritonitis-Induced Septic Shock in Rats: Role on Cell Membrane Remodeling. Shock 2014, 42, 548–553.
[CrossRef]Nutrients 2020, 12, 1139 19 of 23
43. Traul, K.; Driedger, A.; Ingle, D.; Nakhasi, D. Review of the Toxicologic Properties of Medium-Chain
Triglycerides. Food Chem. Toxicol. 2000, 38, 79–98. [CrossRef]
44. Jørgensen, S.P.; Agnholt, J.; Glerup, H.; Lyhne, S.; Villadsen, G.E.; Hvas, C.L.; Bartels, L.E.; Kelsen, J.;
Christensen, L.A.; Dahlerup, J.F. Clinical Trial: Vitamin D3 Treatment in Crohn’s Disease–A Randomized
Double-blind Placebo-controlled Study. Aliment. Pharmacol. Ther. 2010, 32, 377–383. [CrossRef]
45. Thies, F.; Nebe-von-Caron, G.; Powell, J.R.; Yaqoob, P.; Newsholme, E.A.; Calder, P.C. Dietary Supplementation
with Eicosapentaenoic Acid, but Not with Other Long-Chain N-3 Or N-6 Polyunsaturated Fatty Acids,
Decreases Natural Killer Cell Activity in Healthy Subjects Aged >55 Y. Am. J. Clin. Nutr. 2001, 73, 539–548.
[CrossRef] [PubMed]
46. Katan, M.B.; Deslypere, J.P.; van Birgelen, A.P.; Penders, M.; Zegwaard, M. Kinetics of the Incorporation
of Dietary Fatty Acids into Serum Cholesteryl Esters, Erythrocyte Membranes, and Adipose Tissue: An
18-Month Controlled Study. J. Lipid Res. 1997, 38, 2012–2022. [PubMed]
47. Arterburn, L.M.; Hall, E.B.; Oken, H. Distribution, Interconversion, and Dose Response of N-3 Fatty Acids in
Humans. Am. J. Clin. Nutr. 2006, 83, 1467S–1476S. [CrossRef] [PubMed]
48. Subbaiah, P.V.; Kaufman, D.; Bagdade, J.D. Incorporation of Dietary N-3 Fatty Acids into Molecular Species
of Phosphatidyl Choline and Cholesteryl Ester in Normal Human Plasma. Am. J. Clin. Nutr. 1993, 58,
360–368. [CrossRef] [PubMed]
49. Beermann, C.; Jelinek, J.; Reinecker, T.; Hauenschild, A.; Boehm, G.; Klör, H. Short Term Effects of Dietary
Medium-Chain Fatty Acids and N-3 Long-Chain Polyunsaturated Fatty Acids on the Fat Metabolism of
Healthy Volunteers. Lipids Health Dis. 2003, 2, 10. [CrossRef] [PubMed]
50. Turner, J.R. Intestinal Mucosal Barrier Function in Health and Disease. Nat. Rev. Immunol. 2009, 9, 799–809.
[CrossRef]
51. Duvall, M.G.; Levy, B.D. DHA-and EPA-Derived Resolvins, Protectins, and Maresins in Airway Inflammation.
Eur. J. Pharmacol. 2016, 785, 144–155. [CrossRef]
52. Vanden, H.J. Nutrigenomics and Nutrigenetics of Ω3 Polyunsaturated Fatty Acids. Prog. Mol. Biol. Transl. Sci.
2011, 108, 75–112.
53. Calon, F.; Cole, G. Neuroprotective Action of Omega-3 Polyunsaturated Fatty Acids Against
Neurodegenerative Diseases: Evidence from Animal Studies. Prostaglandins Leukot Essent Fatty Acids
2007, 77, 287–293. [CrossRef]
54. Varnalidis, I.; Ioannidis, O.; Karamanavi, E.; Ampas, Z.; Poutahidis, T.; Taitzoglou, I.; Paraskevas, G.;
Botsios, D. Omega 3 Fatty Acids Supplementation has an Ameliorative Effect in Experimental Ulcerative
Colitis Despite Increased Colonic Neutrophil Infiltration. Rev. Esp. Enferm. Dig. 2011, 103, 511. [CrossRef]
55. Miller, E.; Kaur, G.; Larsen, A.; Loh, S.P.; Linderborg, K.; Weisinger, H.S.; Turchini, G.M.; Cameron-Smith, D.;
Sinclair, A.J. A Short-Term N-3 DPA Supplementation Study in Humans. Eur. J. Nutr. 2013, 52, 895–904.
[CrossRef] [PubMed]
56. Kaur, G.; Sinclair, A. Omega-3 Docosapentaenoic Acid (DPA): What is Known? Did EPA and DHA
Overshadow the Health Benefits of DPA? 2012. Available online: http://www.nutritionremarks.com/2012/01/
23/omega-3-docosapentaenoic-acid-dpa-what-is-known-3/ (accessed on 16 June 2019).
57. AgResearch. FAMEs Analysis. 2020. Available online: https://www.agresearch.o.nz/ (accessed on
10 March 2020).
58. Mok, H.J.; Lee, J.W.; Bandu, R.; Kang, H.S.; Kim, K.; Kim, K.P. A Rapid and Sensitive Profiling of Free Fatty
Acids using Liquid Chromatography Electrospray Ionization Tandem Mass Spectrometry (LC/ESI-MS/MS)
After Chemical Derivatization. RSC Adv. 2016, 6, 32130–32139. [CrossRef]
59. Maunsell, Z.; Wright, D.J.; Rainbow, S.J. Routine Isotope-Dilution Liquid Chromatography-Tandem Mass
Spectrometry Assay for Simultaneous Measurement of the 25-Hydroxy Metabolites of Vitamins D2 and D3.
Clin. Chem. 2005, 51, 1683–1690. [CrossRef] [PubMed]
60. Ferguson, L.R.; Laing, B.; Marlow, G.; Bishop, K. The Role of Vitamin D in Reducing Gastrointestinal Disease
Risk and Assessment of Individual Dietary Intake Needs: Focus on Genetic and Genomic Technologies. Mol.
Nutr. Food Res. 2016, 60, 119–133. [CrossRef] [PubMed]You can also read