Effects of extreme temperature on China's tea production - IOPscience
←
→
Page content transcription
If your browser does not render page correctly, please read the page content below
LETTER • OPEN ACCESS

Effects of extreme temperature on China’s tea production
To cite this article: Yulin Yan et al 2021 Environ. Res. Lett. 16 044040

View the article online for updates and enhancements.

                                This content was downloaded from IP address 46.4.80.155 on 10/04/2021 at 15:46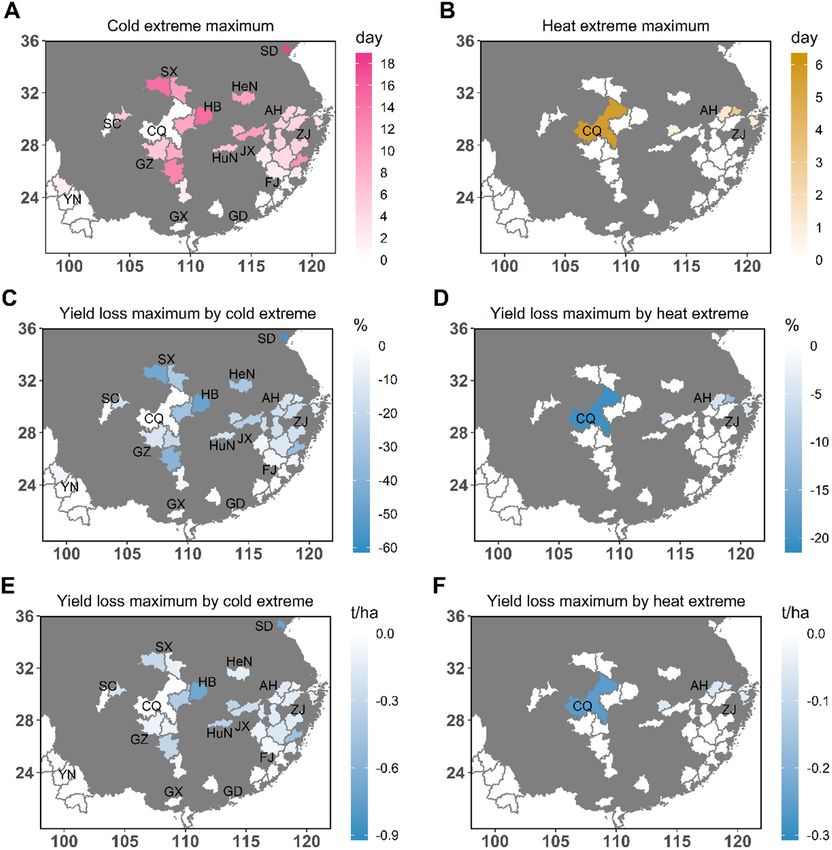
Environ. Res. Lett. 16 (2021) 044040 https://doi.org/10.1088/1748-9326/abede6
LETTER
Effects of extreme temperature on China’s tea production
OPEN ACCESS
Yulin Yan1, Sujong Jeong2,∗, Chang-Eui Park2, Nathaniel D Mueller3,4, Shilong Piao5,
RECEIVED Hoonyoung Park2, Jaewon Joo2, Xing Chen2, Xuhui Wang5, Junguo Liu6 and Chunmiao Zheng6,∗
21 June 2020
1
REVISED
Interdisciplinary Program in Agricultural and Forest Meteorology, Seoul National University, Seoul, Republic of Korea
2
22 February 2021 Department of Environmental Planning, Graduate School of Environmental Studies, Seoul National University, Seoul 08826 Republic
of Korea
ACCEPTED FOR PUBLICATION 3
11 March 2021 Department of Ecosystem Science and Sustainability, Colorado State University, Fort Collins, CO, United States of America
4
Department of Soil and Crop Sciences, Colorado State University, Fort Collins, CO, United States of America
PUBLISHED 5
Sino-French Institute for Earth System Science, Peking University, Beijing, People’s Republic of China
30 March 2021 6
School of Environmental Science and Engineering, Southern University of Science and Technology, Shenzhen 518055 People’s Republic
of China
∗
Original content from
Authors to whom any correspondence should be addressed.
this work may be used
under the terms of the E-mail: sujong@snu.ac.kr and zhengcm@sustech.edu.cn
Creative Commons
Attribution 4.0 licence. Keywords: tea production, extreme temperature, climate warming
Any further distribution
of this work must Supplementary material for this article is available online
maintain attribution to
the author(s) and the title
of the work, journal
citation and DOI. Abstract
The production of tea (Camellia sinensis (L.) Kuntze), the world’s second most consumed beverage,
is susceptible to extreme weather events. However, our understanding about the impacts of
extreme temperatures and climate change on tea yields remains fairly limited. Here we quantify the
historical and predict future fluctuations in tea yield caused by extreme temperatures in China, the
largest tea producing country. We found that both heat and cold extremes were associated with
significantly reduced tea yields. In the present climate, dominating cold extremes influence more
than half of China’s tea production, with a maximum of 56.3% reduced annual production. In the
near future, we predict positive net impacts of climate change on tea yield in all study regions at
both the 1.5 ◦ C and 2.0 ◦ C global warming levels. Climate warming may diminish the negative
impacts of cold extremes to 14%, especially at the current most affected northern tea growing
regions (>28◦ N). However, new areas of yield reduction by intensified heat extremes will emerge,
up to 14%–26% yield losses estimated at the Yangtze River (∼30◦ N) and southern China
(
Environ. Res. Lett. 16 (2021) 044040                                                                     Y Yan et al

80 million people are involved in the tea industry        fine-resolution, prefecture-scale tea production data-
across China, and it is a major source of income for      set and merged it with weather data; this panel data-
smallholder farmers, especially in the major tea grow-    set covers most of the tea growing regions in China
ing regions of southern China [9, 14, 16]. In China,      (figure 1(B)). Then we developed a regression model
farmers usually pluck newly emerged tea leaves and        approach to analyze the nonlinear responses of tea
buds several times from early spring (early before        yield to historical weather variability. A total of 21
Qingming Festival) to late autumn [17], such as in        global climate models (GCMs) were used to estim-
the renowned green tea production region Zhejiang         ate future temperature extremes and their consequent
province [18]. Based on how the leaves are processed      impacts on tea yields under the 1.5 ◦ C and 2.0 ◦ C
after harvesting, tea beverages can be classified as      warming scenarios.
white, green, black, yellow, dark, and wulong [19, 20].
The postprocessing decision is mainly related to the      2. Methods and materials
local tea cultivars, cultures, traditions, and economic
factors.                                                  2.1. Study area
    Despite the vital importance of tea in China,         The major tea growing regions in mainland China
research efforts to understand the impacts of climate     are around 20◦ –37◦ N, 98◦ –121◦ E [9]. After con-
change on tea production are considerably limited.        sidering data availability and quality, we selected 41
Unfavorable weather conditions can be detrimental         prefectural cities and 1 municipality as our study
to tea crop production and substantially reduce yields    areas (figure 1(B)). The area investigated represented
and quality [11, 21–25]. Tea yield has declined as        around 70% of national tea production in 2016. The
the climate has warmed in India, especially when          41 prefectural cities include variable climate condi-
the monthly temperature exceeds ∼27 ◦ C [21]. In          tions and are distributed across 14 provinces: Anhui
Sri Lanka, a monthly mean temperature higher than         (AH), Fujian (FJ), Guangdong (GD), Guangxi (GX),
22 ◦ C is thought to reduce tea productivity [22]. In     Guizhou (GZ), Hubei (HB), Henan (HeN), Hunan
China, monsoon dynamics affected harvest timing           (HuN), Jiangxi (JX), Sichuan (SC), Shandong (SD),
decisions and reduced tea productivity by ∼0.5% for       Shaanxi (SX), Yunnan (YN) and Zhejiang (ZJ).
a 1% increase in the monsoon season retreat date [9].
In southwest and east China, tea quality deteriorated
due to rising temperatures and drought events [11,        2.2. Tea yield and cultivation area data
24, 25]. Furthermore, heat extremes where the daily       We collected the tea production data for the years
maximum temperature reaches 35 ◦ C or higher have         1990–2016. Annual tea production and its cultivation
increased and are projected to be longer and more         area are compiled by the Chinese Bureau of Statist-
frequent in China [26], which potentially threaten        ics, in the statistical yearbook, or separately in the
tea production and the livelihoods of tea depend-         yearbook for each prefecture. This study focuses on
ent growers. Although most previous research has          the primary tea yield rather than various processed
emphasized the importance of heat stress, cold stress     tea products. We use the cultivated area to compute
also has the potential to reduce tea yield because it     annual tea yields (t ha−1 ). We observed that there was
usually occurs during the early growing season when       rapid expansion in the cultivated area for some years
the tea bud emerges and may limit the number of har-      in few cities. Tea plantations are not usually harvested
vests in a given year [27]. Cold stress results in both   for the first two years after they have been planted,
physiological and structural damages to tea leaves.       so rapid expansion could bias the calculation of tea
Physiologically, cold stress reduces enzyme activity,     yields when using cultivated area in the calculation.
photosynthesis rate and causes water loss, imbalance      In these cases, we used the area data before the rapid
metabolism. Structurally, cold stress can destruct the    expansion to compute tea productivity. In addition,
membrane system, form intracellular ice, and deform       we collected soil type data from the China Soil Data-
tea leaves [28]. However, the quantitative influences     base (http://vdb3.soil.csdb.cn/) (supplementary table
of the full range of temperatures on tea productivity     1 (available online at stacks.iop.org/ERL/16/044040/
remain unclear. Further, it is unclear how tea yields     mmedia)). Cultivar information was obtained from
specifically respond to temperature extremes, which       the statistic yearbook including three major categor-
will be altered via climate warming. We hypothesize       ies: arbor, semi-arbor, and shrub type (supplement-
that the rainfed cultivation system used for tea pro-     ary table 1).
duction [16] is highly likely to be susceptible to the
challenges posed by climate change, especially with       2.3. Weather observation dataset
regards to temperature extremes.                          Daily gridded maximum and minimum surface air
    Here we quantified the effects of temperature         temperature and precipitation data with a spatial
extremes on tea yield and demonstrated the histor-        resolution of a half degree in latitude and longit-
ical and future effects of temperature extremes on        ude were accessed from the China Meteorological
tea yields over the long-term and at nearly national      Administration (http://data.cma.cn/). The dataset is
scale. We collected a new long-term (1990–2016)           a reanalyzed product that has been analyzed by the

                                             2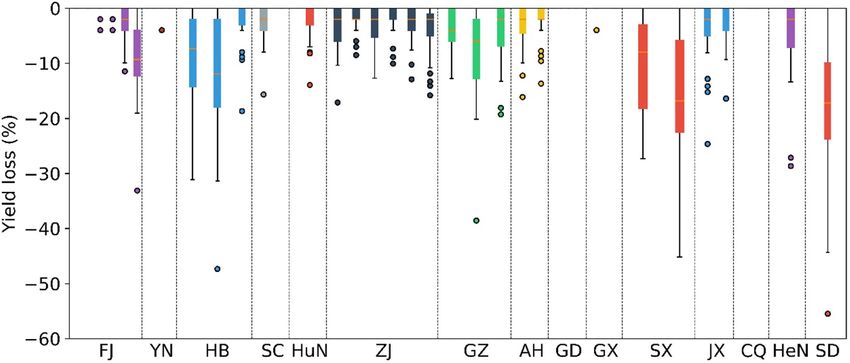
Environ. Res. Lett. 16 (2021) 044040 Y Yan et al
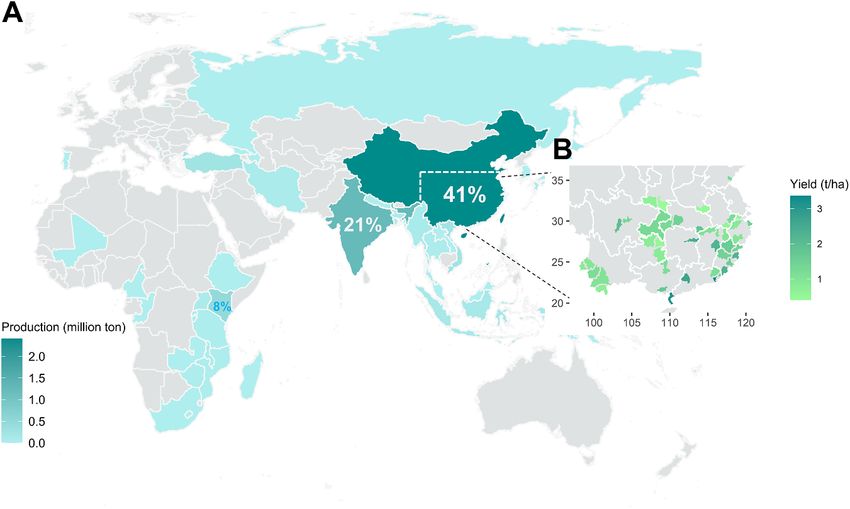
Figure 1. World tea production by country in 2016 (A). China accounts for 41% of world tea production, followed by India (21%)
and Kenya (8%). The America continent is not included which only accounts 1.6% of the world tea production. The study area
(B) and its mean yield between 2011 and 2016 are shown in green, presenting 70% of the China’s tea production in 2016. The
major tea growing regions in mainland China extend from 20◦ to 37◦ N and from 98◦ to 121◦ E.
thin plate spline interpolation method in conjunc- annual tea productivity and exposure for different
tion with the Global 30 Arc-Second Elevation model. temperature intervals at the resolution of the prefec-
The weather data quality is controlled by a cross- ture scale (equations (1) and (2)).
validation method and error analysis. To avoid urban Climate conditions strongly affect the tea crop
areas and better represent tea plantations, we further (Camellia sinensis (L.) Kuntze) growth, yield, and
chose the gridded weather data which located at tea quality [27]. Previous literature has identified an ideal
growing areas in each city according to the tea dis- temperature range for tea crop growth between 10 ◦ C
tribution map from China Tea Yearbook published and 30 ◦ C with 1500–2000 mm annual precipitation
in 2011. [27]. A tea crop can usually tolerate a maximum tem-
perature of 35 ◦ C, but several days under such condi-
2.4. Regression model tions will lead tea leaves to wilt and fall [13, 27]. The
Process-based crop growth models are useful and growing seasons for tea cultivation, vary considerably
effective tools to investigate the impacts of climate with the local climate. In this study, we considered
on crop productivity. However, contemporary crop local farming practices and examined monthly mean
models still have limited capacity and high uncer- temperature across 1981–2010 to determine months
tainties to account for extreme climate events, par- with average temperature >10 ◦ C; these months,
ticularly for cold and heat waves [29–31]. Besides, March–October, were defined as the growing sea-
process-based crop growth models usually require son. Temperature effects on yield were assumed to be
intensive data inputs to calibrate model parameters, cumulative over the growing season [3]. We applied
which is usually unavailable across large study areas this assumption and computed the time distribution
and through long periods. In contrast, previous stud- of the crop was exposed to a certain temperature
ies have shown the usefulness of data-driven statist- interval with 2 ◦ C step. The temperature boundar-
ical models to quantify the effects of irrigation, heat ies investigated are 0 ◦ C to 36 ◦ C, since daily mean
stress, or climate change on crop yields [3, 32–34]. temperature (T mean ) never exceeded 36 ◦ C or hardly
Although the weakness of the statistical approach below 0 ◦ C across the study area during 1990–2016.
(e.g. non-mechanistic) is also well known, statistical
models trained with long-term and multiple site data N
∑
show considerable performance and require limited Tk,p,j,i = Dayk,p,j (1)
field calibration when applying to broad-scale [34]. j=1
Therefore, in this study, we constructed a statistical
panel model with long-term (1990–2016) 42 cities tea where Tk,p,j,i is the accumulated temperature exposure
production data to analyze the relationship between in days to a given temperature bin k in each city p and
3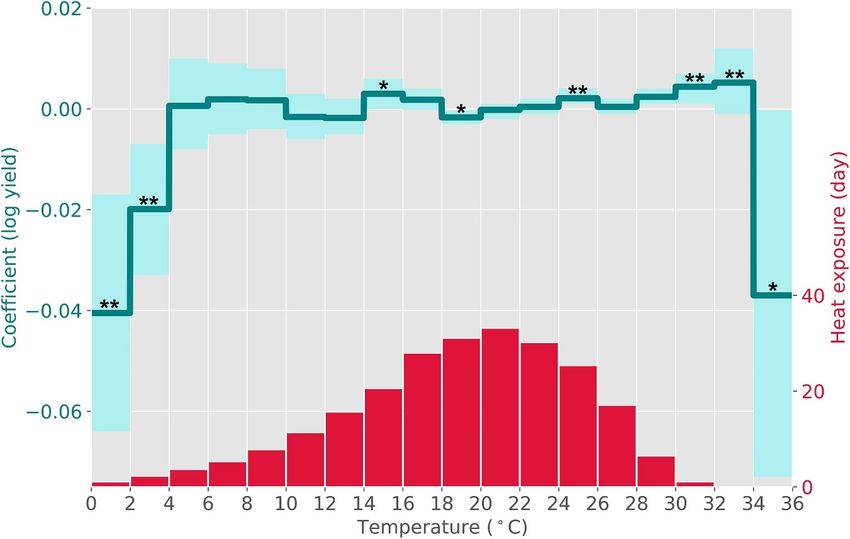
Environ. Res. Lett. 16 (2021) 044040                                                                            Y Yan et al

year i through the growing season, N is the number               where ∆Yield is the change of log yield. βk , δ and
of the growing days, j is the time step as one day.              γ are the coefficients derived from equation (2).
    Subsequently, we constructed a commonly                      ∆Tk,p,j,i is the change of temperature exposure at each
applied statistical model as follows:                            temperature bin and at each spatial grid during the
                                                                 growing season with one day time step. ∆Z is the
            ∑
            18                                                   change of water availability, which is defined as accu-
   Yp,i =         βk Tk,p,j,i + δZp,i + γZ2p,i + τi + µp + ε     mulated monthly precipitation within growing sea-
            k=1                                                  son. In addition, we computed the yield change (%)
                                                           (2)   due to cold/heat extremes (stress) as well as change
                                                                 in water availability. Here, cold and heat extremes
where Yp,i is the natural logarithmic yield for prefec-
                                                                 (stress) are defined as 0 ◦ C< T mean ⩽ 4 ◦ C and
ture p in year i. Zp,i is the growing season precipit-
                                                                 34 ◦ C
Environ. Res. Lett. 16 (2021) 044040 Y Yan et al
Figure 2. Nonlinear temperature effects on tea yield. Tea yield variation due to each one-day exposure to a certain temperature
interval. The red bar plot represents the mean accumulated heat exposure to each 2 ◦ C temperature bin across study regions.
Shaded areas show 95% confidence intervals. ∗ P < 0.05, ∗∗ P < 0.01, two tailed p values were used in testing the null hypothesis
that the coefficients are zero.
and 2 ◦ C warming levels for all individual GCMs. The (P < 0.05), while a wide range of intermediate tem-
ensemble mean, 84th and 16th percentile value, and peratures exhibited minor yield impacts. We trans-
the 16%–84% range of future projections are calcu- formed the yield to logarithmic form. Therefore, the
lated using the whole ensemble of model projections cold stress coefficient of −0.04 (or −0.02) indicates
across the 21 GCMs. The 16%–84% range (±one that the temperature of each day between 0 and 2 (or
standard deviation) indicates the uncertainty range of 2–4) ◦ C reduces the tea yield by 4% (or 2%). There-
projections and is computed as the difference between fore, each day the tea crop was exposed to extreme
the 84th and 16th percentile values. cold (0 ◦ C < T mean ⩽ 4 ◦ C) decreases yield around
2%–4% compared to non-stress conditions, translat-
ing into around 46 833–93 667 t (2%–4%) loss based
3. Results on national production in 2016. Each day of extreme
heat (34 ◦ C < T mean ⩽ 36 ◦ C) decreases yields around
3.1. Susceptibility to cold and heat extremes 3.7%, translating to around 86 642 t of tea produc-
Figure 2 shows the nonlinear temperature (daily tion in 2016. Tea production across China shows great
mean) effects on tea yield variations and the mean susceptibility to both cold and heat extremes. Besides,
heat exposure at each temperature bin. The effects of we found non-significant effects of the growing sea-
soil type and cultivar in each prefecture were con- son precipitation on the yield, indicating that current
trolled in our model via prefecture fixed effects, as tea production in China is likely dominated by the
was technology improvement over time (equation temperature. Detailed results of the regression ana-
(2)). Through the validation, we found that the lysis are available in supplementary table 4. The num-
model could reasonably well to estimate the tea ber of samples affected by the cold or heat extreme is
yield based on the variables we constructed (sup- available in supplementary figure 4.
plementary figure 1). Sensitivity results of changing
the number of temperature bins are available in 3.2. Substantial cold extremes-induced yield loss
supplementary figure 2. Sensitivity results of different After confirming the quantitative relationship
temperature exposure counting methods are available between tea yield and temperature extremes, we
in supplementary figure 3. We found considerably quantified the effects of historical extreme temper-
larger model confidence interval width compared to atures on tea yield losses by the regression model.
equation (2). Extreme cold stress occurred in several major tea
We found that both heat and cold extremes growing regions up to 18 d yr−1 (figure 3(A)).
were associated with significantly reduced tea yields The majority of the production area was affected,
5Environ. Res. Lett. 16 (2021) 044040 Y Yan et al
Figure 3. Spatial distribution of the historical (1990–2016) cold extreme maximum (A), heat extreme maximum (B), and
concomitant yield losses in percentage (C), (D) and absolute values (E), (F).
including provinces in the northern, central, and losses, which shows distinctive regional character-
eastern regions of China. These were Shandong istics and interannual variability (figure 4). Between
(SD), Shaanxi (SX), Henan (HeN), Hubei (HB), 1990 and 2016, only tea production in Chongqing
Sichuan (SC), Guizhou (GZ), Hunan (HuN), Jiangxi (CQ) and Guangdong (GD) were not affected by cold
(JX), Fujian (FJ), Anhui (AH) and Zhejiang (ZJ). stress. Together, they represent just 5% of national
Impacts of extreme cold stress are shown by the production. Regions above 25◦ N are more likely to
historical maximum yield loss values for the study suffer from more severe cold stress with a maximum
period. These values are shown as both a percent- yield reduction of 56.3% recorded in Shandong (SD)
age (figure 3(C)) and as actual values (figure 3(E)). province.
The yield loss maximum ranged from 0% to 56.3% Heat stress also has a strong negative impact on
(figure 3(C)). Losses were particularly high in in tea yield, but has historically occurred over a smal-
Rizhao (56.3%, in SD), Hanzhong (45.1%, in SX), ler area than cold stress. Intensive heat stress only
and Yichang (47.3%, in HB), and were considerable occurred in the southwestern (CQ) region and parts
in Xinyang (28.6%, in HeN). Furthermore, in the top of the central (HB) and eastern (AH, ZJ) regions,
tea producing province, Fujian, there were consider- where exposure occurred from 0.8 to 5.2 d yr−1
able tea yields losses in Ningde (33.1%) and Nanping (figure 3(B)). Heat stress events occurred in the
(11.4%). Losses were around 4% in the two other Yangtze River regions (near to 30◦ N) and the heat-
prefectures in Fujian. We also present the spatial- induced maximum yield losses were also high in
temporal distribution of the cold stress-induced yield Chongqing (20.4%), Huzhou (11.1%, in ZJ), and
6Environ. Res. Lett. 16 (2021) 044040 Y Yan et al
Figure 4. Spatial-temporal distribution of the historical cold stress-induced yield losses. Each box illustrates the distribution of
losses due to cold stress for each city across time (1990–2016). The province sequence (x axis) is based on production levels.
Xuanchen (4.8%, in AH) (figure 3(D)). However, Conversely, a considerable intensification of heat
yield losses due to extreme heat were less than those stress will partially offset the beneficial effects of the
caused by cold damage. reduced cold stress. In the regions of southern China
(28◦ N), whereas the increase
in heat stress is notable (1.0–2.5 d) in southern China Climate change, especially temperature increase and
(Environ. Res. Lett. 16 (2021) 044040 Y Yan et al
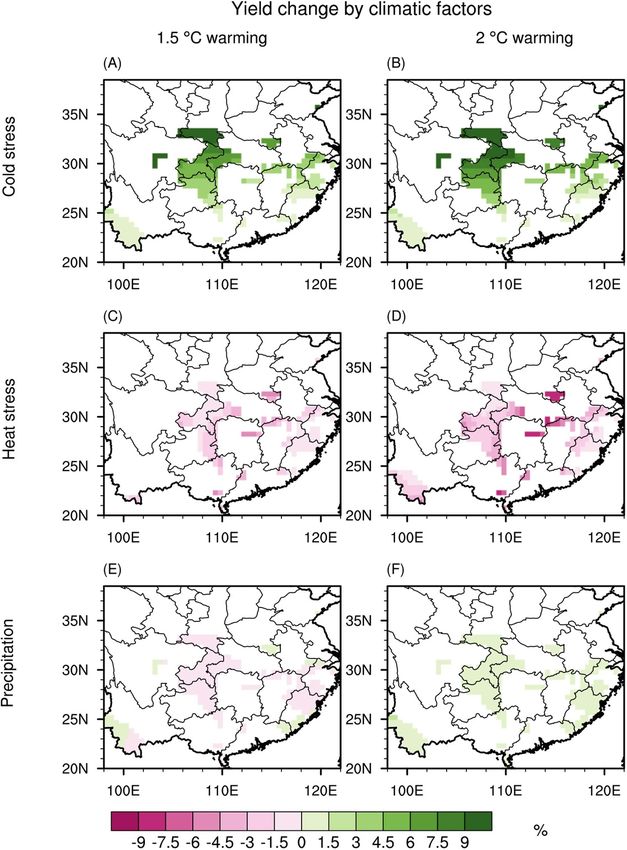
Figure 5. Future cold stress-(A), (B), heat stress-(C), (D) and precipitation-(E), (F) induced yield changes comparing to the
present climate when the 1.5 ◦ C and 2.0 ◦ C warming scenarios were used.
production in China, demonstrating vulnerability to suitable tea cultivation areas towards cooler regions.
both cold and heat stress during 1990–2016. The sub- Besides, the unexpected overall positive impacts of
stantial cold stress damage found in China suggests climate change on tea production (supplementary
that tea production is more affected by cold than heat figures 7 and 8), indicates that climate warming is
extremes at present climate. A study that used data redistributing growing season temperature to more
from 1972 to 2014 showed that the tea crop in the favorable ranges for tea production across study areas.
Fujian province, eastern China, was at a higher risk A recent process-model based study reported sim-
from cold stress than heat stress [41], which is consist- ilar positive outcomes of climate change on tea yields
ent with the findings of this study. Projections using over China [42]. However, we also expect more heat-
21 GCMs suggested that strong shifts from cold to induced yields losses in southern regions, such as
heat stress will cover all tea production zones (sup- in Guangdong and Guangxi provinces and parts of
plementary figures 7 and 8). The notable increase the Yangtze River regions, if no effective adaptation
in tea yields above 28◦ N indicates that north- strategies are applied (figure 5). Nevertheless, consid-
ern regions (>28◦ N) in China will become more erable uncertainty for estimating heat stress impacts
suitable for tea production due to the substantial remains (figure 2). This is partly due to only a handful
cold alleviation. Climate warming seems to expand of samples were affected by heat stress during the
8Environ. Res. Lett. 16 (2021) 044040 Y Yan et al study period (supplementary figure 4), since suffi- might also affect tea yields but are not explicitly cient sample size is crucial to accurately estimate the accounted for in this study due to the limitation of coefficient [43]. We highly encourage future studies the statistical approach or data scarcity issue. Never- could conduct field experiments to further narrow theless, we only considered the total amount of grow- down the confidence interval and reduce the uncer- ing season precipitation but overlooked its time dis- tainties for quantifying heat stress impacts, especially tribution. More studies and experiments will be bene- for the case when daily mean temperate exceeds the ficial to understand the adaptability of tea production historical records. Besides, seasonal drought events, to the incoming intensified heat extremes, including common in the subtropical humid regions of China, expanding beyond modeling tea yield to consider the from July to September [44, 45] would limit nutri- quality of the harvested product [11, 25]. ent uptake, even when there is an adequate supply We quantified the vulnerability of tea yields to of soil nutrients [46], which may also occur concur- temperature extremes across the tea growing regions rently with the heat extremes and pose additive negat- of China (figure 2). We found that historical cold ive effects on tea production. Although climate warm- stress caused greater yield reductions across China ing would potentially increase tea yields over China, compared to heat stress. Southern China (
Environ. Res. Lett. 16 (2021) 044040 Y Yan et al
Xing Chen https://orcid.org/0000-0002-2438- white, black, oolong, and pu-erh teas according to their free
9028 amino acids content J. Agric. Food Chem. 55 5960–5
[20] Ying Y, Ho J W, Chen Z Y and Wang J 2005 Analysis of
Chunmiao Zheng https://orcid.org/0000-0001-
theanine in tea leaves by HPLC with fluorescence detection J.
5839-1305 Liq. Chromatogr. Relat. Technol. 28 727–37
[21] Duncan J M A, Saikia S D, Gupta N and Biggs E M 2016
References Observing climate impacts on tea yield in Assam, India Appl.
Geogr. 77 64–71
[1] Lobell D B, Bänziger M, Magorokosho C and Vivek B 2011 [22] Wijeratne M A, Anandacoomaraswamy A, Amarathunga S,
Nonlinear heat effects on African maize as evidenced by Ratnasiri J, Basnayake B R S B and Kalra N 2011 Assessment
historical yield trials Nat. Clim. Change 1 42–45 of impact of climate change on productivity of tea (Camellia
[2] Meerburg B G, Verhagen A, Jongschaap R E E, Franke A C, sinensis L.) plantations in Sri Lanka J. Natl Sci. Found. Sri
Schaap B F, Dueck T A and Van Der Werf A 2009 Do Lanka 35 2
nonlinear temperature effects indicate severe damages to US [23] Ochieng J, Kirimi L and Mathenge M 2016 Effects of climate
crop yields under climate change? Proc. Natl Acad. Sci. variability and change on agricultural production: the case of
106 E120 small scale farmers in Kenya NJAS—Wagen. J. Life Sci.
[3] Schlenker W and Roberts M J 2009 Nonlinear 77 71–78
temperature effects indicate severe damages to U.S. crop [24] Han W Y, Huang J G, Li X, Li Z X, Ahammed G J, Yan P and
yields under climate change Proc. Natl Acad. Sci. 106 15594 Stepp J R 2017 Altitudinal effects on the quality of green tea
[4] Zhao C et al 2017 Temperature increase reduces global yields in east China: a climate change perspective Eur. Food Res.
of major crops in four independent estimates Proc. Natl Technol. 243 323–30
Acad. Sci. 114 9326 [25] Larson C 2015 Reading the tea leaves for effects of climate
[5] Ray D K, West P C, Clark M, Gerber J S, Prishchepov A V change Science 348 953
and Chatterjee S 2019 Climate change has likely already [26] Wang H-J, Sun J-Q, Chen H-P, Zhu Y-L, Zhang Y, Jiang D-B,
affected global food production PLoS One 14 e0217148 Lang X-M, Fan K, Yu E-T and Yang S 2012 Extreme climate
[6] Hannah L, Roehrdanz P R, Ikegami M, Shepard A V, in China: facts, simulation and projection Meteorol. Z.
Shaw M R, Tabor G, Zhi L, Marquet P A and Hijmans R J 21 279–304
2013 Climate change, wine, and conservation Proc. Natl [27] Huang S 1989 Meteorology of the tea plant in China: a
Acad. Sci. 110 6907 review Agric. For. Meteorol. 47 19–30
[7] Imbach P et al 2017 Coupling of pollination services and [28] Lu Y, Hu Y, Snyder R L and Kent E R 2019 Tea leaf ’s
coffee suitability under climate change Proc. Natl Acad. Sci. microstructure and ultrastructure response to low
114 10438 temperature in indicating critical damage temperature Inf.
[8] Xie W, Xiong W, Pan J, Ali T, Cui Q, Guan D, Meng J, Process. Agric. 6 247–54
Mueller N D, Lin E and Davis S J 2018 Decreases in global [29] Barlow K M, Christy B P, O’Leary G J, Riffkin P A and
beer supply due to extreme drought and heat Nat. Plants Nuttall J G 2015 Simulating the impact of extreme heat and
4 964–73 frost events on wheat crop production: a review Field Crops
[9] Boehm R, Cash B S, Anderson T B, Ahmed S, Griffin S T, Res. 171 109–19
Robbat A, Stepp J, Han W, Hazel M and Orians C 2016 [30] Maiorano A et al 2017 Crop model improvement reduces the
Association between empirically estimated monsoon uncertainty of the response to temperature of multi-model
dynamics and other weather factors and historical tea yields ensembles Field Crops Res. 202 5–20
in china: results from a yield response model Climate [31] Wang E et al 2017 The uncertainty of crop yield projections
4 20 is reduced by improved temperature response functions Nat.
[10] Marx W, Haunschild R and Bornmann L 2017 Global Plants 3 17102
warming and tea production—the bibliometric view on a [32] Hong C, Mueller N D, Burney J A, Zhang Y, AghaKouchak A,
newly emerging research topic Climate 5 46 Moore F C, Qin Y, Tong D and Davis S J 2020 Impacts of
[11] Ahmed S et al 2014 Effects of extreme climate events on tea ozone and climate change on yields of perennial crops in
(Camellia sinensis) Functional quality validate indigenous California Nat. Food 1 166–72
farmer knowledge and sensory preferences in tropical China [33] Li Y, Guan K, Peng B, Franz T E, Wardlow B and Pan M 2020
PLoS One 9 e109126 Quantifying irrigation cooling benefits to maize yield in the
[12] Cabrera C and Artacho R Giménez R 2006 Beneficial effects US Midwest Glob. Change Biol. 26 3065–78
of green tea—a review J. Am. Coll. Nutr. 25 79–99 [34] Lobell D B and Burke M B 2010 On the use of statistical
[13] Chang K 2015 World Tea Production and Trade: Current and models to predict crop yield responses to climate change
Future Development (Rome: Food and Agriculture Agric. For. Meteorol. 150 1443–52
Organization Of The United Nations) [35] Jayasinghe S L and Kumar L 2019 Modeling the climate
[14] Chang K and Brattlof M 2015 Socio-economic Implications of suitability of tea [Camellia sinensis (L.) O. Kuntze] in Sri
Climate Change for Tea Producing Countries (Rome: FAO) Lanka in response to current and future climate change
[15] FAOSTAT 2017 Food and Agriculture Organization of the scenarios Agric. For. Meteorol. 272–273 102–17
United Nations Statistical Database (Rome: FAO) [36] O’brien R M 2007 A caution regarding rules of thumb for
[16] Bhagat R, Ahmed K Z, Gupta N, Baruah R D, variance inflation factors Qual. Quant. 41 673–90
Wijeratne M A, Bore J K and Ahammed G J 2016 Report of [37] Van Vuuren D P et al 2011 The representative concentration
the working group on climate change of the FAO pathways: an overview Clim. Change 109 5
intergovernmental group on tea [38] Taylor K E, Stouffer R J and Meehl G A 2011 An overview of
[17] Chen X H, Zhuang C G, He Y F, Wang L, Han G Q, Chen C CMIP5 and the experiment design Bull. Am. Meteorol. Soc.
and He H Q 2010 Photosynthesis, yield, and chemical 93 485–98
composition of Tieguanyin tea plants (Camellia sinensis (L.) [39] Hawkins E et al 2017 Estimating changes in global
O. Kuntze) in response to irrigation treatments Agric. Water temperature since the preindustrial period Bull. Am.
Manage. 97 419–25 Meteorol. Soc. 98 1841–56
[18] Lou W, Sun K, Zhao Y, Deng S and Zhou Z 2021 Impact of [40] Lesk C, Rowhani P and Ramankutty N 2016 Influence of
climate change on inter-annual variation in tea plant output extreme weather disasters on global crop production Nature
in Zhejiang, China Int. J. Climatol. 41 E479–E90 529 84
[19] Alcázar A, Ballesteros O, Jurado J M, Pablos F, Martín M J, [41] Chen J, Huang C, Sun C, Wu L and Wu T 2018
Vilches J L and Navalón A 2007 Differentiation of green, Disaster-causing hazard division and evaluation of
10Environ. Res. Lett. 16 (2021) 044040 Y Yan et al
meteorological disasters for tea in Fujian Province J. Nat. China and the background circulation Clim. Dyn.
Disaster 27 198–207 36 1463–73
[42] Beringer T, Kulak M, Müller C, Schaphoff S and Jans Y 2020 [46] Lipiec J, Doussan C, Nosalewicz A and Kondracka K 2013
First process-based simulations of climate change impacts on Effect of drought and heat stresses on plant growth and
global tea production indicate large effects in the World’s yield: a review Int. Agrophys. 27 463–77
major producer countries Environ. Res. Lett. 15 034023 [47] Han W, Li X, Yan P, Zhang L and Ahammed G J Tea
[43] Maas C J M and Hox J J 2005 Sufficient sample sizes for cultivation under changing climatic conditions Global
multilevel modeling Methodology 1 86–92 tea science: current status and future needs
[44] Ding Y, Wang Z and Sun Y 2008 Inter-decadal variation of 2018 455–72
the summer precipitation in East China and its association [48] Rosenzweig C, Iglesias A, Yang X B, Epstein P R and
with decreasing Asian summer monsoon. Part I: observed Chivian E 2001 Climate change and extreme weather
evidences Int. J. Climatol. 28 1139–61 events; implications for food production, plant
[45] Zhu Y, Wang H, Zhou W and Ma J 2011 Recent diseases, and pests Glob. Change Hum. Health
changes in the summer precipitation pattern in East 2 90–104
11You can also read