EFFECTS OF IMMIGRANT LEGALIZATION ON CRIME: THE 1986 IMMIGRATION REFORM AND CONTROL ACT
←
→
Page content transcription
If your browser does not render page correctly, please read the page content below
EFFECTS OF IMMIGRANT LEGALIZATION ON CRIME: THE
          1986 IMMIGRATION REFORM AND CONTROL ACT*
                                                Scott R. Baker
                                             Economics Department
                                              Stanford University

                                                   April 20, 2013

                                                      Abstract

            In the late 1970’s, rates of undocumented immigration into the United States increased
         dramatically. This led to pressure on the federal government to find some way of dealing
         with the surge in undocumented immigrants, culminating in the 1986 Immigration Reform and
         Control Act (IRCA). This paper examines the effects that the 1986 IRCA, which legalized over
         2.5 million undocumented immigrants, had on crime in the United States. I exploit the quasi-
         random timing of legalization as well as cross-county variation in the intensity of treatment to
         isolate the causal effects of legalization on crime. Following legalization, I find national decreases
         in crime of approximately 2%-6% associated with one percent of the population being legalized,
         primarily due to a drop in property crimes. This fall in crime is equivalent to 160,000-480,000
         fewer crimes committed each year due to legalization. Finally, I calibrate a labor market model
         of crime using empirical wage and employment data and find that much of the drop in crime
         could be explained by greater job market opportunities among those legalized by the IRCA.
         JEL classification: F22, J22, K42

*Contact: Scott R. Baker, Stanford Economics Dept, 579 Serra Mall, 415-244-8274, srbaker@stanford.edu.
Thanks to Linda Baily for generously sharing the IRCA data and to Ronald Lee, Stefano DellaV-
igna, Nick Bloom, Caroline Hoxby, Ran Abramitzky, David Card, David Romer, and seminar
participants from UC Berkeley, Stanford, and Stanford Law School for their comments and sugges-
tions.

                                                           1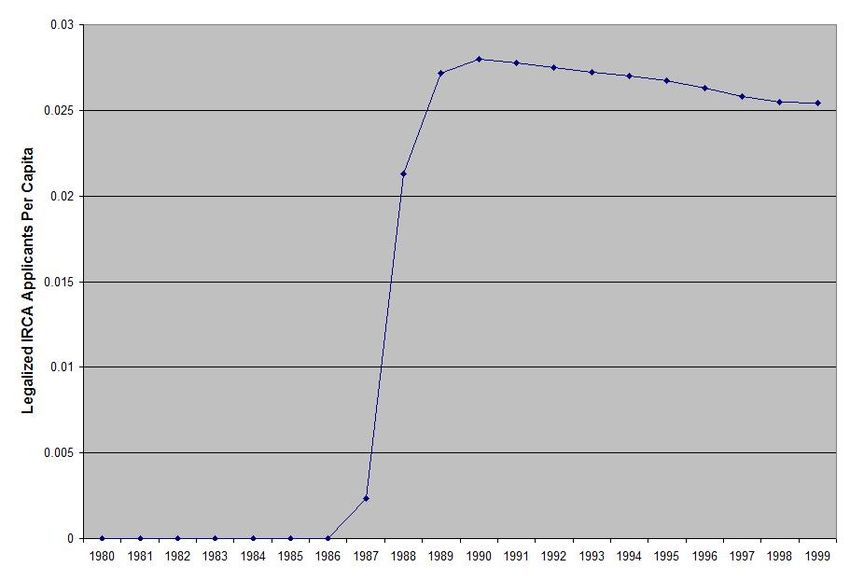
1    Introduction
In the late 1970’s, rates of undocumented immigration into the United States began to increase
dramatically. As with more recent debates over undocumented immigration, many thought that
this increase was hurting the job prospects of natives and legal immigrants, as well as having other
undesirable social effects, leading politicians to seek a method to deal with this influx. The result
was the 1986 Immigration Reform and Control Act (IRCA), which imposed harsh penalties on
the hiring of undocumented immigrants, increased border security, and provided a near-universal
amnesty for undocumented immigrants currently in the United States. The present state of the
immigration debate has much in common with the early 1980’s, with many politicians seeking to
find some way of dealing with the current stock of over 12 million undocumented immigrants and
the hundreds of thousands of new arrivals every year. Similarly to the 1986 IRCA, the current
debate focuses on labor market effects as well as other social effects; of these, the most prominent
is that of crime.
    This paper examines the effects that the IRCA, which legalized close to 3 million undocumented
immigrants, had on the commission of crime in the United States using administrative data from the
IRCA application process. Using a variety of empirical estimation strategies, I provide estimates of
the total effect of this legalization and of the potential effects on crime of a new amnesty bill. With
these specifications, I exploit the large amount of variation in both the geographical distribution
and quasi-random timing of the legalizations. I find persistent decreases in crime of approximately
2%-5% associated with one percent of the population being legalized, primarily driven by a drop in
property crimes. This fall in crime is equivalent to 160,000-480,000 fewer crimes committed each
year across the nation due to legalization. While there were drastic changes in crime during the
1980s and 1990s, the declines in crime that I find are linked to legalization cannot be explained
by existing trends, economic conditions, declines in drug crimes, changes to police forces or prison
populations, or other common explanations of changes in crime rates during this period. Given that
proposals for legalization similar to the 1986 IRCA have been debated in the United States and
around the world, this analysis can provide some estimates of potential effects on crime stemming
from similar amnesty programs and immigration reforms in general.
    Looking more deeply into prior literature and surveys done on the legalized IRCA applicants,
I find strong evidence for enhanced levels of human capital and greater labor market opportunities
resulting from becoming legal residents. To this end, I also provide theoretical evidence that
these increases in labor market opportunities and shifts from crime to legal work were the primary
mechanism that drove down crime. I present a model of job search and crime, calibrating this
model to real-world data and matching its predicted outcomes against county-level empirical crime
data, finding a close match.

                                                  2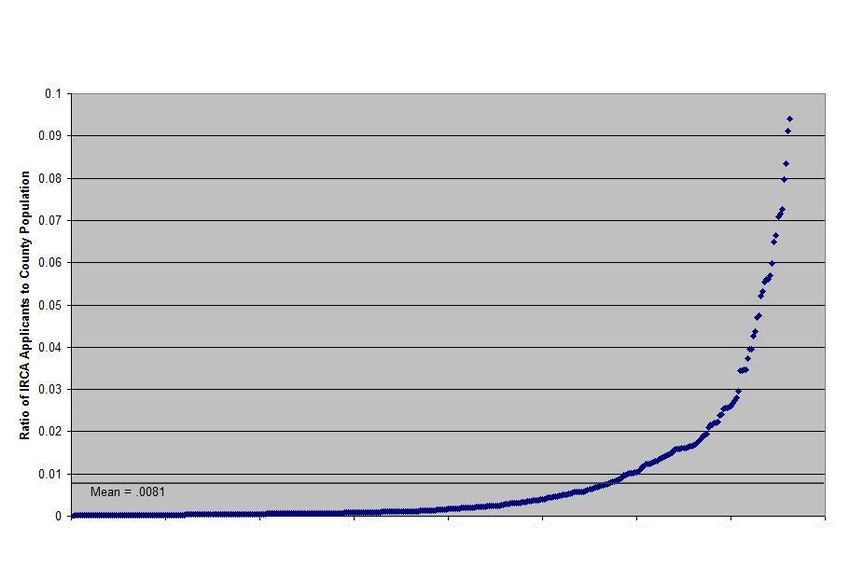
1.1     Literature

Both before and after this program, the large presence of both legal and undocumented immigrants
in the United States has given rise to a large body of literature devoted to studying them. Of most
relevance to this paper are strands of research examining interactions of immigration, legal status,
crime, and labor market access.
      Much of the existing literature on undocumented immigration highlights the changes in be-
havior and labor market access produced by various legalization programs. For example, Orrenius
and Zavodny (2003) examine whether the amnesty portion of the IRCA reduced undocumented
immigration at a national level. A wide range of others such as Bratsberg et. al. (2002), Amuedo-
Dorantes et. al. (2007), Kossoudji and Cobb-Clark (2002), Kaushal (2006), and Lozano and
Sorenson (2011) examine the value of legal status in terms of labor market access and income.
Their results consistently find large effects of obtaining legal status on income among previously
undocumented immigrants, speaking to better labor market access, skill acquisition, and more
efficient bargaining.
      Outside the literature explicitly dealing with only undocumented immigrants, a primary focus
of immigration work has been on the effects of immigrants on labor markets. While innumerable
labor market studies have been conducted, (eg. Dolado et al (1997), Friedburg and Hunt (1995),
and George Borjas (2003, 2005, 2006), and Passel (2006)), two which are methodologically relevant
are those by Bailey (2002), and Card (1990). Bailey utilizes the 1986 IRCA data to extensively
examine labor market effects of legalization. Bailey uses the IRCA data primarily for identifying
applicants by location, as I do, in order to match local labor market outcomes. Bailey finds
little effect of the IRCA on natives’ labor market outcomes. Such estimates are important to the
assumptions in my labor market model of crime, which assumes no negative effect of the IRCA
on natives, only positive effects among IRCA applicants. Also instructive is David Card’s (1990)
paper on the Mariel Boatlift, which exploits the massive influx of Cubans into the Miami area as
a natural experiment, examining labor market outcomes among native groups.
      While most immigration literature deals with effects on the labor force, there is also a large
literature on the effects of immigration on crime. Much of this immigrant-crime research focuses
on the common belief that immigrants are much more prone to commit crimes than natives. For
instance, Martens (1997), working with data from Sweden, found that both first and second gener-
ation immigrants have higher rates of crime than natives, but that second generation immigrants
have lower rates than first generation immigrants do. Butcher and Phiel (1998a, 1998b, 2007) pro-
vide several studies of the United States which reach a different conclusion. They find that cities
which have high concentrations of immigrants also have relatively high rates of crime but after
controlling for demographic characteristics of cities and of groups of immigrants and natives, they
find that recent immigrants have equal or slightly less chance of committing crimes than natives.

                                                  3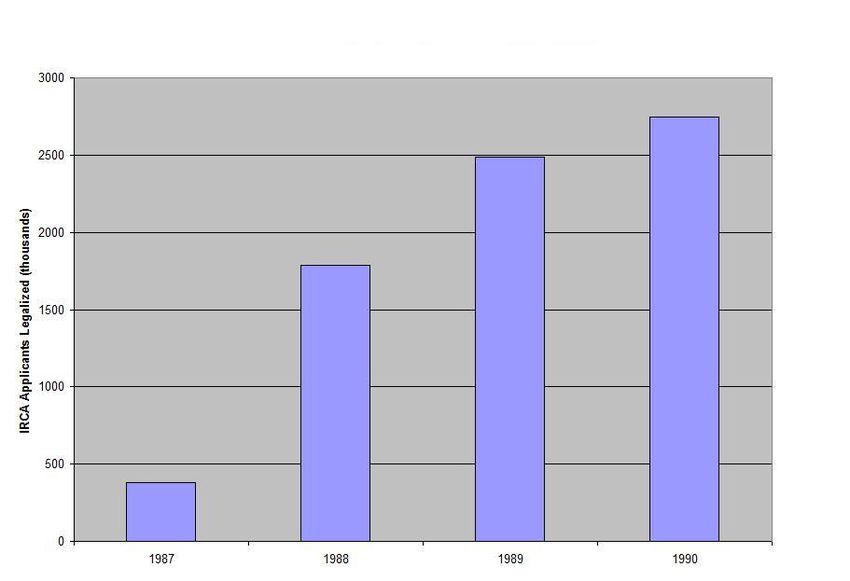
Hagan and Polloni (1999) also find that the number of crimes committed by Hispanic immigrants
are inflated when compared to the number committed by natives, since most recent immigrants are
young males, who are more disposed to crime than the average person.
    Additionally, Bell, Machin, and Fasani (forthcoming) present evidence on the impact on crime
of large-scale immigration into the United Kingdom. They examine two large waves of immigration
in the 1990s and 2000s, one composed of asylum-seekers who were legally prevented from finding
work while their applications were being considered, and one composed largely of workers from
newly admitted EU countries. They find evidence for increases in property crime associated with
the first group and none with the second. They also find no increase in violent crime associated
with either group. They conclude that the observed increases in crime derived primarily from lack
of attachment to the labor force. Freedman, Owens, and Bohn (2013) concur with this assessment,
finding some evidence of decreases in crime associated with the ability of undocumented immigrants
to obtain legal employment.
    A number of papers since Becker’s (1968) seminal work have linked crime rates, especially those
for economically-driven crimes, to economic conditions. Others such as Meyers (1983) and Gould
et. al. (2002) draw tighter links between the two. One recent study by Borjas, Grogger, and
Hanson (2009) find that an increase in low-skilled workers from immigration, representing a drop
in wages and the per capita labor market opportunity for similarly low-skilled blacks, manifested
itself partly in an increase in incarceration rates for the affected group of competing natives.
    Finally, of particular interest is recent work by Mastrobuoni and Pinotti (2012), who examine
the causal effects of the legal status of immigrants in the European Union on criminal behavior.
They utilize variation in the timing of changes to migration restrictions among different EU nation-
alities, finding lower recidivism among economically-motivated immigrants with legal status than
those without legal status. Such findings mirror many of those found in this paper, with legal status
decreasing crime rates, especially property (economic) crimes, and possibly functioning primarily
through the labor market. While Mastrobuoni and Pinotti are able to exploit a quasi-experimental
identification strategy, they are able to apply this to only a small population (
million previously undocumented immigrants between the years of 1987 and 1990, with the majority
of legalizations occurring in 1988 and 1989. A cumulative number of national legalizations can be
seen in Figure I. This legalization was a substantial shift in the lives of these immigrants, with
the potential to produce large changes in behavior — in labor market outcomes, family life, and
interaction with the government and community — in a large group of individuals comprising
approximately 1.1% of the total population of the United States.
The 1986 Immigration Reform and Control Act (IRCA) was a bipartisan effort to strengthen the
nation’s controls on undocumented immigrants. The primary purpose of the bill was to enhance
the controls on the hiring of undocumented immigrants, as it was theorized that such financial
penalties would reduce employment opportunities for undocumented immigrants and thus decrease
the flow of undocumented immigrants into the United States. Prior to the bill’s passage, there
were essentially no federal laws regulating the ability of employers to knowingly hire undocumented
immigrants, though there were a number of state laws which did just this. The bill made it illegal to
knowingly hire or recruit undocumented immigrants and also required employers to at least give a
cursory investigation into their immigration status, as long as the business employed at least three
employees. The bill also, and most importantly for the purposes of this study, granted amnesty to
certain groups of undocumented immigrants who had entered the United States prior to 1982 and
lived here continuously, as well as to many agricultural workers.
The IRCA was subject to much debate in Congress and the media, beginning with its inception
in the early 1980s. The first criticisms came from human rights groups and Hispanic groups who
railed against the bill’s labor market provisions. They feared that employers would become unwilling
to hire Hispanic workers for fear of their being undocumented and thus the bill would greatly worsen
labor market discrimination against Hispanics, who would be the group most affected by the bill.
Additionally, farmers and growers also strongly opposed the bill, fearing an end to their usage
of undocumented immigrants as temporary agricultural workers, and the Chamber of Commerce
opposed any financial sanctions on businesses. Over the following years, the furor over employer
sanctions relented to some degree as requirements that employers diligently verify employment
status were dropped and passages were added which banned racial discrimination in hiring. After
this change, attention began to focus more intently on a compromise dealing with agricultural
workers and the legalization provisions. Finally, in 1986, the bill was passed in its final form.
While the bill seemed likely to pass at some point in some form, its passage in this particular year
and with the final provisions in the state that they were was by no means certain.
In its final form, the IRCA provided paths to citizenship for two groups of immigrants. The
first were immigrants who had resided in the United States for a relatively uninterrupted period
since January 1st, 1982 and applied between May 5, 1987 and May 4, 1988. The second were
Special Agricultural Workers (SAW), those who had worked with certain types of crops in the
United States for 90 days or more in the 1984, 1985, or 1986 and applied between June 1, 1987 and
5November 30, 1988. Both types of applicants would be disqualified if they had committed three
misdemeanors or a felony in the United States prior to application. After the acceptance of their
application, all applicants were given the status of ‘Temporary Resident Aliens’, a step towards
green card status, lasting 18 months. After this period, upon completing a proof of English test and
civics test, they were given permanent resident status. During their temporary residency, if they
committed a felony or three misdemeanors, they would be removed from the program. In addition,
during this temporary residency, their access to government benefits programs was limited and they
could not yet sponsor family members as additional immigrants. However, they could now legally
enter and leave the United States through ports of entry.
One important factor in determining the population that could become legalized was the extent
to which fraud played a role in admittance to the program. Examining the reports from a variety
of sources, there seemed to exist a large amount of fraud in the application process, especially
among the Special Agricultural Worker cohort. For example, the number of SAW applicants in
California was far greater than any government estimate of the entire agricultural worker population
in the state, not just the estimated number of undocumented agricultural workers. Furthermore,
a number of reports from front-line interviewers suggested that they believed a high percentage of
the SAW applicants were fraudulent, as well. One interviewer constructed a book of pictures of
various crop types and would ask applicants to point to a picture of the crop they had claimed to
work on; few could answer correctly. Finally, a number of sources such as North (2010) within the
program noted the amount of political pressure placed on them to approve as many applications
as possible. All of this suggests the near-universal availability of legalization for virtually every
undocumented immigrant within the country. Morever, the INS was also tasked with spreading
awareness about the program to all potential applicants. To this end, the INS funded a large number
of Qualified Designated Entities (QDEs), community organizations which both spread awareness
and helped applicants with some their paperwork. These QDEs were often Hispanic or other ethnic
organizations around the country, as well as traditional refugee- and immigrant-serving agencies.
These agencies went to great lengths to publicize the availability of the program and assist with
the application process.
There were a small number of rejections of applicants (under 5%). These applications were kept
on file, but were not forwarded to law enforcement and so it does not seem likely that any punitive
action was taken against those who were rejected from the program (leading to, for example, the
expulsion of undocumented immigrants who had committed felonies and were therefore ineligible
for the program).
The application review process was one of the largest bureaucratic undertakings ever attempted
by the INS up to that time. The INS consulted with the IRS for information about handling millions
of sets of paperwork in a short period of time and set up a new series of 107 ‘legalization offices’
throughout the country. In conjunction with these offices, the INS greatly increased its ‘remoting’
6practices, which would see paperwork sent around the country in order to distribute work to officers
who had more spare time. For example, paperwork would be sent to border crossing facilities to be
worked on during the middle of the night when there was little border crossing activity. The 107
‘legalization offices’ generally conducted the intial applicant interviews and then sent the paperwork
along to one of 4 larger INS offices that would then make the decisions about legalization for each
applicant.
The entire INS operation was intended to be standardized across the country, with no strong
regional variation in the decisions regarding similar legalization applications as had been seen in
decades past with naturalization decisions. The practice of ‘remoting’ and the unfamiliarity of
the INS with the massive undertaking, as well as the underestimate of the number of applicants,
meant the INS was overwhelmed and the application approval process took much longer for some
applicants than others. In essence, it meant that if two identical IRCA applicants both applied in
mid-1987 in the same county, one might be legalized by the end of 1987 and the other remaining
without legal status for up to 3 additional years. To quantify this point, the application date,
county of application, and individual characteristics like age, race, sex, and marital status only
explain about 60% of the variation in the legalization period, with the remainder largely driven by
the randomness of the application processing time.
2.1 Effects of Bill
Much of the literature on undocumented immigrants spanning the 1970’s, 1980’s, and 1990’s high-
lights the lower wages that they received, relative to legal immigrants. This gap remained after
controlling for observable demographic characteristics and levels of education. One such survey of
nearly 800 undocumented immigrants by North and Houstoun [1975] finds 37% lower hourly wages
among undocumented immigrants compared to similar workers in their same industry. A similar
‘premium’ for legal immigrants is found by Douglas Massey in a 1987 study involving only Mexican
immigrants. Finally, Rivera-Batiz [1999] finds nearly identical discrepancies in wages, with legal
male Mexican immigrants earning approximately 42% more than undocumented workers and legal
female Mexican immigrants earned nearly 41% more. Overall, the undocumented immigrants were
lower educated and had a lesser grasp of English, but these observable factors could explain less
than half of the gap in wages. Such evidence points to a premium paid for the legal status of legal
workers, beyond differences in skills and education.
There is also evidence of much greater incidence of part time and seasonal work among un-
documented immigrants, as noted by Orrenius and Zavodny [2004]. Much of this was due to the
seasonal demands of agricultural work, where immigrants would often be unable to find employ-
ment for a number of months during any given year. However, voluntary ‘job hopping’ or other
relatively rapid changes in employment locations and status were a common occurrence among non-
agricultural undocumented immigrants. The primary reasons behind such changes stemmed from
7a desire to elude deportation through frequent changes in employers as well as the insecure nature
of their jobs in general. Employers were able to more easily fire undocumented workers, or simply
stop paying them, as they had essentially no legal recourse available to them. Such frequent shifts
in employment most likely hindered undocumented workers’ ability to acquire job-specific capital
and decreased their average productivity as they were not leaving to find better job opportunities,
but to avoid detection. Prior to the IRCA, a number of the largest destinations for immigrants,
including California and Florida, already had various types of employer sanctions as existing laws.
In total, 11 states had such laws on the books before the IRCA was passed.1 So, in many cases, the
IRCA did not create new penalties for employers or provide additional disincentives for employers
to hire undocumented immigrants, causing the only meaingful effect of the bill to be the legalization
provisions.
In the years following the passage of the IRCA, a number of surveys have pointed to increases in
both language skills and education levels, as well as higher marriage rates, among IRCA applicants.
Such increases spoke to increases in levels of general skills and productivity, coinciding with increases
in wages of 15%-25% among this group. Though skill increases did account for much of the higher
wages following legalization, there remains much evidence for a legal immigrant ‘premium’ unrelated
to observables. Rivera-Batiz [1999] finds large levels of wage growth in the four years following the
passage of the 1986 IRCA. However, he finds that such gains are due primarily to the actual change
in legal status, not to increases in education, language skills, or other observables. In other work,
Kossoudji and Cobb-Clark [200] find significant evidence for increased job mobility and upwards
earnings trajectories for newly-legalized IRCA applicants, stating that “Relative to pre-legalization
mobility, few characteristics surpass in importance the now common experience of having legal
papers.”
However, despite these gains due to a shift to legal status, they were generally not caused by
increases in wages induced by the need to adhere to minimum wages for legal workers. Most evidence
points to undocumented immigrants earning more than the minimum wage in most occupations.
Rivera-Batiz finds average male undocumented immigrant wages of approximately $6.75 in 1987
and 1988, when the federal minimum wage was only $3.35. Self-reported wages from the data
utilized in this analysis (over all IRCA applicants during 1986) point to average hourly wages of
$5.75 and average annual wages of $12,028, equivalent to approximately $6.00 over a 2,000 hour
working year.
In addition to rising incomes from better labor market outcomes, the 1986 IRCA, combined with
the Federal Omnibus Budget Reconciliation Act of 1986 and other state-level bills, extended the
coverage of some benefit programs to newly legalized IRCA applicants. For instance, in California,
1
The states already possessing employer sanction laws were California, Connecticut, Delaware, Florida, Kansas,
Maine, Massachusetts, Montana, New Hampshire, Vermont, and Virginia. Chau, Nancy. Strategic Amnesty and
Credible Immigration Reform. Journal of Labor Economics, 2001.
8IRCA applicants were now able to get a wide variety of medical services under expanded Medi-
Cal and Medicaid programs even before the conclusion of their 18-month temporary residency
period. However, most federal benefit programs remained off-limits to IRCA applicants during
their temporary residency period, and were fully accessible only following a period of 5 years after
legalization.2 Such programs had the effect of boosting effective pay and benefits and gave IRCA
applicants some additional social safety nets during the times in which they were unemployed or
received other negative income shocks. These types of benefits, in combination with rising labor
incomes, further diminish the economic motives for criminal behavior.
One important conclusion from this literature, combined with results of Bailey’s work, is that
the passage of the IRCA seems to represent a net gain for IRCA applicants in terms of the labor
market and no significant loss for competing workers. While there is evidence of minor economic
harm among low-skilled natives as a consequence of the arrival of new immigrants, the legalization
of already-present undocumented workers seems to have no had similar negative impacts, as the
IRCA applicants had already been present in the country and in competition with low-skilled natives
for a number of years. The IRCA helped to usher in higher levels of education, skill acquisition,
and English language proficiency, as well as diminished reasons for frequent job-hopping to evade
government detection, among IRCA applicants. Thus the IRCA, in terms of labor market outcomes,
represents a net gain in productivity and output on a national level, not just a reallocation of wages
or jobs from native workers to newly-legalized IRCA applicants. Further evidence to this effect can
be found in Appendex 3.
3 Data
There are two principle sources of data used in this paper. The first is the 1990 Legalization
Summary Tapes created by the Immigration and Naturalization Service (now US Citizenship and
Immigration Service). The Legalization Summary Tapes are a set of large databases of comprehen-
sive demographic information regarding every immigrant admitted or legalized in each fiscal year
from 1972-1996.
The primary purpose of this dataset is to quantify the number of IRCA applicants in each
county in the United States. Well over 95% of the applicants to the 1986 IRCA were accepted into
the program, so this list of applicants is a good measure of the number of undocumented immigrants
2
The text of the 1986 IRCA mandated a period of 5 years after legalization before most federal benefit programs
would be available to IRCA applicants. Included in these off-limits programs were food stamps, Medicaid, and most
other financial assistance programs based on financial need. There were a variety of exceptions for medical care for
pregnant women and children, as well as for the disabled and emergency services. Various other services such as
discounted school lunches, Head Start, child nutrition programs, and job training were available to legalized IRCA
applicants without the 5 year waiting period. During this time, states were also allowed to institute their own laws
regarding the accessibility of state-programs for legalized IRCA applicants.
9that were legalized in each of these counties and the year in which they were legalized. Due to
privacy concerns, counties where fewer than 25 applicants resided are not listed, and only the state
of residence is given. However, the IRCA applicants in these counties compose a small percentage
of applicants, so the county level data are still relatively comprehensive. This dataset is useful in
providing an accurate demographic and geographic portrayal of the undocumented immigrants in
question.
Also taken from the 1990 Legalization Summary Tapes are other demographic information
used for weighting of crime outcomes. Since the demographic composition of IRCA applicants
differs greatly from that of the general population, it would be inappropriate to use only the level
of immigrants in a county as my dependent variable, as propensity to commit or be a victim of
crime is highly dependent on age, sex, marital status, and income. In a brief examination of my
applicant data, I find that the mean ratio of IRCA applicants to county population, displayed
in Figure II, is approximately 0.8%, with individual county values ranging from 0% to over 20%.
The data also shows the applicant population is overwhelmingly male, at approximately 73% of
total applicant population. In addition, the applicants, with a median age of 27 years old, are
younger than the country average, which had a median age of 35. The average annual wage, when
reported, is much lower than that of the average American. Almost 80% of applicants do report
some information on earnings; they report earning approximately $12,000 a year when reporting an
annual wage, or $6 an hour when reporting an hourly wage. All of the demographic differences will
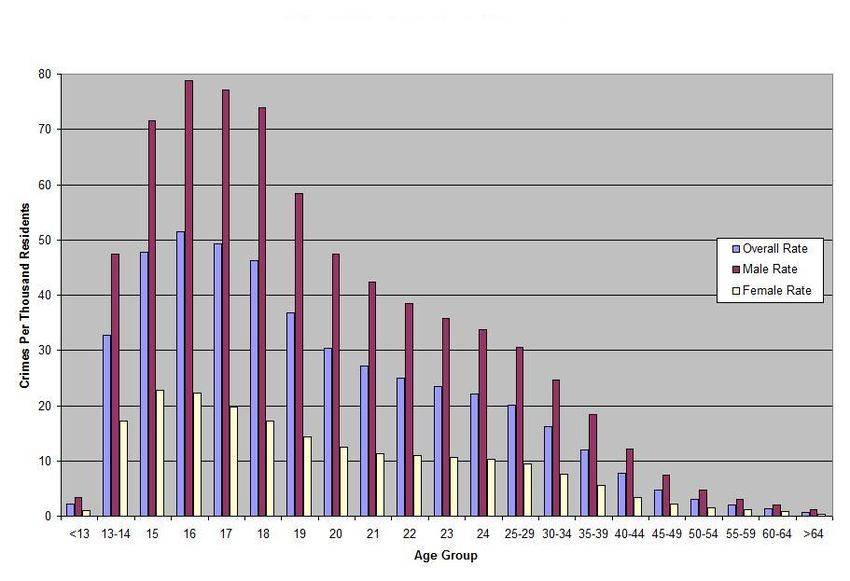
influence the weighting of crime outcomes in each county. The differences in rates of crime between
males and females is vast, as seen in Figure III. For example, a county which had an applicant
population of solely elderly women would not be expected to see large changes in crime following
legalization. Comparisons of demographic statistics between the IRCA applicant population and
national averages can be found in Table VI.
One important component of the measure of IRCA applicants per capita is a weighting utilizing
the age and sex of each county’s IRCA applicants. This allows for the control of the differential
potential to commit crimes by residents of varying age and sex. That is, a county where the entire
population of IRCA applicants is young and male will naturally be predicted to have a greater
change in crime upon legalization than one in which the entire population of applicants is elderly
and female. This weighting allows for a more accurate comparison of the groups of applicants across
counties and across time.
The weighting is constructed using the FBI’s demographic statistics on violent and property
crimes per capita. Using these numbers, I create a cumulative index, by county and year, which
gives the predicted number of crimes per capita of IRCA applicants given their age and sex. The
weight is then given by this index divided by the predicted number of crimes per capita of the
entire population of IRCA applicants. Thus, if the population of IRCA applicants in county A
is expected to commit 100 crimes per 1000 while the population of IRCA applicants county B is
10expected to commit 50 crimes per 1000, the weight given to the legalizations in county B will be
equal to 2. Compared to the native population, the average IRCA applicant, based on age and sex
characteristics, would be expected to commit about 2 times as many crimes as the average native.
3
One limitation of the IRCA data is that the locational data that is used is the answer to a
question of ‘County of Intended Residency’ subsequent to the IRCA. If a large amount of applicants
changed locations during the legalization period, the comparisons of pre- and post-IRCA crime
rates in counties would not correspond exactly to the desired measure. However, as previously
noted, surveys of IRCA applicants conducted after legalization showed no large trends in mobility.
Furthermore, there is evidence from the United States Immigration and Naturalization Service that
these applicants did not exhibit large amounts of long-range mobility in search of new labor market
opportunities. Due to such evidence, I can be relatively confident in the necessary assumption that
the ‘County of Intended Residency’ represents both the county of residency prior to and following
the IRCA for the vast majority of IRCA applicants.
The second primary data source for this paper is the set of Uniform Crime Reports, data
which are collected by the Federal Bureau of Investigation. These data are collected annually
using standard methodology across the country, thereby providing an even-handed look across all
counties. The data is collected directly from law enforcement agencies or from state reporting
agencies. The data is checked for errors and for consistency by the FBI, sometimes necessitating
further contact with the reporting agency and corrections to the initial reports. For the purposes
of this paper, annual Uniform Crime Reports (UCR) from 1980-1999, publicly available from the
FBI website, are used. I will use data on the total number of arrests by county as well as Total
Crime Reports by county. The arrests data contains information on what offense the perpetrator
was arrested for and the race of the perpetrator. The mean value of arrests per capita by county
is approximately 0.03-0.04 for all years. This data contains county level data for each year used
in the categories of homicide, forcible rape, robbery, assault, burglary, larceny, motor vehicle theft,
and arson. The first four of these types are classified as violent crimes and the last four as property
crimes. In addition, crimes such as alcohol, gambling, and ‘other’ crimes are recorded. Using this
dataset does pose a problem if crimes that are not measured by it, such as vandalism or fraud, are
more often committed by undocumented immigrants or by natives. Despite some shortcomings,
these measures of crimes still provide the most comprehensive national measure possible, as they
are generally the most serious crimes and much of interest in and of themselves.
In addition to these primary sources, I utilize a number of other datasets to provide additional
control variables for my analysis. Data on numbers of police officers or police department employees
3
Over all counties and based on age and sex characteristics, the average IRCA applicant would be expected to
commit 1.98 times more crime overall, 1.86 times more for solely property crimes, and 2.28 times more for violent
crimes.
11is taken from the Uniform Crime Reporting Program Data: Police Employee (LEOKA) Data. This
data was obtained by an annual Law Enforcement Employees Report which was sent to police
agencies throughout the country by the FBI. This gives a count of the number of full-time law
enforcement employees, both officers (that is, those who are sworn, full-time law enforcement
personnel with full arrest powers) and civilians, at each agency. These agencies are coded at a
Standard Metropolitan Statistical Area level, and I aggregate these numbers to the county level.
This data allows me to control for the number of police officers and police employees at a county-
year level. In addition, I use Bureau of Justice Statistics data regarding the number of prisoners
under federal or state jurisdiction, by year and state.
Finally, other economic controls, namely county level unemployment rates and poverty rates, are
used. Unemployment rates are taken from the Bureau of Labor Statistics Local Area Unemployment
Statistics database. I report these unemployment rates at the county-year level when possible and
at the state-year level when county level numbers are not available. Poverty rates are taken from
1990 and 2000 Census data, compiled by the Economic Research Service of the United States
Department of Agriculture. These datasets give county level poverty statistics for 1989 and 1999,
allowing limited controls for poverty by county and decade.
4 Results
4.1 OLS Results
My primary empirical strategy is a panel OLS measure of the impact of the IRCA, measured by
the number of legalized IRCA applicants per capita, on the amount of crime by county and year.
CrimeP erCapit =
β0 + β1 IRCAit + β2 Wit + β3 Y ear1980 + . . . + β22 Y ear1999 + β23 County1 + . . . + β3161 County3139 + uit
The measure of the county level impact of the IRCA is a yearly weighted measure of IRCA
applicants per capita. The weighting is done to control for the different age and sex composition
of the IRCA applicants across different counties. The weighted measure describes a cumulative
percentage of each county which has been legalized by the IRCA. From 1980 until 1986, this
measure is 0 for all counties, as no immigrant has yet been legalized. From 1987-1990, the measure
increases for counties which have IRCA applicants living in them. Finally, after the period of
legalization is over, the measure remains relatively constant, only changing due to fluctuations in
population a given county. Figure IV gives an example of this variable for Santa Clara County over
time.
Using a cumulative measure of the legalized population has distinct advantages over using a
simpler difference-in-differences or regression discontinuity design. It allows me to exploit some of
12the quasi-randomness in timing of legalization to more precisely estimate effects that may occur
upon legalization. As noted in Section 3, the new INS procedures caused some applications to
be sent to different locations and experience wide variation in the time to approval for similar
applications filed at the same time. For this reason, any effect of legalization on crime should be
seen to arrive more quickly in counties which had more applications approved in 1987 relative to
another county with a majority of applications not approved until 1990.
The level of crime is measured using the number of arrests per capita by year and county for
each of the county-year observations. The primary specification utilizes data from crimes of all
types except for drug crimes (approximately 6% of the total sample), though my results are robust
to restricting the analysis to various sub-samples of crime, such as solely property or violent crimes,
or to the inclusion of drug crimes.
As there have been large national shifts in the amount of crime per capita over the past decades,
yearly indicators are added in order to control for nation-wide shifts in crime. In addition, county
indicators are added, as thee incidence of crime varies greatly across counties, from fewer than 5
crimes per year per 1000 residents to more than 100 per year per 1000 residents. The national
average was approximately 25-30 crimes per year per 1000 residents. Finally, I cluster standard
errors by county to aid in accounting for measurement error arising at the county-reporting level.
Table I shows results from OLS regressions of the log of total arrests per capita on the cumulative
amount of IRCA applicants per capita who had been legalized. Column (1) displays this regression
including other county level controls as well as county and year fixed effects. I find an increase of
one percentage point in the number of legalized IRCA applicants per capita (e.g. 1 legalized IRCA
applicant per 100 individuals in a county) drives a fall in overall crime of 4.4%. Column (2) reports
results from the same regressions with a sample restricted to counties with non-zero numbers of
IRCA applications. I find a similar drop in crime, of approximately 3.9%, within this group.
Column (3) gives results without economic controls, of unemployment and poverty rates, which
leaves the effect of IRCA legalizations relatively unchanged. I see a loss of significance in column
(4), which does not include any year or county dummies. These results show the importance of
controlling for both county-level fixed effects, and for strong time trends at the national level, which
obscure a more accurate view of the effect of IRCA legalizations.
Columns (5) and (6) report results for differing subsections of arrests. Column (5) restricts its
dependent variable to be a measure of arrests for solely violent crimes, while column (6) does the
same but for property crimes. Both find declines in crime, with a fall in violent crime of 2.9% and
a fall in property crime of just under 5.3%.
4.2 Differenced Measure and Placebo Tests
I also examine a differenced measure of crime that uses only the county variation in total number
of IRCA applicants and disregard the variation stemming from the different years of legalization.
13This gives a measure of the change in crime between various periods as a function of the total
number of IRCA applicants, legalized or not, living in each county.
(CrimeP erCapi1991 − CrimeP erCapi1986 ) =
β0 + β1 (IRCAi1991 − IRCAi1986 ) + β2 (Wi1991 − Wi1986 ) + ui
One benefit of this specification is that it allows for placebo tests on either side of the period
of legalization. I run this specification for differences in crime between 1981 and 1986, prior to the
legalization, as well as between 1991 and 1996, after all applicants had already been legalized. For
each, I use the same independent variable, the total number of IRCA applicants per capita in a
county. This provides for a test of long-run trends in crime by county which are correlated with
the total number of IRCA applicants per capita in each county. If there were exogenous trends
towards lower or higher crime in counties with high levels of IRCA applicants per capita, these
placebo tests will return a non-zero result.
Columns 1-3 of Table II present results from my regressions which use only a measure of the
change in crime between 1986 and 1991. These measures of change in crime are regressed on the
total number of IRCA applicants per capita in each county, representing the total population which
was legalized over this period. Column (1) gives results from this regression on all crime, finding a
drop of approximately 1.7% in crime. Columns (2) and (3) present regressions using the differenced
amount of violent and property crime during this period, respectively. While I find no significant
effect for of violent crime during the period surrounding the legalizations, I do find a significant fall
in property crime arrests of approximately 1.8%.
Columns 4-7 display results for placebo tests with differenced measures of changes in crime. In
contrast with Columns 1-3, these regressions use differences in crime between 1981 and 1986 as well
as the difference between 1991 and 1996, which saw no change in number of legalized applicants.
I find no significant effects of the presence of IRCA applicants in the 1981-1986 period for either
violent crime or property crime. This null result gives more confidence that there were not county-
specific trends towards lower crime which were correlated with the amount of IRCA applicants in
a county. For the period following legalization, in columns 6-7, I do find negative and significant
results, with violent crime and property crime all falling around 3%. This suggests that counties
with large numbers of IRCA legalizations continued to experience declines in crime after the years
of legalization.
4.3 Yearly Regressions
I also run tests on single year subsets of my data with the independent variable the total number of
IRCA applicants (not just the subset legalized in that year) per capita who reside in a county and
as the dependent variable, the level of crime per capita in the county. This specification returns the
14relationship between IRCA applicants per capita and crime per capita, by county, for each year. If
there is truly a causal effect of the legalizations, the coefficients on the number of IRCA applicants
will show a distinct jump (either up or down), during and following the period of legalizations.
For instance, with the hypothesis that legalization will decrease crime to the level among natives
from a higher initial level, one would expect to see significantly positive coefficients on the number
of IRCA applicants per capita in the pre-legislation period, followed by a sharp decrease during
1987-1990, and then coefficients statistically indistinguishable from zero in the post-legalization
period. If the legalizations have no effect, I expect to see coefficients which are not significantly
different year to year, but cannot make a prediction on the sign or magnitude of these coefficients.
Table III reports results from yearly regressions of the effect of the total IRCA applicant pop-
ulation per capita on crime by county. The results are graphed in Figure V, displaying the effect
of a one percentage point increase in the IRCA population in a county (from 1% of a county to
2%, for example) on the amount of crime per capita. The graph shows that the presence of IRCA
applicants was, prior to the late 1980’s, associated with higher levels of crime per capita. During
the late 1980’s and early 1990’s, the period coinciding with the 1986 IRCA legalizations, there is
a marked drop in the strength of this relationship. After the period of legalizations concludes,
the relationship also stabilizes at approximately 0; that is, the presence of IRCA applicants (now
legalized) is not correlated with differing levels of crime. This suggests a that the presence of IRCA
applicants prior to their legalization is associated with a higher initial level of crime while, subse-
quent to legalization, this association disappears, their presence no longer an indicator for higher
crime.
4.4 Robustness Results
In Table V, I also present a number of specifications which control for additional variables and
further robustness checks for my OLS regressions. Column (1) gives results with the inclusion of
urban-year dummies, finding little effect as the inclusion heightens the drop in crime per capita to
4.6%. Column (2) displays results for using a population-weighted least squares approach across
counties with little effect on my results. Column (3) shows results where I restrict my sample to the
years of application and legalization, 1986-1990. This method exploits more heavily the variation
in timing of legalization across counties and yields a somewhat smaller estimate of the effect of
legalization. This is consistent with the findings in Table II where a continued drop in crime was
seen in the years following legalization. Column (4) gives results for a measure of crime inclusive
of drug crimes, finding a somewhat smaller but similar and still significant result.
Column (5) adds the logged number of prisoners in a state as well as the number of police
per capita in a given county. Column (6) includes a ‘crack index” designed to alleviate some
concerns regarding correlation with the crack ‘epidemic’ during the late 1980’s. As this boom
and fall in crack-related crime occurred during much the same period as the IRCA legalizations,
15there is a worry that the incidence of crack usage could be correlated with the amount of IRCA
legalizations and thus bias my results. To this end, I utilize a “crack index” constructed by Fryer,
et al (2006) to control for the effect of the boom and decline of the crack epidemic. This crack index
is constructed as an annual state-level weighted set of proxies for crack usage, with the weights
given by the squares of the loadings on each proxy. Proxies include things such as cocaine arrests,
cocaine-related emergency room visits, crack mentions in newspapers, and DEA drug busts. The
index has a strong correlation with a variety of social indicators such as homicide victimization
rates among African Americans, low birth weight babies, child mortality, and overall crime rates.
Additionally, I add a lagged measure of abortions by state in Column (7), as Levitt (2004) asserted
this to be one potential driver of a fall in crime.
Table VI explicitly leverages the variation in timing of legalization within counties to estimate
the impact of the IRCA. Given the fact that the INS was overwhelmed with applicants, some
applications took much longer to process than others, even those from the same country and filed
at the same time. I construct a ‘predicted’ IRCA legalizations per capita derived by regressing the
legalization month on the month of filing, the county of filing, and a host of individual applicant
characteristics such as age, sex, marital status, and race. That is, I construct the predicted number
of IRCA applicants that should have been legalized in a given county if each applicant experienced
the average processing time to legalization, conditional on observables. The results of this regression
can be seen in Column (1), with a point estimate nearly identical to the baseline estimation, as
would be expected due to the fact that the actual IRCA per capita values are essentially random
noise around this series. I then employ my baseline specification including both the predicted
cumulative number of legalized immigrants per capita as well as the residual number of applicants
per capita. In columns (2) and (3) I add in this residual IRCA per capita series. Here I also see a
negative and significant coefficient that is statistically indistinguishable from the baseline estimate
and from the predicted IRCA per capita coefficient. This results yield additional confirmation that
it was the legalizations that drove crime down and not other trends or unobservable characteristics
in the applicants the caused the declines since both the predictable and and ‘unpredictable’ pace
of legalization led to similar declines in crime.
4.5 Instrumental Variables Results
Finally, I also perform an instrumental variables analysis to aid in addressing any omitted variables
problems causing spurious correlations between IRCA applicants and crime.
I take direction from Ottaviano and Peri (2005) and Peri (2009), utilizing the distance from
major sources of immigration as an instrument for the number of IRCA applicants per capita in a
county. Being geographically based, there is a strong cause for exogeneity of the instrument as well
as a high correlation of the instrument with the amount of IRCA applicants per capita in a county.
Distance from major ports of entry increases moving costs, inducing higher levels of immigrants
16to settle near these entry points. As the sources of immigration, I use the three largest ports of
immigration, Los Angeles, New York, and Miami, as well as the border between Mexico and the
United States.
Using GIS, I calculate the population-weighted geographical center of each county in the United
States. With this data, for each county I determine the distance between its population-weighted
center and the closest major immigrant port city (Los Angeles, New York, Miami) as well as to the
nearest part of the Mexican-United States border (smallest distance to one of 12 segments of the
border) in terms of geodesic distance, yielding two distance-based measures per county.
The second instrument consists of predicted shares of immigrants by state, based on the popu-
lation of immigrants already present in states in 1950. Using nationality of origin and population
data from the Census, I construct a snapshot of the population of immigrants in 1950. I then
calculate the national rate of growth of each nationality and apply this growth rate to the initial
population of immigrants in 1950. I thereby arrive at a predicted number and share of immigrants
in each state in 1990.
For both of these instruments, I interact with year indicators in order to capture the dynamics
of legalization by county over time, as each instrument is static over time at a county level.
First Stage:
IRCAit = γ0 + γ1 Distancesit + γ2 ExpectedImmSharest + γ3 Wit + Y earDummies + eit
Second Stage:
CrimeP erCapit = β0 + β1 IRCA
g it + β2 Wit + Y earDummies + uit
Columns (1) and (2) of Table VII report OLS results for my primary set of results as well as
results restricting to solely those counties that reported a non-zero number of IRCA applicants.
Column (3) reports IV results over all counties and including all instruments. Here I find a sig-
nificantly higher effect of legalization, of almost 19%. Columns (4) - (6) display results restricting
to counties reporting a non-zero number of IRCA applicants, as this greatly increases the power of
the first stage and this sample is less prone to measurement error (counties with under 25 reported
IRCA applicants were reported as having 0 applicants to preserve anonymity). Column (4) utilizes
all instruments while Columns (5) and (6) use only the distance-based instruments or the predicted
immigrant share instruments. Here I find results which are broadly in line with my OLS estimates,
with a significant decrease in crime of over 5% due to a 1 percentage point increase in the number
of legalized IRCA applicants in a county.
5 Labor Market Model
As a primary explanation of the observed decline in crime following the 1986 IRCA, I propose a
formal labor market model which relates shifts in labor market outcomes due to legalization with
17changes in rates of crime based on evidence that crime is related to both levels of income and
alternate uses of time.Thus, the additional labor market opportunities, in the form of new jobs and
higher wages, available to legalized IRCA applicants, would have a significant affect on crime rates
among this group by increasing income and participation rates in the legal labor force.
The model I propose is a partial equilibrium model of the labor market and crime. In the
model, an agent allocates his time between four activities: formal sector employment (f ), informal
sector employment (i), a crime sector (r), and a job search sector (s). Participation in full-time
employment is stochastic and driven by unmodeled macroeconomic trends, but is also influenced
by an agent’s job search effort while unemployed as well as by his choice of time spent in the
crime sector. The agent gains utility from log consumption and has a quadratic utility cost of
participating in the crime sector, reflecting an innate distaste for crime. Finally, the agent has a
probability of being caught when committing crime that is increasing in the amount of time he
allocates to the crime sector. If caught, he receives only c consumption in the current period, and
is disqualified from full-time sector employment in the following period, representing time spent in
jail.
The agent maximizes:
(1) V = g(rt )logc + (1 − g(rt ))logct − θrt2 + β(V 0 )
ct ≤ wf ft + wr rt + wi it
wf > wr > wi
Where wi is the exogenously determined wage in sector i ∈(formal, crime, informal). By
maintaining this condition on relative wages, I restrict the analysis to only cases where it is optimal
to desire to work in the formal sector and where the optimal amount of time spent in the crime
sector is not 0.
st + rt + it = h − ft
ft ∈ (0; h)
As seen here, if employed in the full-time sector, this employment consumes h of the agent’s
r2
available time and the remaining (h−h) of time is allocated among the other sectors. I set g(r) = 2
h
such that crime increases the probability of being caught at an exponential rate, and if all available
time is spent in the crime sector, the probability of being caught is 1.
The dynamics of the full-time job transition are shown here, where the top left value represents
moving from formal sector work to formal sector work, the middle left represents moving from
informal sector work to formal sector work, the top middle represents moving from informal sector
work to formal sector work, the center shows the probability of remaining in informal sector work,
while the right-most column and bottom row show probabilities of entering and exiting prison:
18
(1 − γ)(1 − g(rt )) λ(1 − g(rt ))h(st ) 0 Ift
1 − ((1 − γ)(1 − g(rt ))) 1 − (λ(1 − g(rt ))h(st )) 1 1 − If − IP rison
t
g(rt ) g(rt ) 0 IP rison
= (Pr(Employed) Pr(Unemployed) Pr(Prison))
g(r), g 0 (r), g 00 (r) ≥ 0
h(s), h0 (s) ≥ 0, h00 (s) ≤ 0
γ =exogenous gross rate of formal sector separation
λ =exogenous gross rate of formal sector hiring
g(rt ) =probability of being apprehended as an increasing function of time spent in the crime sector
h(st ) =multiplier which increases the probability of formal sector hiring as a function of time allo-
cated to job search
I solve the model separately for IRCA applicants and legal residents (hereafter referred to as
natives). IRCA applicants and natives are differentiated in the model by differing access to the
formal employment sector. Prior to legalization, IRCA applicants are not able to access the formal
employment sector, and must divide their time between only the informal or part-time employment
sector and the crime sector (having no use for the job search activity). Following legalization,
they also have access to the full-time employment sector. However, after the 1986 IRCA, all IRCA
applicants begin as ‘unemployed’ (participants in only the part-time/informal sector), and only
gain employment over time through their own job-search efforts and natural churn in the labor
market. Thus, they do not reach full steady state employment for a number of years following their
legalization.
In this model, the level of crime in a year is given by (δ ∗ra +(1−δ)∗rn ) where δ is the fraction of
IRCA applicants in the population and ra and rn are the optimal amounts of time IRCA applicants
and natives/legal residents, respectively, allocate to the crime sector. Thus, the level of crime is
equal to the total proportion of time allocated to the crime sector throughout the economy relative
to the total amount of time available.
5.1 Model Results
To obtain a complete set of results from this model, I must solve it for a number of groups: for
employed natives, unemployed natives, and for IRCA applicants prior to amnesty. Each solves:
V = g(r)logc + (1 − g(r))logc − θr2 + β(V 0 )
ct ≤ wf f + wr r + wi i
19V 0 = P r(VE |s, r)VE + P r(VU |s, r)VU
That is, utility is equal to current period utility plus the discounted utility from next period,
which is equal to the weighted sum of employed utility and unemployed utility. I numerically solve
for r∗ and s∗ , which are optimal levels of crime and job search, for Unemployed Natives, Employed
Natives, and Unlegalized IRCA Applicants.
5.2 Comparative Statics
For a high-level overview of the model’s implications, I compute the comparative statics of a
number of variables. These results are shown in Table IX. First examining comparative statics for
unlegalized IRCA applicants, I find the expected results: that the time spent in the crime sector
rises as consumption subsequent to being caught rises and falls when innate distaste for crime rises.
Furthermore, I find that time in the crime sector increases when wages from crime increase, and
falls when wages from the informal or part-time sector increase.
Turning to the native population, I again find similar results by numerically solving for optimal
levels of time spent in the crime, job search, and informal or part-time sector. I can see that the
native population responds to wage changes or parameter shifts in much the same way as does
the IRCA Applicant population. In addition, both employed and unemployed natives decrease the
amount of time spent in the crime sector as formal/full-time sector wages increase, as they seek to
maximize the chance they keep, or find, a full-time job.
However, employed and unemployed natives diverge in their responses to changes in job losing
rates and job search parameters. Whereas employed workers increase time in the crime sector if the
gross job losing rate increases, due to the lessened marginal impact of crime on the net job losing
rate, unemployed workers decrease time in the crime sector. Furthermore, while employed workers
decrease time spent in the crime sector when α increases, reflecting the desire to avoid a worsened
spell of unemployment, unemployed workers do the opposite, increasing time spent on crime.
5.3 Parameterization
I calibrate parameters γ, λ, wf , and wi to correspond to real-world values of rates of job losing,
job finding, full-time and part-time sector pay pay. For γ and λ, I use data from the Bureau of
Labor Statistics and the Global Financial Database to construct average rates of job losing and job
finding. λ and γ, are both calibrated so that the net rates of job finding and job losing are equal
to their true averages. That is, rates of job finding and job losing include equilibrium search time
and equilibrium rates of crime in their construction, as well as the ‘gross’ rates characterized by γ
and λ.
For natives, full-time pay, wf , is taken from US Census data regarding median earnings of the
full national population of adults aged 25-64 engaged in full-time year-round work. Part-time pay,
20You can also read