Efficacy of Molekule Air Mini Device against MS2 and Particulates - Prismic
←
→
Page content transcription
If your browser does not render page correctly, please read the page content below
www.arelabs.com
                                                                                                          (p) 913-850-6630 (f) 913-850-6635

        Efficacy of Molekule® Air Mini Device against MS2 and
                             Particulates

Jamie Balarashti a, Zach Conley a
a
    Aerosol Research and Engineering Laboratories Inc. Olathe KS

              Background: This in vitro study characterized the efficacy of the Molekule® Air Mini Device at removing
              aerosolized MS2 Bacteriophage. The Molekule® Air Mini device, Molekule Inc. (San Francisco, CA), is designed
              as a home air purifier, and features Photo Catalytic Chemical Oxidation technology, allowing it to reduce
              airborne bacteria, viruses, and fungal spores in order to decrease infections rates from airborne pathogens.
              For this study the Molekule® Air Mini device was challenged using aerosolized MS2 bacteriophage which has
              been historically used as a surrogate for influenza, a common airborne infection with wide ranging impacts.
              The CDC estimates that the influenza virus is responsible for 140,000 to 810,000 hospitalizations and 12,000
              to 61,000 deaths annually. This study evaluated the efficacy of the device against aerosolized MS2
              bacteriophage as well as various sizes of polystyrene latex microspheres (PSL) in a stainless steel bioaerosol
              chamber. The study consisted of a total of four (4) live bioaerosol trials, single (1) bioaerosol control run plus
              three PSL (3) challenge trials as well as PSL control trials.

              Methods: MS2 bacteriophage was aerosolized into a sealed environmental bioaerosol chamber containing
              Molekule® Air Mini device. AGI Impinger samples were taken every 30 minutes from the chamber in order to
              quantify the reduction speed and capabilities of the Molekule® Air Mini device. AGI impingers were used to
              sample chamber bioaerosol concentrations, all impinger samples were serially diluted, plated and
              enumerated in triplicate to yield viable bioaerosol concentration at each sampling point and time. Chamber
              control trial data was subtracted from Molekule trial data to yield net LOG reduction in the chamber for the
              bioaerosol challenges.

              Results: When tested against the MS2 bacteriophage the device showed a high net log reduction in a
              relatively short amount of time with average log reduction values ranging from 3.48 net Log in 60 minutes to
              5.09 net log in 120 minutes. After 90 minutes the device achieved a greater than 4 net log reduction and had
              an average net log reduction of 4.18 log reduction in the chamber (90 minutes).

              This study was conducted in compliance with FDA Good Laboratory Practices (GLP) as defined in 21 CFR, Part
              58.

Introduction                                                              Study Overview

     This study was conducted to evaluate the efficacy of                       The effectiveness of the Molekule® Air Mini Device
the Molekule® Air Mini (Molekule, San Francisco CA) air                   was evaluated against a single RNA virus which was MS2
purification device at reducing aerosolized MS2                           Bacteriophage. For more organism information please see
bacteriophage. The Molekule® Air Mini device is a small air               species selection section in the body of this report.
purification intended for use in small to medium size                     Particulate testing was also performed with polydispersed
rooms. The unit has several different settings ranging from               latex microspheres ranging from 0.5 to 5um.
low to high. All testing conducted during this study utilized
at the highest device setting.                                                 Testing was conducted to characterize the single
                                                                          Molekule® Air Mini unit against a single RNA
    The Molekule® Air Mini contains a photocatalyically                   bacteriophage three (3) independent trials as well as a
impregnated MERV 16 grade filter with to UV lights to                     single (1) control trial to demonstrate the capability of the
capture and reduce viable airborne organisms. The test                    Molekule® Air Mini device to reduce viable bioaerosol
plan incorporated challenging the Molekule® Air Mini                      concentrations therefore theoretically reducing chances
device in a closed environmental chamber to determine                     of airborne infection. This study does not make any claims
the destruction rate of MS2 bacteriophage by the                          regarding the efficacy of this device at reducing airborne
Molekule® Air Mini device. A picture of the Molekule® Air                 infections.
Mini device is shown in Figure 1, on the following page.

ARE Labs Inc. 2020                          Efficacy of Molekule® Air Mini™ System against MS2 Bioaerosols                         1 of 12
www.arelabs.com
(p) 913-850-6630 (f) 913-850-6635
Figure 1: Picture of Molekule® Air Mini Device
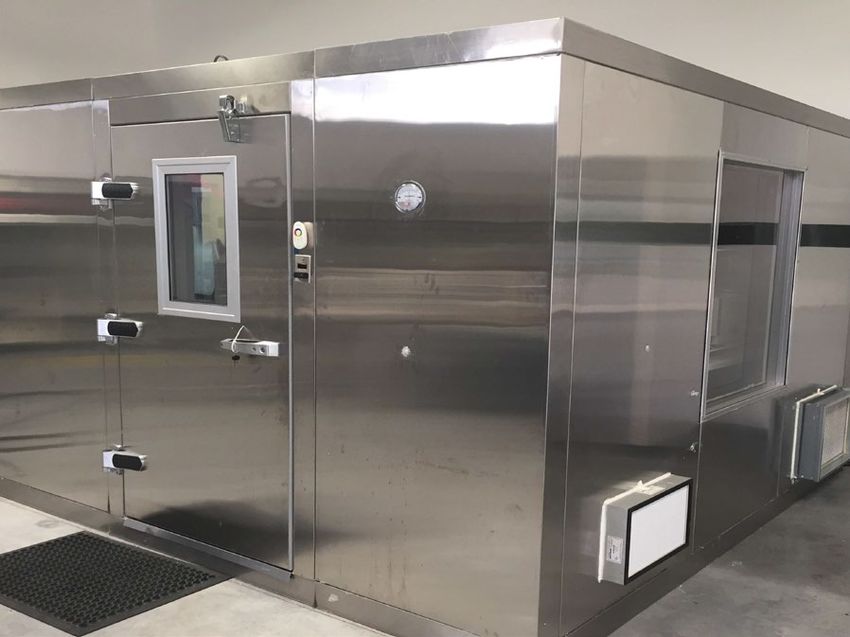
Bioaerosol Testing Chamber The aerosol sampling and aerosol dissemination
probes are stainless steel and bulk headed through the
chamber walls to provide external remote access to the
A large sealed aerosol test chamber was used to
aerosol generator and samplers during testing.
replicate a potentially contaminated room environment
and to contain any potential release of aerosols into the
surrounding environment.
The aerosol test chamber is constructed of 304
stainless steel and is equipped with three viewing
windows and an air-tight lockable chamber door for
system setup and general ingress and egress. The test
chamber internal dimensions are 9.1ft x 9.1ft x 7ft, with a
displacement volume of 562 cubic feet, or 15,914 liters.
Figure 2 shows the bioaerosol chamber used for all testing
in this study.
The chamber is equipped with filtered HEPA inlets,
digital internal temperature and humidity monitor,
external humidifiers (for humidity control), lighting Figure 2: Bioaerosol Test Chamber Exterior.
system, multiple sampling ports, aerosol mixing fans, and
a HEPA filtered exhaust system that are operated with The test chamber is equipped with two high-flow
wireless remote control. For testing, the chamber was HEPA filters for the introduction of filtered purified air into
equipped with four 3/8-inch diameter stainless steel the test chamber during aerosol evacuation/purging of the
probes for aerosol sampling, a 1-inch diameter port for system between test trials and a HEPA filtered exhaust
bio-aerosol dissemination into the chamber using a blower with a 500 ft3/min rated flow capability for rapid
Collison 24-jet nebulizer for the aerosolization of the evacuation of remaining bioaerosols.
bacteriophage.
A Magnehelic gauge with a range of 0.0 +/- 0.5 inch
A ¼ inch diameter probe was used for continuous aerosol H2O (Dwyer instruments, Michigan City IN) was used to
particle size monitoring via a TSI Aerodynamic Particle monitor and balance the system pressure during aerosol
Sizer (APS) model 3321. All sample and dissemination generation, aerosol purge and testing cycles.
ports were inserted approximately 18 inches from the
interior walls of the chamber to avoid wall effects and at a
height of approximately 40 inches from the floor.
ARE Labs Inc. 2020 Efficacy of Molekule® Air Mini™ System against MS2 Bioaerosols 2 of 12www.arelabs.com
(p) 913-850-6630 (f) 913-850-6635
Figure 3: Bio-Aerosol Test Chamber Flow Diagram.
Bioaerosol Generation System Aerosol particle size distributions and count
concentrations were measured in real-time through the
Test bioaerosols were disseminated using a Collison duration of all control and Molekule® Air Mini™ trial runs
24-jet nebulizer (BGI Inc. Waltham MA) driven by purified using a model 3321 Aerodynamic Particle Sizer (APS) (TSI
filtered house air supply. A pressure regulator allowed for Inc., St Paul, MN). The APS sampled for the entire duration
control of disseminated particle size, use rate and sheer of all trials (90-120 minutes) with 1-10 minute sampling
force generated within the Collison nebulizer. intervals. A general flow diagram of the aerosol test
system is shown above in Figure 3 above.
Prior to testing, the Collison nebulizer flow rate and
use rate were characterized using an air supply pressure Species Selection
of approximately 60 psi, which obtained an output
volumetric flow rate of 50-80 lpm with a fluid Species selection is based on Biological Safety Level 1
dissemination rate of approximately 1.25 ml/min. The (BSL1) surrogates for BSL3 pathogenic organisms. MS2 is a
Collison nebulizer was flow characterized using a viral RNA bacteriophage that is commonly used as a
calibrated TSI model 4040 mass flow meter (TSI Inc., St surrogate for the influenza virus.
Paul MN).
Viral Culture & Preparation
Bioaerosol Sampling and Monitoring System
Pure strain viral seed stock and host bacterium were
Two AGI impingers (Ace Glass Inc. Vineland NJ) were
obtained from ATCC. Host bacterium was grown in a
used for bio-aerosol collection of all biological aerosols to
similar fashion to the vegetative cells in an appropriate
determine chamber concentration. The AGI-30 impinger
liquid media. The liquid media was infected during the
vacuum source was maintained at a negative pressure of
logarithmic growth cycle with the specific bacteriophage.
18 inches of Hg during all characterization and test
After an appropriate incubation time the cells were lysed
sampling to assure critical flow conditions. The AGI-30
and the cellular debris separated by centrifugation. MS2
sample impingers were flow characterized using a
stock yields were greater than 1 x 10¹¹ plaque forming
calibrated TSI model 4040 mass flow meter.
units per milliliter (pfu/ml) with a single amplification
procedure. This stock MS2 viral solution was then diluted
ARE Labs Inc. 2020 Efficacy of Molekule® Air Mini™ System against MS2 Bioaerosols 3 of 12www.arelabs.com
(p) 913-850-6630 (f) 913-850-6635
with PBS to approximately 1 x 10¹⁰ plaque forming units testing in the chamber. This data has been normalized to
per milliliter (pfu/ml) for use in the Collision nebulizer. show percent reduction as a function of time in the
chamber. Control trials were performed with chamber
Plating and Enumeration mixing fans “on” during the entirety of the trial.
Additionally, the Air Mini trials also had the mixing fans
Impinger and stock biological cultures were serially “on” during the entire trial also for consistency of test
diluted and plated in triplicate (multiple serial dilutions) methods. Looking at the data we can see the sharp drop
using a small drop plaque assay technique onto tryptic soy in particle number concentration with the Air mini in
agar plates. The plated cultures were incubated for 24-48 operation (please not the LOG scale of the y-axis). This
hours and enumerated and recorded. figure also shows that after 60 minutes of operation by the
Air Mini device limits-of-detection for the APS are reached
Inert Particle Characterization (0.001 particle per cc or 1 particle per liter)
In order to calculate the dissemination efficiency and Figure 5, on the following page, shows the NET LOG
stability of the bioaerosol, polystyrene latex microspheres reduction for 0.5, 1.0 and 2.0 µm PSL microspheres. The
(PSL microspheres) were used to characterize the various net log reduction of all tested sizes of PSL microspheres
aspects of the chamber system. Polydispersed PSL follows a precise logarithmic function for both cases. The
microspheres with aerodynamic diameters of 0.5 - 5.0μm figure shows the comparison between the reduction with
were nebulized, in DI water, using the Collison nebulizer and without the device in operation. It is notable that this
and chamber concentrations and sizes were recorded size (0.5um) is smaller than all vegetative bacteria,
using the APS. The APS recorded individual particle count bacterial endospores, mold spores and pollens; it is also
from 0.5 to 20.0 µm in size with 52 separate size bins of smaller than most soot particles.
resolution. In additional to these trial separate
monodispersed PSL microspheres of the following sizes The PSL microsphere trial data were used to estimate
were also used for characterization: 500nm, 1.0µm and nebulization efficiencies, particle stability and AGI-30
2.0µm. collection times and aerosol persistence prior to
Figure 4, below, shows the results for the control and bioaerosol testing.
Air Mini trials for 0.5, 1.0 and 2.0 µm PSL microsphere
Percent Reduction Using Molekule Air Mini Filter
Large chamber testing, polystyrene latex micropheres,APS particle sizer
100.000%
0.5µm Control
1.0 µm Control
2.0 µm Control
10.000%
0.5 µm - Molekule
1.0 µm - Molekule
REDUCTION PERCENTAGE
2.0 µm - Molekule
1.000%
0.100%
LImits of Detection for TSI
Aerodynamic Particle Sizer ~0.001
particles per cc (~1 particle per Liter)
0.010%
0.001%
0 60 120 180 240 300 360
TIME (MIN)
Figure 4: PSL Microspheres Chamber Trials for the Control and Molekule® Air Mini Device. Chart
shows percent reduction versus time. Note that the y-axis is a LOG scale.
ARE Labs Inc. 2020 Efficacy of Molekule® Air Mini™ System against MS2 Bioaerosols 4 of 12www.arelabs.com
(p) 913-850-6630 (f) 913-850-6635
Net LOG Reduction Using Molekule Mini Filter
Control minus Air Mini Data, Large chamber testing, polystyrene latex micropheres,APS
particle sizer
0.00
0.5 µm - Molekule
Log-linear Trend implies particle
-1.00 1.0 µm - Molekule
filtration effeciency for 500nm and
larger particle is the same.
2.0 µm - Molekule
REDUCTION PERCENTAGE
-2.00
LImits of Detection for TSI
Aerodynamic Particle Sizer ~0.001
particles per cc (~1 particle per Liter).
-3.00 Noise Floor of instrument
-4.00
-5.00
-6.00
0 15 30 45 60 75 90 105 120
TIME (MIN)
Figure 5: Net LOG Reduction of PSL Microspheres by Molekule® Air Mini Device. Control minus Air Mini Trial data for 0.5, 1.0
and 2.0 µm particle sizes in bioaerosol test chamber.
Bioaerosol Control Testing plating and enumeration to obtain average viable
bioaerosol concentrations. A complete test matrix for all
To accurately assess the Molekule® Air Mini unit, test bioaerosol trials can be found in Figure 6.
chamber pilot control trials were performed over a 120-
minute period without the device in operation to Molekule® Air Mini Testing
characterize the biological challenge aerosol for particle
size distribution, aerosol delivery/collection efficiency, For each control and challenge test, the Collison
and viable concentration over time. Control testing was nebulizer was filled with approximately 40 mL of biological
performed to provide baseline comparative data in order stock and operated at 50 psi for a period of 15 minutes
to assess the actual efficacy provided from the Molekule® (organism dependent). For control and Molekule® Air Mini
Air Mini. trials, the impingers were filled with 20 mL of sterilized PBS
(addition of 0.005% v/v Tween 80) for bioaerosol
During control runs, a single low velocity fan located collection. The addition of Tween 80 was shown to
in the corner of the bioaerosol test chamber was turned increase the impinger collection efficiency and de-
on 1 minute prior to sampling and remained on during the agglomeration of all microorganisms.
entire AGI sampling period to ensure a homogenous
aerosol concentration within the aerosol chamber. The The chamber mixing fan was turned on during
mixing fan was used for all control runs and was also used bioaerosol dissemination to assure a homogeneous
during Molekule® Air Mini decontamination trials for bioaerosol concentration in the test chamber prior to
consistency of method. The two impingers used for taking the first impinger sample.
bacteriophage sampling were pooled and mixed prior to
Target Monodispersed Sampling
Trial Run Device Organism Particle Size Trial Time (min) Period (min) Sampling
C1 Control
T1 Challenge
MS2 Bacteriophage - RNA
T2 Challenge Molekule Air Miniwww.arelabs.com
(p) 913-850-6630 (f) 913-850-6635
General Timeline for Bioaerosol Chamber Testing
Purge Nebulization Hold Hold Hold Hold Hold Hold Evac Decon
-50 t=-20 t=-5 t=12.5 t=17.5 t=27.5 t=32.5 t=57.5 t=62.5 t=72.5 t=77.5
t=0 t=42. t=47.5 t=87. t=92.5
Impinger Sampling Molekule Air Mini Turn on, t=0 min
Molekule Air Mini Turn off, t=120 min
Figure 7: General Trial Timeline for Molekule® Air Mini™ Decontamination Trials.
Following bioaerosol generation, baseline bioaerosol
concentrations were established for each pilot control and Bioaerosol Particle Size Data
Molekule® Air Mini test by sampling simultaneously with
two AGI-30 impingers located at opposite corners of the Aerosol particle size distributions were measured
chamber. AGI samples were collected for 5 to 20 minutes with the APS. The APS has a dynamic measurement range
(organism dependent) at intervals of 30 minutes of 0.5 to 20μm and was programmed to take consecutive
throughout the entire test period. Figure 7 the general real time one-minute aerosol samples throughout the
timeline for each Molekule® Air Mini live bioaerosol duration of each aerosol trial.
challenge trial.
Data was logged in real time to an Acer laptop
Collected impinger chamber samples were pooled computer, regressed, and plotted. The aerosol particle
and mixed at each sample interval for each test. Aliquots size distribution for MS2 is shown in Figure 8 with key
of impinger samples were collected and then used for values shown in Figure 9.
plating. Impingers were rinsed 6x with sterile filtered
water between each sampling interval, and re-filled with
sterile PBS using sterile graduated pipettes for sample
collection. Chamber Sampling, MS2 in PBS, Collison 24-jet Nebulizer, APS 3321 Data
For Molekule® Air Mini biological testing, the unit was
turned on immediately following a time 0 baseline sample
and operated for the entirety of the test (2 hours).
Subsequent impinger samples were taken at intervals of
30 minutes and samples enumerated for viable
concentration to measure the effective viable bioaerosol
reduction during operation of the Molekule® ir Mini device
over time. All samples were plated in triplicate on tryptic
soy agar media over a minimum of a 3 log dilution range.
Plates were incubated for 24 hours and enumerated Figure 8: Viral (MS2) Particle Size Distribution in Test
for viable plaque forming units (pfu) to calculate aerosol Chamber.
challenge concentrations in the chamber and reduction of The particle size distribution for MS2 bioaerosols are
viable microorganisms. shown to be within the respirable range for alveolar region
lung deposition and show a low geometric standard
Post-Testing Decontamination and Prep deviation (GSD of 1.35µm) indicating a monodispersed
aerosol was generated into the test chamber.
Following each test, the chamber was air flow
evacuated/purged for a minimum of twenty minutes
between tests and analyzed with the APS for particle
concentration decrease to baseline levels between each
test. The chamber was decontaminated at the conclusion
of each trial with aerosol/vaporous hydrogen peroxide
(35%). The Collison nebulizer and impingers were cleaned
at the conclusion of each day of testing by soaking in a 3%
bleach bath for 20 minutes. The nebulizer and impingers
were then submerged in a DI water bath, removed, and Figure 9: Key Particle Size Distribution Values for MS2
spray rinsed 6x with filtered DI water for a final rinse. Bioaerosol in Chamber.
ARE Labs Inc. 2020 Efficacy of Molekule® Air Mini™ System against MS2 Bioaerosols 6 of 12www.arelabs.com
(p) 913-850-6630 (f) 913-850-6635
Figure 10: MS2 Bioaerosol chamber Results. AGI-30 Impinger sampling with triplicate plating and
enumeration. Control Trial and quadruplicate Molekule® Air Mini™ Log Reduction data.
Data Analysis and trial runs are plotted showing log reduction in viable
bioaerosol for each organism. All data is normalized with
Results from the control trials were graphed and time zero (t=0 minutes) enumerated concentrations.
plotted to show natural viability loss over time in the Subsequent samples are normalized and plotted to show
chamber. These control runs served as the basis to the loss of viability over time. Figure 10 shows the log
determine the time required for the Molekule® Air Mini to reduction as a function of time for the control and
achieve a 4 log (99.99%) reduction in viable bioaerosol quadruplicate Air Mini trials with MS2
above the natural losses from the control runs. The control
Figure 11: MS2 Molekule® Air Mini™ Net LOG Reduction.
ARE Labs Inc. 2020 Efficacy of Molekule® Air Mini™ System against MS2 Bioaerosols 7 of 12www.arelabs.com
(p) 913-850-6630 (f) 913-850-6635
Figure 12: Net LOG Reduction of MS2 by Molekule® Air Mini
Results Summary of Findings
When tested against the MS2 bacteriophage the When tested against the MS2 bacteriophage, a
device showed a high net log reduction in a relatively short surrogate for influenza, the Air Mini device showed a high
amount of time at the 90-minute time point there was an net log reduction in a relatively short amount of time. By
average 4.18 Net LOG reduction. At the 120-minute time the 90-minute time point results showed an average 4.84
point the Molekule® Air Mini device had log reduction LOG reduction which equates to an average 4.18 net LOG
values ranging from 4.73 to 5.63 log with an average net reduction above the control trial. After 120 minutes the
log reduction of 5.09 log reduction in the chamber. This is device had an average net log reduction of 5.09 log. These
represented graphically in Figure 11 on the previous page results indicate that in theory the Molekule® Air Mini
shows the net log reduction for each trial as well as an device would help prevent the spread of airborne
overall average for the quadruplicate set. infection. These results are represented graphically in
Figure 8 and a summary individual trial results can be
found in Figure 9.
Average NET LOG Reduction of MS2 By Molekule Mini
Bioaerosol Type Species Surrogate Trial ID 30 min 60 min 90 min 120 min
MS2 bacteriophage
Virus Influenza 1 -1.80 -3.28 -4.18 -5.20
(RNA E. coli phage)
MS2 bacteriophage
Virus Influenza 2 -1.81 -2.78 -3.40 -4.73
(RNA E. coli phage)
MS2 bacteriophage
Virus Influenza 3 -1.95 -3.75 -4.71 -4.78
(RNA E. coli phage)
MS2 bacteriophage
Virus Influenza 4 -1.96 -4.12 -4.42 -5.63
(RNA E. coli phage)
Average -1.88 +/- 0.09 -3.48 +/- 0.58 -4.18 +/- 0.56 -5.09 +/- 0.42
Figure 13: Net Log Reduction summary table
ARE Labs Inc. 2020 Efficacy of Molekule® Air Mini™ System against MS2 Bioaerosols 8 of 12www.arelabs.com
(p) 913-850-6630 (f) 913-850-6635
References
T. Reponen, K. Willeke, V. Ulevicius et al. Techniques of Dispersion of Microorganisms in Air. Aerosol Science
and TechnoLOGy. 27: 1997. pp. 405-421.
Ding and Wing. Effects of Sampling Time on the Total Recovery rate of AGI-30 Impingers for E. coli. Aerosol
and Air Quality Research, Vol. 1, No. 1, 2001, pp. 31-36.
Flint et al. Principles of ViroLOGy. Principles of ViroLOGy (ASM). Chapter 2 ViroLOGical Methods. Vol. 2.
2008.
A. Mazzocco et al. Enumeration of Bacteriophages Using the Small Drop Plaque Assay System. Bacteriophages:
Methods and Protocols, Vol. 1: Isolation, Characterization and Interactions. vol. 501. 2009. pp. 81-95.
P Hyman et al. Practical Methods for Determining Phage Growth Parameters. Bacteriophages: Methods and
Protocols, Vol. 1: Isolation, Characterization and Interactions. vol. 501. 2009. pp. 175-201.
A. Furiga, G. Pierre, et al. Effects of Ionic Strength on Bacteriophage MS2 Behavior and Their Implications of the
Assessment of Virus Retention. University of Toulouse. 2007.
ARE Labs Inc. 2020 Efficacy of Molekule® Air Mini™ System against MS2 Bioaerosols 9 of 12www.arelabs.com
(p) 913-850-6630 (f) 913-850-6635
Analytical Testing Facility
Aerosol Research and Engineering Labs, Inc.
15320 S. Cornice Street
Olathe, KS 66062
Project #
10814.40
Study Director
Jamie Balarashti
Aerosol Research and Engineering Laboratories
GLP Statement
We, the undersigned, herby certify that the work described herein was conducted by
Aerosol Research and Engineering Laboratories in compliance with FDA Good Laboratory
Practices (GLP) as defined in 21 CFR, Part 58.
Study Director:
_________________________ __________
03/17/2020
Jamie D. Balarashti Date Date
Study Director
ARE Labs, Inc.
Principal Investigator:
_________________________ __________
03/17/2020
Zach Conley DateDate
Principal Investigator
ARE Labs, Inc.
ARE Labs Inc. 2020 Efficacy of Molekule® Air Mini™ System against MS2 Bioaerosols 10 of 12www.arelabs.com
(p) 913-850-6630 (f) 913-850-6635
Appendix A: Calculations
To evaluate the viable aerosol delivery efficiency and define operation parameters of the
system, calculations based on (theoretical) 100% efficacy of aerosol dissemination were derived
using the following steps:
• Plating and enumeration of the biological to derive the concentration of the stock
suspension (Cs) in pfu/mL or cfu/mL, or cfu/g for dry powder.
• Collison 24 jet nebulizer use rate (Rneb) (volume of liquid generated by the
nebulizer/time) at 28 psi air supply pressure = 1.0 ml/min.
• Collison 24 jet Generation time (t) = 20 or 30 minutes, test dependent.
• Chamber volume (Vc ) = 15,993 Liters
Assuming 100% efficiency, the quantity of aerosolized viable particles (VP) per liter of air
in the chamber for a given nebulizer stock concentration (Cs) is calculated as:
C s ⋅ Rneb
Nebulizer: VP = t
Vc
Plating and enumeration of the biological to derive the concentration of the dry powder (Cp)
in cfu/g.
• Eductor use rate (M p) (Mass of powder generated by the eductor in grams)
• Chamber volume (Vc ) = 15,993 Liters
Assuming 100% efficiency, the quantity of aerosolized viable particles (VP) per liter of air
in the chamber for a given dry powder stock concentration (Cp) is calculated as:
Cp ⋅ M p
Eductor: VP =
Vc
ARE Labs Inc. 2020 Efficacy of Molekule® Air Mini™ System against MS2 Bioaerosols 11 of 12www.arelabs.com
(p) 913-850-6630 (f) 913-850-6635
AGI – 30 impinger or 47mm filter collection calculation:
• Viable aerosol concentration collection (Ca) = cfu or pfu/L of chamber air.
• Viable Impinger concentration collection (CImp) = cfu or pfu/mL from enumeration of
impinger sample or filter sample.
• Impinger sample collection volume (Ivol) = 20 mL collection fluid/impinger, or
extraction fluid for filter.
• AGI–30 impinger or filter sample flow rate (Qimp) = 12.5 L/min.
• AGI–30 impinger or filter sample time (t) = 5 or 10 minutes, test dependent.
For viable impinger or filter aerosol concentration collection (Ca) = cfu or pfu/L of chamber air:
C Imp ⋅ I vol
Ca = t
Q imp
The aerosol system viable delivery efficiency (expressed as %) is:
Ca
Efficiency = ⋅ 100
Vp
ARE Labs Inc. 2020 Efficacy of Molekule® Air Mini™ System against MS2 Bioaerosols 12 of 12You can also read