Efficient Method for POI/ROI Discovery Using Flickr Geotagged Photos - MDPI
←
→
Page content transcription
If your browser does not render page correctly, please read the page content below
International Journal of
           Geo-Information

Article
Efficient Method for POI/ROI Discovery Using Flickr
Geotagged Photos
Chiao-Ling Kuo 1, *        ID
                                , Ta-Chien Chan 1     ID
                                                           , I-Chun Fan 1,2 and Alexander Zipf 3   ID

 1    Research Center for Humanities and Social Sciences, Academia Sinica, Taipei 115, Taiwan;
      dachianpig@gmail.com (T.-C.C.); fic@mail.ihp.sinica.edu.tw (I.-C.F.)
 2    Institute of History and Philology, Academia Sinica, Taipei 115, Taiwan
 3    Institute of Geography, Heidelberg University, 69120 Heidelberg, Germany; zipf@uni-heidelberg.de
 *    Correspondence: kuo@chiaoling.com; Tel.: +886-2-2785-7108 (ext. 311)

 Received: 17 January 2018; Accepted: 12 March 2018; Published: 16 March 2018

 Abstract: In the era of big data, ubiquitous Flickr geotagged photos have opened a considerable
 opportunity for discovering valuable geographic information. Point of interest (POI) and region of
 interest (ROI) are significant reference data that are widely used in geospatial applications. This study
 aims to develop an efficient method for POI/ROI discovery from Flickr. Attractive footprints
 in photos with a local maximum that is beneficial for distinguishing clusters are first exploited.
 Pattern discovery is combined with a novel algorithm, the spatial overlap (SO) algorithm, and the
 naming and merging method is conducted for attractive footprint clustering. POI and ROI, which are
 derived from the peak value and range of clusters, indicate the most popular location and range
 for appreciating attractions. The discovered ROIs have a particular spatial overlap available which
 means the satisfied region of ROIs can be shared for appreciating attractions. The developed method
 is demonstrated in two study areas in Taiwan: Tainan and Taipei, which are the oldest and densest
 cities, respectively. Results show that the discovered POI/ROIs nearly match the official data in
 Tainan, whereas more commercial POI/ROIs are discovered in Taipei by the algorithm than official
 data. Meanwhile, our method can address the clustering issue in a dense area.

 Keywords: point of interest (POI); region of interest (ROI); Flickr geotagged photo; pattern discovery;
 spatial overlap algorithm

1. Introduction
     With the advanced development of web technologies and the rapid emergence of social networks,
tremendous user-generated content (UGC), such as text, images, videos, and volunteered geographic
information (VGI) [1], are continuously contributed by people via various web platforms. Flickr [2],
a popular social media website, allows users to share photos with locations and tags that describe their
focus. Those shared photos directly show specific phenomena, scenes, or status of reality. Undoubtedly,
the treasure-like geotagged photos have opened a considerable opportunity for discovering valuable
geographic information (GI) and realizing changes in reality with time [3–8].
     Point of interest (POI) and region of interest (ROI) (also called area of interest [AOI] [9])
are “a specific point location that is of interest [10]” and “an area within an urban environment which
attracts people’s attention [9]”, respectively. Both data are significant GI that are often used in the
geographic information system (GIS) field or relevant applications, such as spatial recognition,
orientation identification, navigation, and spatial analysis. Currently, widely used POIs/ROIs can
come from commercial companies, such as Google Places API and Yahoo! GeoPlanet [11], an open
consortium, such as OGC [12], or government open data, such as the New York City government
in the USA (NYC OpenData [13]) and the Tainan City government in Taiwan (Tainan City POI [14]).

ISPRS Int. J. Geo-Inf. 2018, 7, 121; doi:10.3390/ijgi7030121                                www.mdpi.com/journal/ijgi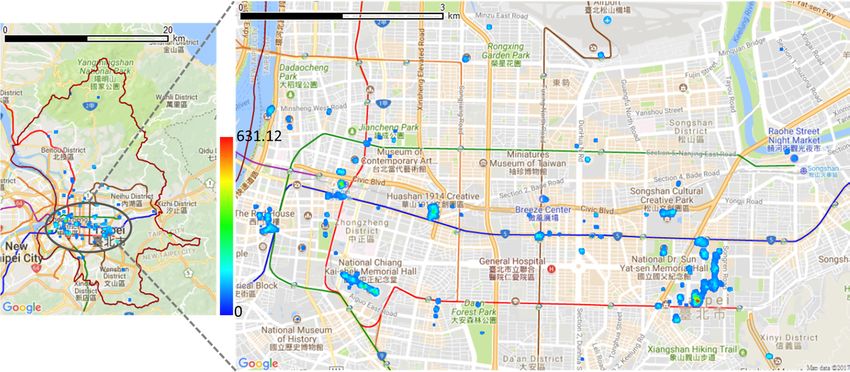
ISPRS Int. J. Geo-Inf. 2018, 7, 121                                                                 2 of 19

However, regardless of the provider, the time-consuming and expensive data collection and update of
POI/ROI is a major obstacle. In the big data era, low-cost and efficient approaches to producing and
updating POIs/ROIs based on data reuse are still expected.
      Previous studies have discussed how to create or discover POI/ROI from certain UGCs, such as
social media, crowdsourced data, and VGI data [9,15–21]. According to the types of resources and
the discovery procedure, the developed approaches can be classified into two types: top–down
and bottom–up. In a top–down approach, the discovered POI and ROI from an existing POI/ROI
repository or database, such as check-in data or yellow pages, are frequently used or fit for a specific
subject or purpose [15–17]. In a bottom–up approach, the POIs/ROIs are discovered from raw data,
such as geotagged photos or digital footprints with implicit GI, such as latitude and longitude with
metadata, to construct a new database or dataset [9,18–21]. In general, bottom–up approaches are more
complicated than top–down ones because discovering POIs/ROIs involves several considerations,
such as data quality assessment, point clustering, and naming. Nevertheless, bottom–up approaches
are still worth exploiting because they have considerable potential in discovering new POIs and ROIs
with time and facilitate trend analysis for prediction. Methods developed for the POI/ROI discovery
of bottom–up approaches have been widely discussed. The main processing steps, such as point
clustering for POI/ROI discovery, usually adopt well-known algorithms or approaches, such as spatial
clustering, that focus on a specific property process of either pure location [22] or location combined
with other properties, such as non-duplicated users [23], tags [20] or temporal property and tags [9].
Indeed, a comprehensive discussion of the spatial and temporal properties and attributes of data is
necessary for a precise POI/ROI result.
      Compared with other UGC resources, such as Twitter [24], Facebook [25], and Instagram [26],
Flickr geotagged photos have the highest accessibility via its developed API [27] and the greatest
advantage for long-term investigation with spatial and noted information(e.g., location, tags).
Furthermore, shared photos from Flickr attract people to take photos from a personal perspective.
Thus, Flickr geotagged photos are adopted in this research. The fundamental challenges of discovering
POIs/ROIs from tremendous/big user-contributed Flickr geotagged photos are removing noises and
biases from active users, retrieving valid photos efficiently for POI/ROI discovery, and identifying
clusters with local maximum, which helps distinguish the POI/ROI in a dense area. Hence, we propose
a workflow that can retrieve attractive footprints (each geotagged photo taken at a specific timestamp
for a certain object or phenomenon is called a footprint.) from geotagged photos and perform clustering
to discover POI/ROI simultaneously. A POI indicates the most popular location for appreciating
an attraction, whereas an ROI presents a better region for appreciating attractions in this research.
We claim that a discovered ROI can be an attractive region for a specific POI. The meaning of
a discovered ROI differs from that of an ROI [28,29] contains many POIs or activities but not be
distinguished for specifics POIs further. Our major contributions are three-fold.

1.     An efficient method of eliminating noises among collected footprints and selecting attractive
       footprints with a local maximum for delineating POIs and ROIs is proposed.
2.     An effective clustering toward pattern discovery that involves spatial and temporal properties
       and attributes, such as tags, with a spatial overlap (SO) algorithm is exploited. The discovered
       ROIs are particularly spatial overlap available that the satisfied region of ROIs can be shared for
       appreciating attractions.
3.     A POI and an ROI with peak value that indicate the most popular location and range for
       appreciating attractions, respectively, are uncovered.

     The remainder of this paper is organized as follows. Section 2 presents related work. Section 3
introduces the proposed method. Section 4 discusses the implementation results and evaluation.
Finally, Section 5 presents the conclusion and directions for future work.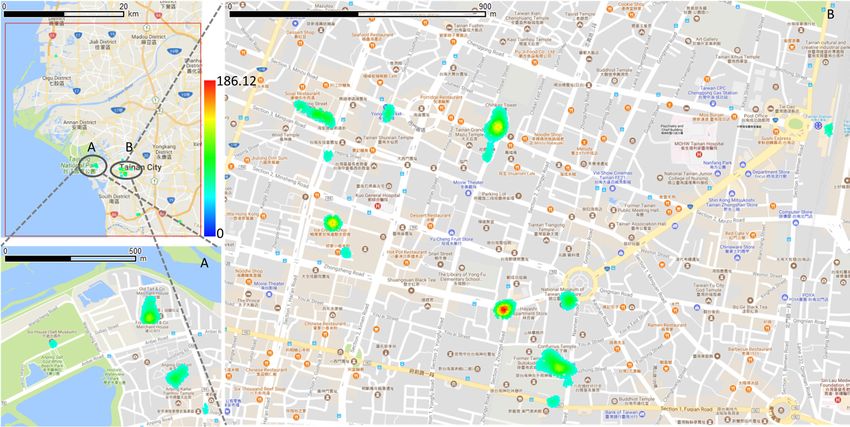
ISPRS Int. J. Geo-Inf. 2018, 7, 121                                                                  3 of 19

2. Related Work
      Most bottom–up POI/ROI discovery approaches consist of three major steps: (1) addressing
popular regions via a point clustering method; (2) constructing polygons for an ROI; and (3) naming
and clarifying semantics for the POI/ROI [9,30]. DBSCAN, a density-based clustering method [22],
is widely used for point clustering and eliminating noises efficiently by setting two parameters: radius
(Eps) and minimum neighbors (MinPts). To accomplish the task, several studies have proposed
improved clustering methods based on DBSCAN, such as P-DBSCAN clusters points that adopt
non-duplicated owners [23]; C-DBSCAN that sets the constraints of background knowledge at
the instance-level [31]; ST-DBSCAN that involves spatial, non-spatial and temporal values [32];
and C-DBSCANO that sets the constraints of geographical knowledge by combining the C-DBSCAN
method and ontology [33]. However, fixed density clustering is a common limitation of DBSCAN-based
approaches. The issue is resolved by calculating the distance of spatial and non-spatial attributes and
the density factor in ST-DBSCAN, and setting the Eps and MinPt by domain experts in C-DBSCANO.
Yang and Gong [34] proposed a self-tuning spectral clustering approach to process the distance, density,
and visit sequence, without subjective parameters, for identifying the POI. However, the ST-DBSCAN
analysis focuses only on consecutive time units. The pattern or relation of objects within a time
unit cannot be indicated between clusters, such as seasonal clusters. Furthermore, the noise cannot
be filtered in the self-tuning spectral clustering approach, and the C-DBSCANO approach is more
suitable for a limited amount of points with complete GI than for big data. On the other hand,
HDBSCAN [35], a density-based hierarchical clustering method is proposed by the improvement
and integration of DBSCAN and OPTICS [36]. Significant clusters with different thresholds in the
constructed hierarchy can be extracted via set of a single parameter value, the minimum size of points
(mpts ), Korakakis et al. [8] applied HDBSCAN for AOI extraction. However, clusters may not be
distinguished easily in a dense area that contains multiple POIs with ROIs. In general, the main
limitation of DBSCAN approaches is adjacent clustering. A high demand for generating overlapped
clusters exists. That is, points should be clustered into multiple groups when they satisfy the set
conditions of clusters.
      Another clustering type is a grid-based approach. Laptev et al. [37] mapped points onto a grid
and set the time constraints for AOI discovery. Shirai et al. [30] used a grid approach to determine
the shape of polygons with high density. Spyrou et al. [19] detected AOIs based on merging tiles
according to the same semantics determined by tags. Encalada et al. [38] identified tourist places
of interest from a regular grid of hexagons aggregating tourists photos. Additionally, a common
spatial clustering method widely used is a fractal-based approach that benefits in an efficient
computation and visualization for big geospatial data analysis [7]. However, evident disadvantages of
a grid-based approach or a fractal-based approach are that varying the initial size of the grid varies
the clustering results and more detailed information like AOIs with boundaries that fit to reality
become undiscoverable.
      A convex hull is used to construct the polygon or range for a given cluster of points and present the
outer polygon upon given points [39]. To fit the boundary and reduce the emptiness of a constructed
polygon, the alpha-shape [40] and concave hull [41] methods are widely adopted. The alpha-shape
method provides a flexible polygon construction approach that allows the generation of a convex hull
when the alpha value is zero. In application, Yahoo’s Flickr applies the alpha shape to address the
approximate boundary of a province, city, or town on the basis of Where On Earth IDs (WOEIDs) [42] of
points. Hu et al. [9] used the chi-shape (also called concave hull) to set a normalized length parameter
λp for constructing polygons.
      The other research on discovering POI/ROI is based on textual content with GI, such as tags,
map annotations, or metadata. Keßler et al. [43] retrieved geotagged photos with specific place names
and performed clustering via Delaunay triangulation. The group-cognitive center (centroid) calculated
by the mean of points in the cluster was the POI. Mummidi and Krumm [44,45] discovered the POI
by grouping nearby pushpins as a cluster and naming the cluster via the term frequency-inverse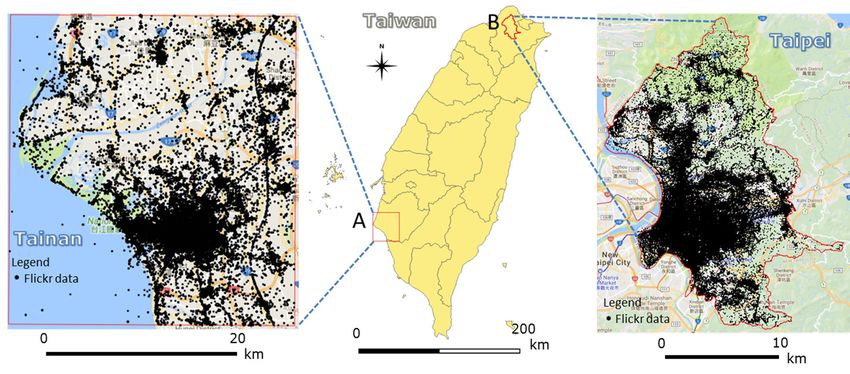
ISPRS Int. J. Geo-Inf. 2018, 7, 121                                                                  4 of 19

document frequency (TF-IDF) method [46]. Rattenbury and Naaman extracted place semantics from
Flickr tags [47] which helps the construction of place gazetteer data, and even POI. Hollenstein and
Purves [48] considered the quality of tags and explored administrative cores with various granularity
settings and specific places derived from reliable tags. Skovsgaard et al. [20] proposed a clustering
method, CLUSTO, to discover POI clusters from tags of collected Microblog Posts. Vu et al. [21]
estimated social POI boundaries called GeoSocialBound based on POI and its tags. Additionally,
Lim et al. [49] proposed a PERSTOUR algorithm that aligned Flickr tags to the Wiki POI database
and identified popular POIs visited by tourists and user interest preferences for a personalized
trip recommendation. According to above discussion, two issues are notable: (1) the quality
of tags in the text-based method for discovering POI or ROI is crucial to the eventual result;
and (2) discovering POI/ROIs from tags or texts based on existing POI databases will lead to hard of
new POI/ROIs discovery.
     For the workflow or framework for uncovering POI/ROI, a coherent framework with three
layers that uses geotagged photos to uncover an ROI (called urban AOI in the study) was proposed
by Hu et al. [9]. They discussed the entire procedure of uncovering ROI, from data pre-processing,
point clustering, to area construction, and applications that were based on the uncovered spatiotemporal
ROI. Their proposed framework is complete. However, temporal filtering is the first priority for data
from the same year. The results are easily affected by the quality of analyzed resources, such as
insufficient time information.
     The aforementioned review shows that the bottom–up approach based on point clustering,
which involves the qualitative properties of geospatial data, has great potential for discovering
valuable POIs/ROIs, particularly in this big data era. The present study proposes an efficient approach
and workflow with a novel algorithm that processes spatial properties, temporal properties, attributes,
semantics, and data quality issues and allows users to adjust the parameters’ flexibly in processing for
discovering user interests, POI and ROI.

3. Method
     A proposed workflow for POI/ROI discovery is illustrated in Figure 1, which shows three
main processing steps: attractive footprints discovery, clustering, and POI/ROI construction. To address
where a POI/ROI may be located, attractive footprints discovery is first conducted to eliminate noises
and select valid footprints with a local maximum, which is helpful for distinguishing the POI/ROI
in a high-density area. This step processing data from a pure spatial perspective can maintain
completeness of footprints for making round ROIs and avoid excluding a large amount of footprints
at the beginning because of footprints without information like time or tags. Second, the clustering
of attractive footprints is performed by processing spatial, temporal properties and attributes with
four substeps for further POI/ROI construction: pattern discovery, clustering with the SO algorithm,
naming, and merging. Pattern discovery is used to rapidly group attractive footprints with the same
properties in terms of spatial and non-spatial properties, such as location and time. Based on the ROI
definition, a discovered ROI can be an attractive region for a specific POI, mentioned in the introduction,
ROIs of various POIs may be spatially overlapped in the real world, which enables the appreciation of
multiple POIs from an intersection area, especially in a dense area. Therefore, next, the SO algorithm
conducting marginal attractive footprints regrouping is utilized for making spatially-overlapped
clusters. Furthermore, the naming step is performed to determine the name of cluster from tags,
while the merging step aims to spatially merge close clusters with the same name. This approach can
successfully make a round ROI shape and delineate the broken polygons around. Finally, the POI
that indicates the most attractive location for a certain attraction is retrieved from the PV within
the individual clusters, whereas the ROI, which presents a better extent for appreciating interests,
is constructed using the alpha-shape algorithm [40] in the POI/ROI construction step. Additional details
are provided in the following subsections.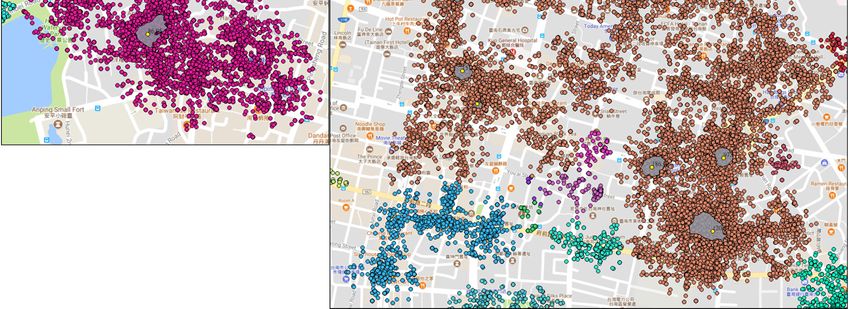
ISPRS Int. J. Geo-Inf. 2018, 7, 121 5 of 19
ISPRS Int. J. Geo-Inf. 2018, 7, x FOR PEER REVIEW 5 of 19
Figure 1. Workflow of POI/ROI discovery.
Figure 1. Workflow of POI/ROI discovery.
3.1. Attractive Footprints Discovery
3.1. Attractive Footprints Discovery
Geotagged photos taken by people are shared on the site. The issue of POI/ROI discovery from
Geotagged photos taken by people are shared on the site. The issue of POI/ROI discovery from
numerous geotagged photos is first dependent on the POI/ROI location. An acceptable assumption
numerous geotagged photos is first dependent on the POI/ROI location. An acceptable assumption
is that a POI/ROI appears where people gather and receive significant attention. Thus, discovering
is that a POI/ROI appears where people gather and receive significant attention. Thus, discovering
attractive footprints that receive significant attention from different people from a Flickr geotagged
attractive footprints that receive significant attention from different people from a Flickr geotagged
photo pool is mainly processed in this step. Attractive footprints not only eliminate the noise
photo pool is mainly processed in this step. Attractive footprints not only eliminate the noise footprint
footprint efficiently, but also initially delineate the range of POI/ROI with a local maximum, which
efficiently, but also initially delineate the range of POI/ROI with a local maximum, which is beneficial
is beneficial for clustering footprints in the next step. To discover attractive footprints, we obtain the
for clustering footprints in the next step. To discover attractive footprints, we obtain the voting value
voting value (υ) using Equation (1) that involves different users within a search radius (r), for
(υ) using Equation (1) that involves different users within a search radius (r), for example, 50 m,
example, 50 m, referring to an average distance between POIs in a study area, to each footprint. In
referring to an average distance between POIs in a study area, to each footprint. In Equation (1),
Equation (1), υ is the summation of the weight function (ω) between the calculated footprint and its
υ is the summation of the weight function (ω) between the calculated footprint and its neighbors from
neighbors from different users within r. The ω based on the Gaussian function that distant
different users within r. The ω based on the Gaussian function that distant neighbors use weights
neighbors use weights smaller than near ones is adopted to make a smooth weight upon distance.
smaller than near ones is adopted to make a smooth weight upon distance. Furthermore, the voting
Furthermore, the voting value bias caused by active users must be avoided, thus, while many
value bias caused by active users must be avoided, thus, while many footprints are contributed by one
footprints are contributed by one user, only the nearest one belonging to that user is calculated:
user, only the nearest one belonging to that user is calculated:
2
j i− j
−
υ = ωij , ωij = e− k2i2σ−σj2k
j 22
(1)
υ pipi= ∑i =1ωij , ωij = e (1)
i =1
where υ is the voting value that summarizes the ω calculated by different people and , j ∈ are
where υ pi is the voting value that summarizes the ω calculated by different people and Pj , j ∈ are the
the neighbour footprints of within r.
neighbour footprints of Pi within r.
The higher the voting value of a footprint, the more people gather around (within r). Attractive
The higher the voting value of a footprint, the more people gather around (within r).
footprints are retrieved by a set threshold (T1) for POI/ROI discovery. We claim that a footprint with
Attractive footprints are retrieved by a set threshold (T1 ) for POI/ROI discovery. We claim that
a υ that is greater than or equal to T1 is an attractive footprint. The noises among footprints are,
a footprint with a υ that is greater than or equal to T1 is an attractive footprint. The noises among
hence, eliminated efficiently by the set T1 as well. Meanwhile, an expected number of people
footprints are, hence, eliminated efficiently by the set T1 as well. Meanwhile, an expected number of
around an attractive point can be easily achieved by the set T1 because at least 100 people are
people around an attractive point can be easily achieved by the set T1 because at least 100 people are
around, whereas υ is set as 100, for example.
around, whereas υ is set as 100, for example.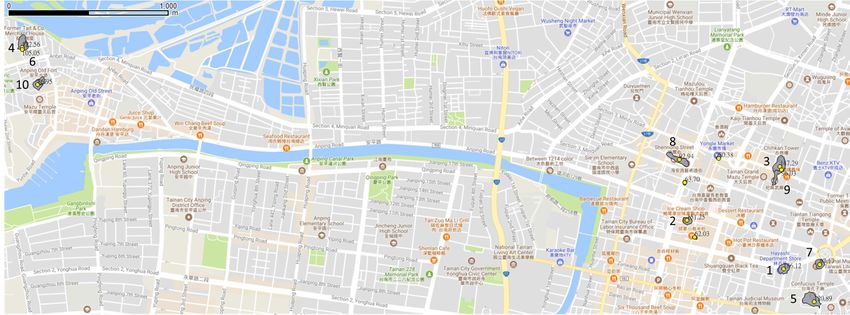
ISPRS Int. J. Geo-Inf. 2018, 7, 121                                                                   6 of 19

3.2. Clustering
     As attractive footprints are uncovered, the main aim of the next step is to make group of attractive
footprints for further POI/ROI construction. This is a clustering question, thus, the main idea of
clustering is forming groups of attractive footprints with the same pattern and content and then
assigning names by processing spatial and temporal properties and attributes. The clustering step
is performed with the following four sub-steps: pattern discovery, clustering with a SO algorithm,
naming, and merging. Additional details are provided in the following sections.

3.2.1. Pattern Discovery
      Pattern discovery helps identify the attractive footprints that belong to the same cluster, that
is, attractive footprints in the same cluster have the same pattern in terms of spatial and temporal
properties and attributes. Isolating the pattern discovery as a substep at the beginning of clustering
step gives a great potential and a possibility for other resources to involve more attributes for a more
wide application.
      For Flickr data, pattern discovery starts from processing temporal properties with basic descriptive
statistics (see Algorithm 1 pattern function) by summarizing the calculated footprint’s number of
neighboring attractive footprints with legitimate temporal properties (other resources may have
attributes e.g., elevation or focus length of devices, etc., these attributes then can be involved for
basic descriptive statistics, for example, an attractive footprints with legitimate temporal properties
and attributes, then it can be processed.) within r (r is set in the attractive footprint discovery step.),
which follows a certain time criterion, such as 12 months. The result of basic descriptive statistics is
that each footprint has 12 values from summation of attractive footprints based on the same month.
      However, the number of attractive footprints shows only the summation of attractive footprints
from different people within r. A data quality issue that is associated with the spatial distribution
of attractive footprints exists and should be checked. Thus, we utilize an area validation approach
(see Algorithm 1 validation function) to select legitimate attractive footprints with a valid spatial
distribution for the pattern discovery process. In area validation, if the number based on a time unit of
calculated attractive footprint (e.g., number calculated to each month with the specific time criteria
is 12 months) is not zero, but the area formed by the attractive footprints is, then it is considered
an illegitimate attractive footprint according to the uncertainty principle that the attractive footprints
contributed by different people should not be exactly the same. This kind of illegitimate phenomena is
supposed to be an internal error caused by the dataset itself.
      Then, attractive footprints are going to be discovered with the same pattern that have similar
curve shape depicted from the number obtained from the above statistics via a difference calculation
(see Algorithm 1 patternDiff function). To make the difference calculation based on the same scale,
that is, to reduce the bias caused by high-density areas, normalization is performed. The normalization
is expressed in Equation (2). Therefore, the value (X) of each attractive footprint is located between
0 and 1 as XN . Then, the Euclidean distance (Pdiff ) between footprints is derived using Equation (3),
which indicates the difference of the normalized number of attractive footprints in a time unit by the
Euclidean distance, such as the summation of the difference of each pair of months from January to
December. Pdiff is normalized to Pdi f f N , which is between 0 and 1.
      Theoretically, a normalized difference value of 0 between two attractive footprints indicates
that they have the same pattern. However, as the number of neighboring attractive footprints for
an attractive footprint is constructed by its neighbors within a radius, distant attractive footprints will
have greater difference values. To cope with the phenomenon in which the normalized difference
value Pdi f f N to a POI could be a Gaussian distribution [50] and determine a proper extent fitting to
its ROI, threshold T2 is set for pattern discovery. Meanwhile, if Pdi f f N that is smaller than or equal to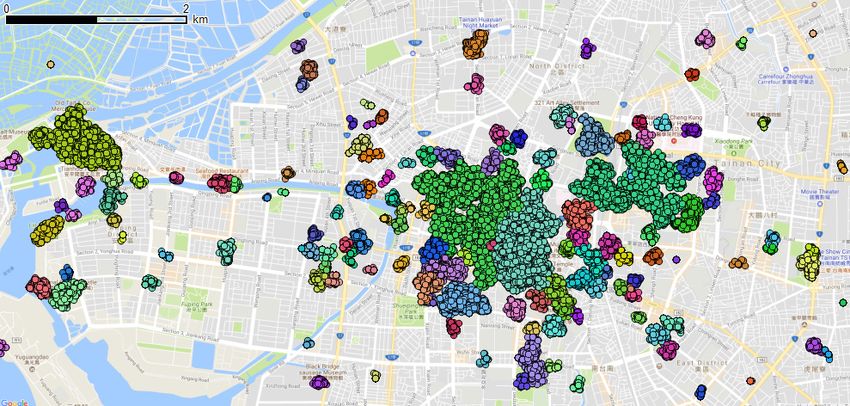
ISPRS Int. J. Geo-Inf. 2018, 7, 121 7 of 19
T2 between attractive
ISPRS Int. footprints,
J. Geo-Inf. 2018, thenREVIEW
7, x FOR PEER these attractive footprints have the same pattern (see Algorithm
7 of 19 1,
findSimlarPatternPoints function).
( X − X min ) , X ∈ 0,1
X N = ( X − Xmin ) [ ]
X N = ( X max − X min ), X NN ∈ [0, 1]
(2)
(2)
( Xmax − Xmin )
where XN is the normalized value of the number of neighboring attractive footprints.
where XN is the normalized value of the number of neighboring attractive footprints.
( )
Pdiff − Pdiff vj
( )
2
Pdiff N P=di f f − Pdi f f minmin , Pdiff = u X Ni − YNi , P2 ∈ [ 0,1]
u j
(3)
( )
diff
Pdi f f N = Pdiff max − Pdiff min , Pdi f f = i =1 ∑ X Ni − YNi , N Pdi f f N ∈ [0, 1]
t (3)
Pdi f f max − Pdi f f min i =1
where Pdiff N
is the normalized difference value between two attractive footprints.
where Pdi f f N is the normalized difference value between two attractive footprints.
Algorithm 1: Pattern discovery.
Algorithm 1: Pattern discovery.
def validation(Available_Points): #area validation
S=[]
for n in Available_Points:
m = month of n
S[m].append(n)
area=0
for s in S
area+=s.area()
return area>0
def pattern(p,r): #pattern calculation
N=Neighbours(p,r)
Available_Points=[]
for n in N: #find nearest unique users
if n.user_id not in Available_Points:
Available_Points[n.user_id]=n;
else:
if distance(p,n)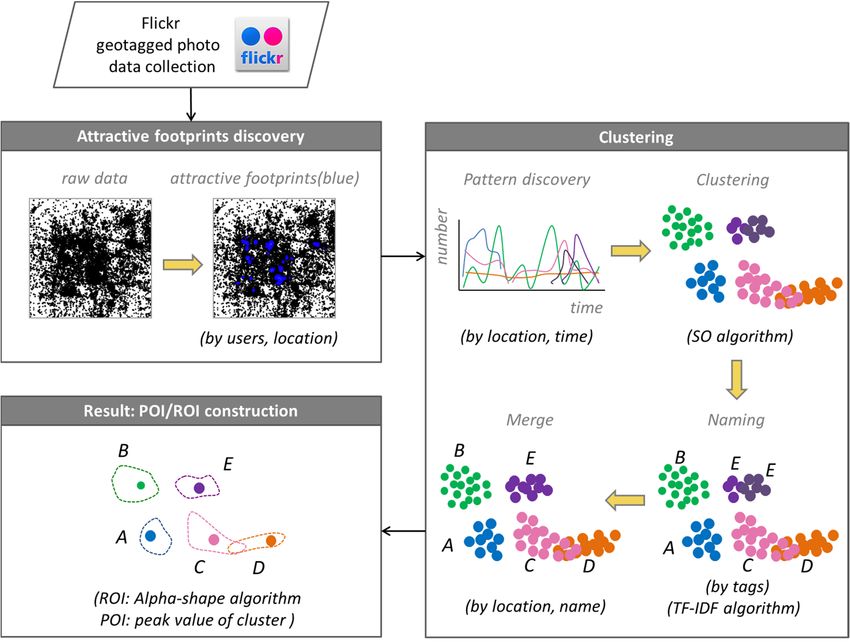
ISPRS Int. J. Geo-Inf. 2018, 7, x FOR PEER REVIEW 8 of 19
novel idea for making spatial overlap clusters is proposed. With the SO algorithm, not only can the
spatial extent for appreciating POIs be clearly depicted, but the moderate location for taking photos
ISPRSorInt.admiring various
J. Geo-Inf. 2018, 7, 121 POIs simultaneously can also be addressed. 8 of 19
Algorithm 2 shows the pseudo code for the clustering with a SO algorithm starting from the
attractive footprint with rank No. 1 according to voting value that assists in processing attractive
for appreciating
footprints that POIs behighly
are clearlyrelated
depicted, to abut the moderate
popular locationattractive
target among for takingfootprints
photos orwithadmiring
the same
various POIs simultaneously can also be addressed.
pattern set by T2. To aid in generating the spatially overlapped clusters mentioned above, threshold
Algorithm
T3 is set to2 provide
shows the pseudosetting
a buffer code for themakes
that clustering
somewith a SO
of the algorithmattractive
processed starting from the be
footprints
attractive footprint with rank No. 1 according to voting value that assists in processing attractive
processed again; that is, attractive footprints with Pdiff N between T2–T3 and T2 are in the buffer area
footprints that are highly related to a popular target among attractive footprints with the same pattern
and will be processed again for clustering. Attractive
set by T2 . To aid in generating the spatially overlapped clusters mentioned footprints Pdiff N threshold
withabove, between T 0 3and T2to
is set –T3 are
provide a buffer
marked andsetting
will not that
bemakes
processedsomeanymore.
of the processed attractive footprints
As the clustering be processed
is from attractive again;with
footprints that rank
is, attractive footprints with
No. 1, significant Pdi f fwith
clusters N a localT2maximum
between –T3 and T2of arevoting
in the value
buffer (called
area and willvalue,
peak be processed
PV) can be
for clustering. Attractive footprints with Pdi f f N between 0 and T2 –T3 are marked and will not be
againgenerated.
processed In anymore.
general,Asthe theclustering
clusteringresultis fromcanattractive footprints
be obtained with rank
by above No. 1, significant
proposed clusters the
method, however,
with result
a localshould
maximum of voting
be further value (called
clustered peak value,
as a possible PV) can
scenario be generated.
in which the major cluster with PV has a
In general, the clustering result can be obtained by above proposed
pattern that is similar with those of distant clusters (spatially discrete) such method, however, theclusters
that all result are
should be further clustered as a possible scenario in which the major cluster with
derived from a processed PV-ranked attractive footprint because similar activities may occur or the PV has a pattern
that is similarpattern
visiting with thosefromofusers
distantareclusters
similar.(spatially discrete)
To deal with such that
this issue, all clusters
we adopt are derived
the search radius from
proposed
a processed PV-ranked attractive footprint because similar activities may occur or
in the attractive footprint discovery, that is, 50 m, to distinguish clusters. Then, the major cluster the visiting pattern
from that
userscontains
are similar. To deal with
the processed this issue,
PV-ranked we adoptfootprint
attractive the searchandradius
otherproposed
distinguishedin theclusters
attractive are the
footprint discovery,
clustering result. that is, 50 m, to distinguish clusters. Then, the major cluster that contains the
processed PV-ranked attractive footprint and other distinguished clusters are the clustering result.
Algorithm 2: Clustering with a SO algorithm.
Algorithm 2: Clustering with a SO algorithm..
def clustering:
sortByPeakValue(afs) #order by peakValue DESC of afs
unmark_all(afs) #unmark all point of afs
clusters=[]
for p in afs
if p.XN!=null and is_unmark(p):
cluster=[] #create new cluster
cluster.append(p)
for q in p.S #PdiffN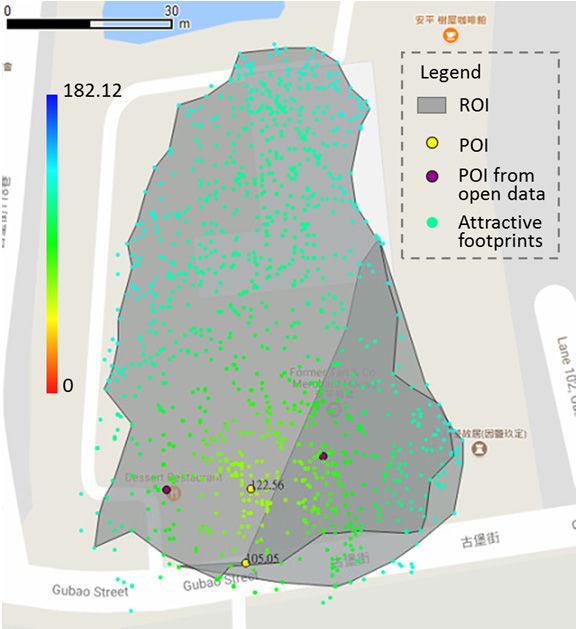
ISPRS Int. J. Geo-Inf. 2018, 7, x FOR PEER REVIEW 9 of 19
ISPRS Int. J. Geo-Inf. 2018, 7, 121 9 of 19
may be generated as well. To make a round ROI shape and delineate the crispy polygons around,
we conduct a processing to merge clusters with the same name and spatially close (e.g., the distance
may be generated as well. To make a round ROI shape and delineate the crispy polygons around,
between the two PVs of a group is less than two times the search radius) or overlap while the major
we conduct a processing to merge clusters with the same name and spatially close (e.g., the distance
cluster and distant clusters have assigned representative names in the previous step. After the
between the two PVs of a group is less than two times the search radius) or overlap while the major
merging process, the clustering of attractive footprints is accomplished.
cluster and distant clusters have assigned representative names in the previous step. After the merging
process, the clustering of attractive footprints is accomplished.
3.3. POI and ROI Determination
3.3. POI
Afterand ROI Determination
clustering, the shape of the users’ interest is delineated as the last step. According to the
definition of POI and
After clustering, the ROI mentioned
shape in the
of the users’ previous
interest section, as
is delineated on the
thelast
onestep.
hand, the POItothat
According the
indicates the most attractive location for a certain attraction is retrieved from
definition of POI and ROI mentioned in the previous section, on the one hand, the POI that indicatesthe PV of each
individual cluster. In
the most attractive other for
location words, the POI
a certain is the is
attraction most popular
retrieved fromlocation
the PVfor appreciating
of each a certain
individual cluster.
attraction. On the other hand, the ROI, which is a better spatial extent for appreciating
In other words, the POI is the most popular location for appreciating a certain attraction. On the attractions, is
constructed
other hand, theby ROI,
the alpha-shape algorithm
which is a better spatial [40],
extentwhich enables theattractions,
for appreciating construction of a regionbyasthe
is constructed a
convex or concave hull by flexible parameter setting. An alpha value set to each cluster
alpha-shape algorithm [40], which enables the construction of a region as a convex or concave hull by adopts a
value,
flexiblehalf maximum
parameter length
setting. of avalue
An alpha minimum bounding
set to each cluster rectangle (MBR)
adopts a value, halfofmaximum
cluster, to avoid
length of
generating crispy polygons.
a minimum bounding rectangle (MBR) of cluster, to avoid generating crispy polygons.
4.
4. Implementation
Implementation
This
This section
section presents
presents the
the study
study areas
areas and
and materials,
materials, shows
shows the
the experiment
experiment results,
results, and
and provides
provides
evaluation and discussion that are based on the proposed approach.
evaluation and discussion that are based on the proposed approach.
4.1. Study
4.1. Study Areas
Areas and
and Materials
Materials
Two study
study areas
areasare
arepresented
presentedas astwo
twored
redareas,
areas,area
areaAA(ca.(ca.991
991 km 2 ) and area B (ca. 272 km 2 ),
Two km 2) and area B (ca. 272 km2), in
in Figure
Figure 2. The
2. The areasareas areTainan
are in in Tainan
CityCity
and and Taipei
Taipei CityCity in Taiwan.
in Taiwan. Tainan Tainan
CityCity is known
is known as
as the
the “ancient
“ancient capital
capital city”city”
and and
has ahas a good
good reputation
reputation forcultural
for its its cultural heritage,
heritage, old construction,
old construction, and
and traditional
traditional food. food.
TaipeiTaipei
City isCity is the capital
the capital of Taiwan
of Taiwan and hasand the has the highest
highest populationpopulation density
density (ca. 651
(ca. 651per
people people
km2), per km2 ), a convenient
a convenient public transportation,
public transportation, cultural
cultural buildings and buildings
activities,and
andactivities,
modern
constructions. Meanwhile, Tainan
and modern constructions. City is the
Meanwhile, oldestCity
Tainan city iswith
the historic attractions.
oldest city Taipei attractions.
with historic City is the
most
Taipeimodern
City is city
the with
mostthe representative
modern city withattractions of Taiwanattractions
the representative (impression of of Taiwan).
Taiwan Tourism of
(impression is
aTaiwan).
major industry
Tourism inis aTaiwan, and Taipei
major industry and Tainan
in Taiwan, are two
and Taipei and of the most
Tainan are twopopular cities popular
of the most among
tourists.
cities among tourists.
(a) (b)
Figure 2. Study areas and materials. (a) Study area A is in Tainan City; (b) Study area B is in Taipei
Figure 2. Study areas and materials. (a) Study area A is in Tainan City; (b) Study area B is in Taipei
City) (the base map is from Google Maps [52]).
City) (the base map is from Google Maps [52]).
The data collection of Flickr geotagged photos is accomplished by a self-developed tool,
FlickrPhotoCrawler [53] through the Flickr API [27]. This application fetches photos with rich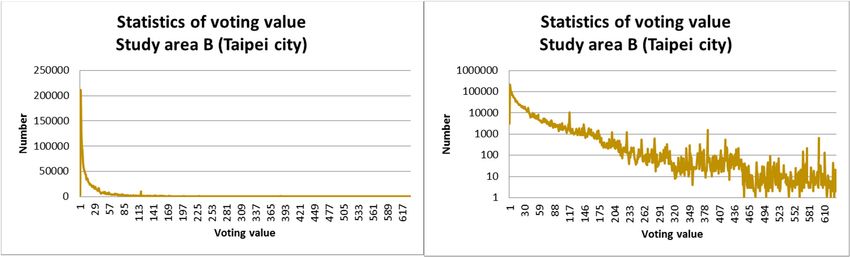
ISPRS Int. J. Geo-Inf. 2018, 7, 121                                                                 10 of 19

     The data collection of Flickr geotagged photos is accomplished by a self-developed tool,
FlickrPhotoCrawler [53] through the Flickr API [27]. This application fetches photos with rich
information, such as photo ID, owner ID, title of photos, and location (longitude and latitude),
and accuracy via the flickr.photos.search method, retrieves EXIF files with rich time information, such as
original datetime, modified datetime, and GPS datetime via the flickr.photos.getExif method, and further
collects tags, such as auto and user tags, for content description via the flickr.tags.getListPhoto method.
Totals of 276,018 and 1,956,980 geotagged photos were collected from areas A and B, accounting for
approximately 3.44% and 24.36% (the number of collected geotagged photos from the entire Taiwan
through 20 October 2017 is 8,032,766.), respectively. Details about the collected data are shown in
Table 1.

                       Table 1. Collected data in study areas A and B (through 20 October 2017).

                               Item                    Study Area A                Study Area B
                  Total number of photos                  276,018                    1,956,980
               Percentage of photos in Taiwan              3.44%                      24.36%
                 Distinct contributed users                6,749                       22,886
                  User tags (total/distinct)          925,761/34,140             2,918,749/97,803
                   Photos with user tags                  144,249                     406,461

4.2. Result
      Two important data pre-processes in terms of spatial property and tags are performed for data
quality enhancement. To remove collected geotagged photos with low position accuracy that may
result in imprecise POI/ROI, we extract Flickr geotagged photos with accuracy 12 to 16 (street level,
according to a given definition from Flickr [54], the range of accuracy is 1 to 16, world level is 1,
country is ~3, region is ~6, city is ~11, street is ~16) for a street-level POI/ROI discovery as our test
data. Thus, 256,149 geotagged photos from 5792 distinct users and 1,895,042 geotagged photos from
20,566 distinct users are extracted in study areas A and B, respectively. Second, the naming of POI/ROI
is mainly determined by the content of user tags rather than auto tags because the auto tags assigned
by the machine are too general to provide the proper name of an attraction, such as outdoors and
building. To eliminate the biases caused by user tags that are not relevant to the POI/ROI, we exclude
user tags with digits, such as temporal related tags (e.g., 20110809102326) and serial numbers generated
by devices; devices or camera parameters, such as nikonafs300mmf4difed; and resource information
(e.g., flickriosapp:filter = newsprint, foursquare: venue = 16779486, and filename extension, such as
jpg, bmp). Meanwhile, to solve the semantic issue, we manually establish a mapping table to create
a synonym and translation of a term, such as “ 赤崁樓 (Chihkan Tower)”, which equals “ 赤嵌樓
(Chihkan Tower)” and “Chihkan Tower” for naming the POI/ROI; that is, naming is performed by
synonym conversion.
      According to the rule of construction and the spatial distribution of POI in Taiwan, the average
distance between POIs is approximately 150 m. Therefore, we set the search radius to 50 m for
the voting value calculation for each footprint. After the voting value calculation, the maximum
voting value in study areas A and B are 186.12 and 631.12, respectively. Figure 3 shows the
voting value statistics in study areas A and B. Approximately 32,705 (accounting for 12.77%) and
536,089 (accounting for 28.29%) footprints with voting values appear above or equal to 30 in study
areas A and B, respectively, because we claim that at least 30 distinct people surround and focus on
the footprints with voting values equal to or greater than 30, and attractive footprints and POI/ROIs
will appear among these identified attractive footprints. As mentioned in Section 3, T1 , T2 , and T3 are
set to discover the POI/ROI. T1 is helpful for clarifying what the attractive or interesting footprints
are, T2 (pattern difference) gathers attractive footprints with the same pattern, and T3 (buffer setting)
allows the attractive footprints on the border of ROIs to be regrouped. By setting T3 , it helps achieve
the goal of generating spatially-overlapped ROIs.
ISPRS Int. J. Geo-Inf. 2018, 7, 121 11 of 19
ISPRS Int. J. Geo-Inf. 2018, 7, x FOR PEER REVIEW 11 of 19
(a)
(b)
Figure 3. Statistics of voting value (left: normal scale; right: log scale). (a) Study area A (in Tainan
Figure 3. Statistics of voting value (left: normal scale; right: log scale). (a) Study area A (in Tainan City);
City); (b) Study area B (in Taipei City).
(b) Study area B (in Taipei City).
Various numbers of POI/ROI can be discovered by setting various T1, T2, and T3. Meanwhile,
the greater
Various the T1,of
numbers the smaller can
POI/ROI the number of POIs/ROIs
be discovered thatvarious
by setting can be Tfound because only a few
1 , T 2 , and T 3 . Meanwhile, the
greater the T1 , the smaller the number of POIs/ROIs that can be found becausesuitable
attractive footprints can be applied in POI/ROI discovery. To determine the most only aTfew 1, T2, and
attractive
T3 for our study areas, we perform a complete test and assess the precision and recall of the top 10
footprints can be applied in POI/ROI discovery. To determine the most suitable T1 , T2 , and T3 for our
discovered POIs/ROIs compared to the selected top 10 POIs/ROIs in study areas A and B. Precision
study areas, we perform a complete test and assess the precision and recall of the top 10 discovered
and recall is commonly used to evaluate discovery accuracy [55]. Precision is the fraction of
POIs/ROIs
discoveredcompared
POIs/ROIsto the
thatselected top 10
are relevant to POIs/ROIs
the retrievedin study areas
POIs/ROIs, A andrecall
whereas B. Precision and recall
is the fraction of is
commonly used to evaluate discovery accuracy [55]. Precision is the fraction
relevant POIs/ROIs that have been retrieved over the total number of relevant POIs/ROIs, in our of discovered POIs/ROIs
that are relevant
case, the totaltonumber
the retrieved POIs/ROIs,
of relevant POIs/ROIswhereas
equals torecall
that ofisselected
the fraction of relevant
POIs/ROIs, 10. POIs/ROIs that
have beenInretrieved
study areaoverA (in the total number
Tainan of relevant
City), according POIs/ROIs,
to statistics from the in Tourism
our case,Bureauthe total number of
of Tainan
CityPOIs/ROIs
relevant Governmentequals[56], the totop
that10ofPOI/ROIs
selectedare Hayashi Department
POIs/ROIs, 10. Store, Chikan Towers, Anping
Treehouse,
In study area Anping
A (inFort, TainanCity),
Tainan Sacrificial Rites Martial
according Temple,from
to statistics Tainan Confucius
the TourismTemple,Bureau ChiMei
of Tainan
Museum, Old Shennong Street, Old Tait & Co. Merchant House,
City Government [56], the top 10 POI/ROIs are Hayashi Department Store, Chikan Towers, and the National Museum of
Taiwan Literature (previously Tainan Prefecture Hall). In our experiments, curve F, T1, T2, and T3 set
Anping Treehouse, Anping Fort, Tainan Sacrificial Rites Martial Temple, Tainan Confucius Temple,
as 50, 0.2, and 0.1, respectively has a much better performance while various T1 (30, 50, 70), T2 (0.1,
ChiMei Museum, Old Shennong Street, Old Tait & Co. Merchant House, and the National Museum of
0.2, 0.3), and T3 (0, 0.1) are tested (Figure 4a). T1 is set as 50, and the top 10 POI/ROI can be
Taiwan Literaturefound
successfully (previously
(refer to Tainan
FigurePrefecture
5 for the Hall). In ourattractive
discovered experiments, curvewith
footprints F, T1voting
, T2 , and T3 set as
values
50, 0.2, and 0.1, respectively
equal to or greater than 50.). has a much better performance while various T 1 (30, 50, 70), T 2 (0.1, 0.2,
0.3), and T (0, 0.1)area
In3 study areBtested
(Taipei(Figure 4a). T1 is to
City), according setstatistics
as 50, andfrom the thetop 10 POI/ROI
Department can be successfully
of Information and
foundTourism,
(refer toTaipei
Figure 5 for
City the discovered
Government [57], theattractive footprints
top 10 POI/ROIs with voting
are National Chiang values equal
Kai-shek to or greater
Memorial
than Hall,
50.). National Sun Yat-sen Memorial Hall, National Palace Museum, Songshan Cultural and
In study Park,
Creative area BHuashan 1914 Cultural
(Taipei City), according andto Creative
statisticsIndustry
from thePark, Taipei Zoo,
Department Taipei 101, and
of Information
Ximending, Longshan Temple, and Xiangshan. T 1 is set as 70 (curves D, E, and F), a better
Tourism, Taipei City Government [57], the top 10 POI/ROIs are National Chiang Kai-shek Memorial
performance occurs through a comprehensive test of T1 (50, 70, 100), T2 (0.1, 0.2, 0.3), and T3 (0, 0.1)
Hall, National Sun Yat-sen Memorial Hall, National Palace Museum, Songshan Cultural and Creative
(Figure 4b). Although curve D (50, 0.2, 0) without buffer setting presents a slightly better result than
Park, Huashan 1914 Cultural and Creative Industry Park, Taipei Zoo, Taipei 101, Ximending, Longshan
curve E with buffer setting (50, 0.2, 0.1), curve E performs better than curve D as a popular POI/ROI
Temple,
(DingandTaiXiangshan.
Fung restaurant) T1 iscansetbeasdiscovered,
70 (curves D,not
but E,inand
the F), a better
selected performance
top 10 (refer to Figureoccurs
6 for through
the
a comprehensive test of T (50, 70, 100), T (0.1, 0.2, 0.3), and T
discovered attractive footprints with voting values equal to or greater than 70).
1 2 3 (0, 0.1) (Figure 4b). Although curve D
(50, 0.2, 0) without buffer setting presents a slightly better result than curve E with buffer setting (50, 0.2,
0.1), curve E performs better than curve D as a popular POI/ROI (Ding Tai Fung restaurant) can beISPRS Int. J. Geo-Inf. 2018, 7, 121 12 of 19
discovered, but not in the selected top 10 (refer to Figure 6 for the discovered attractive footprints with
voting values equal to or greater than 70).
ISPRS Int. J. Geo-Inf. 2018, 7, x FOR PEER REVIEW 12 of 19
ISPRS Int. J. Geo-Inf. 2018, 7, x FOR PEER REVIEW 12 of 19
(a)
(a)
(b)
Figure 4. Precision and recall of study areas for top 10 POIs/ROIs. (a) study area A (in Tainan City);
(b) 10 POIs/ROIs. (a) study area A (in Tainan City);
Figure 4. Precision and recall of study areas for top
(b) study area B (in Taipei City).
(b) study area B 4.(in
Figure Taipei and
Precision City).
recall of study areas for top 10 POIs/ROIs. (a) study area A (in Tainan City);
(b) study area B (in Taipei City).
Figure 5. Footprints with voting values equal to or greater than 50 in Tainan City.
Figure
Figure 5. Footprints
5. Footprints withvoting
with votingvalues
values equal
equalto
toororgreater
greaterthan 50 50
than in Tainan City.City.
in TainanISPRS Int. J. Geo-Inf. 2018, 7, x FOR PEER REVIEW 13 of 19
ISPRS Int. J. Geo-Inf. 2018, 7, 121 13 of 19
ISPRS Int. J. Geo-Inf. 2018, 7, x FOR PEER REVIEW 13 of 19
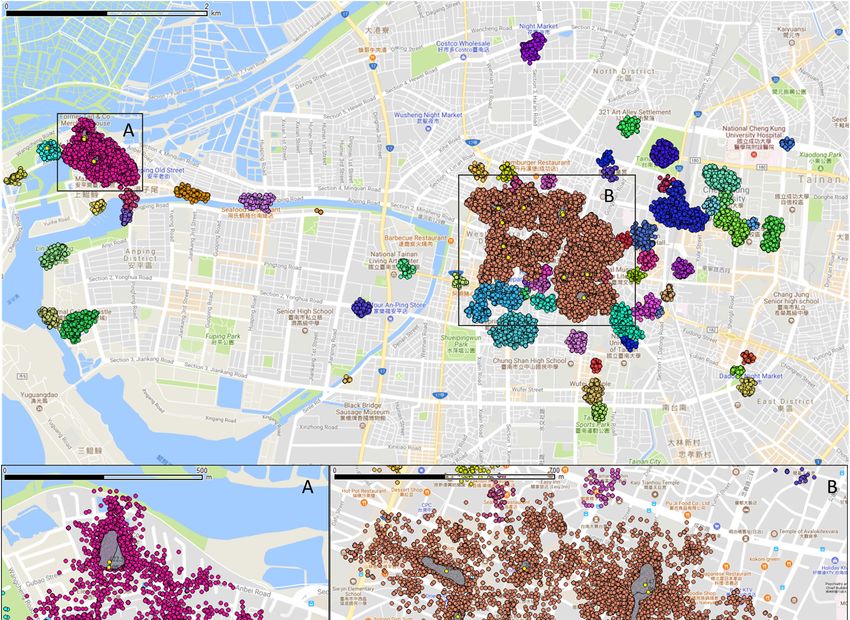
Figure 6. Footprints with voting values equal to or greater than 70 in Taipei City.
Additional details about the discovered top 10 POI/ROI in study area A are depicted in Figure
7 (Only study area A is shown due to space limitation). The ranks of Figure 7a–i are determined by
the voting value. In these figures, the light gray region represents the range of ROI that is the most
suitable area for appreciating what people are interested in, and the bright yellow point is the POI
derived from the PV that is the most popular location for an ROI. The name of each discovered
ROI/POI is Figure
Figure
6. Footprints
determined
6. Footprints
with voting
by awith
TF-IDFvoting
values equal
weighting to or greater
approach
values equal
than 70 in Taipei City.
to or mentioned
greater thanin70Section
in Taipei 3.2.3 and translated
City.
to English. The top 10 discovered POI/ROIs that are sorted according to the voting value in the area
Additional details about the discovered top 10 POI/ROI in study area A are depicted in Figure
are (noted in Figure 7: (1) Hayashi Department Store (in Figure a); (2) Zhengxing Café (in Figure b);
7 (Only study
Additional area A is shown due to space limitation). The ranks of Figure 7a–iareare determined by
(3) Chikandetails
Towerabout the discovered
(in Figure c, the bright top 10 POI/ROI
yellow point with in study
voting area147.29
value: A depicted
and the upper in Figure
light 7
(Onlythe voting
study areavalue.
A isInshown
these figures,
due tothe lightlimitation).
space gray region represents
The ranks theofrange
Figure
gray region); (4) Anping Treehouse (in Figure d, the bright yellow point with voting value: 122.56
of ROI
7a–i that
are is the most by
determined
suitable
the voting area for these
appreciating what people are interested in, and thethebright yellow point is the POImost
and value.
the big In light grayfigures,
region); the light gray
(5) Tainan regionTemple
Confucius represents
(Figure e);range
(6) Old ofTait
ROI &that is the
Co. Merchant
derived from the PV that is the most popular location for an ROI. The name of each discovered
suitableHouse
area for appreciating
(Figure d, the brightwhatyellowpeople are interested
point with voting value: in,105.05
and theand bright
the small yellow point
light gray is the(7)
region); POI
ROI/POI is determined by a TF-IDF weighting approach mentioned in Section 3.2.3 and translated
National Museum of Taiwan Literature (previously Tainan Prefecture
derived from the PV that is the most popular location for an ROI. The name of each discovered Hall) (in Figure f); (8) Old
to English. The top 10 discovered POI/ROIs that are sorted according to the voting value in the area
ROI/POI Shennong Street (in Figure
is determined g); (9) Tainan Sacrificial Rites Martial Temple in(in Figure 3.2.3
c, the bright yellow
are (noted in Figure 7:by (1)aHayashi
TF-IDF weighting
Department approach mentioned
Store (in Figure Section
a); (2) Zhengxing Café (inand Figuretranslated
b);
point
to English. with
The Towervoting
top 10(in value:
discovered96.03 and the
POI/ROIs bottom light
that point gray
are sorted region); and
according (10) Anping Fort(Figure h).
(3) Chikan Figure c, the bright yellow with voting value:to147.29
the voting
and thevalueupperinlightthe area
A significant advantage of our proposed approach in buffer setting is that it allows us to
are (noted in Figure
gray region); (4) 7: (1) Hayashi
Anping Treehouse Department
(in Figure d,Store
the (in Figure
bright yellowa); point
(2) Zhengxing
with votingCafé value: (in122.56
Figure b);
distinguish POIs and identify ROIs with spatial overlap even if the POIs are quite near. Figure 7i
(3) Chikan
and theTower
big light(ingray
Figure c, the(5)bright
region); Tainan yellow point
Confucius with voting
Temple (Figure value: 147.29
e); (6) Old Tait and
& Co. the upper light
Merchant
presents an example. The ROI of Anping Treehouse (big light gray region) overlaps with that of the
House (Figure
gray region); d, the bright
(4)&Anping yellow(in
Treehouse point
Figurewithd,votingbright
value: yellow
105.05 and the with
small voting
light gray region); (7) and
Old Tait Co. Merchant House (small lightthe
gray region). Thesepoint
two POI/ROIs canvalue: 122.56
be successfully
National Museum
the big distinguished
light gray region); of Taiwan Literature (previously Tainan Prefecture Hall) (in Figure f); (8) Old
even if(5)theTainan
distanceConfucius
of POIs isTemple (Figure e); (6)
only approximately 30Old Taitthe
m. Via & proposed
Co. Merchant approach,House
Shennong
(Figure d, the Street yellow
bright (in Figure g); (9)
point Tainan
with votingSacrificial
value: Rites
105.05Martial
and Temple
the small (inlight
Figure
grayc, the bright(7)
region); yellow
National
the attractive regions and the most popular attractive point among range of square, street, building,
point with voting value: 96.03 and the bottom light gray region); and (10) Anping Fort(Figure h).
Museum andof heritage
Taiwan can Literature (previously
be discovered Tainan Furthermore,
successfully. Prefecture Hall) (in Figure POIs
the discovered f); (8)via
Old Shennong
Flickr geotagged Street
A significant advantage of our proposed approach in buffer setting is that it allows us to
photos
(in Figure g); (9)areTainan
close toSacrificial
the location of existing
Rites Martial POIs
Templefrom (inthe open c,
Figure data
theshown
brightasyellow
Figurepoint
7 (dark with purple
voting
distinguish POIs and identify ROIs with spatial overlap even if the POIs are quite near. Figure 7i
dots are
value:presents
96.03 and open data POIs).
the bottom Our approach provides an Anping
efficient Fort(Figure
approach to recommend and indicates
an example. Thelight
ROI of gray region);
Anping and (10)
Treehouse (big light gray h).
region) overlaps with that of the
the representative location for a POI.
Old Tait & Co. Merchant House (small light gray region). These two POI/ROIs can be successfully
distinguished even if the distance of POIs is only approximately 30 m. Via the proposed approach,
the attractive regions and the most popular attractive point among range of square, street, building,
and heritage can be discovered successfully. Furthermore, the discovered POIs via Flickr geotagged
photos are close to the location of existing POIs from the open data shown as Figure 7 (dark purple
dots are open data POIs). Our approach provides an efficient approach to recommend and indicates
the representative location for a POI.
(a) (b) (c)
Figure 7. Cont.
(a) (b) (c)ISPRS Int. J. Geo-Inf. 2018, 7, 121 14 of 19
ISPRS Int. J. Geo-Inf. 2018, 7, x FOR PEER REVIEW 14 of 19
(d) (e) (f)
(g) (h) (i)
(j)
Figure 7. Results of top 10 discovered ROIs/POIs (a–h,j) and an example of spatially overlapped
Figure
ROIs Results
7. (i) (Nameof of top 10 discovered
ROI/POI is determined ROIs/POIs
by TF-IDF(a–h,j) andand
from tags an example of spatially
then translated overlapped
to English.) in
ROIsstudy
(i) (Name of Tainan
area A (in ROI/POI is (a)
City). determined by TF-IDF
Hayashi Department from
Store tags
(rank No.and then
1); (b) translated
Zhengxing Caféto(rank
English.)
in study
No. 2)area Athat
(note (in the
Tainan City). POI/ROI
discovered (a) Hayashi Department
is different from theStore (rank No.
one shown in the1);Google
(b) Zhengxing
maps, the Café
(ranklight
No.grey
2) (note
regionthat
andthe discovered
the yellow point POI/ROI
is the ROIis different
and POI of from the oneCafé);
Zhengxing shown (c)inChikan
the Google
Towermaps,
the light
(rankgrey
No. 3,region and light
the upper the yellow pointand
gray region is the
the ROI
brightand POIpoint
yellow of Zhengxing
with voting Café);
value:(c) Chikan
147.29) andTower
Tainan Sacrificial Rites Martial Temple (rank No. 9, the bottom light gray
(rank No. 3, the upper light gray region and the bright yellow point with voting value: 147.29) andregion and the bright
yellow
Tainan point with
Sacrificial Ritesvoting value:
Martial 96.03);(rank
Temple (d) Anping Treehouse
No. 9, the bottom(rank
lightNo.
gray4, region
the big and
lightthe
gray regionyellow
bright
and the bright yellow point with voting value: 122.56) and Old Tait & Co.
point with voting value: 96.03); (d) Anping Treehouse (rank No. 4, the big light gray region Merchant House (rank No. and
6, the small light gray region and the bright yellow point with voting value: 105.05); (e) Tainan
the bright yellow point with voting value: 122.56) and Old Tait & Co. Merchant House (rank No. 6,
Confucius Temple (rank No. 5); (f) National Museum of Taiwan Literature (previously Tainan
the small light gray region and the bright yellow point with voting value: 105.05); (e) Tainan Confucius
Prefecture Hall) (rank No. 7); (g) Old Shennong Street (rank No. 8); (h) Anping Fort (rank No. 10); (i)
Temple (rank No. 5); (f) National Museum of Taiwan Literature (previously Tainan Prefecture Hall)
Anping Treehouse (big light gray region) and the Old Tait & Co. Merchant House (small light gray
(rankregion);
No. 7); and(g) Old
(j) an Shennong
overview of 10Street (rankROIs/POIs.
discovered No. 8); (h) Anping Fort (rank No. 10); (i) Anping
Treehouse (big light gray region) and the Old Tait & Co. Merchant House (small light gray region);
andDiscussion
4.3. (j) an overview of 10 discovered ROIs/POIs.
and Evaluation
Discovering POI and ROI from user-contributed Flickr geotagged photos is the main goal in
A significant
this advantage
study. The discovery of our proposed
of POI/ROI toward the approach
assessment in buffer and
of spatial setting is that
temporal it allows
properties and us to
distinguish POIs and identify ROIs with spatial overlap even if the POIs are quite near. Figure 7i
presents an example. The ROI of Anping Treehouse (big light gray region) overlaps with that of the
Old Tait & Co. Merchant House (small light gray region). These two POI/ROIs can be successfullyYou can also read


