Eine modellbasierte Evaluierung der energiepolitischen Rahmenbedingungen des Erneuerbare-Energien-Sektors in der EU in Hinblick auf die 2020 ...

Page created by Johnnie Norton
 
CONTINUE READING
Eine modellbasierte Evaluierung der energiepolitischen Rahmenbedingungen des Erneuerbare-Energien-Sektors in der EU in Hinblick auf die 2020 ...
Eine modellbasierte Evaluierung der
              energiepolitischen Rahmenbedingungen des
              Erneuerbare-Energien-Sektors in der EU in
              Hinblick auf die 2020 Zielerreichung

                            Authors: Lukas         Liebmann, Gustav Resch
                            Energy Economics Group, TU Wien
                            Contact:
                            Web: http://eeg.tuwien.ac.at
                            Email: liebmann@eeg.tuwien.ac.at

Eine modellbasierte Evaluierung des Erneuerbaren-Energien-Sekto rs,
Graz, 10.2.2016… Slide 1
Eine modellbasierte Evaluierung der energiepolitischen Rahmenbedingungen des Erneuerbare-Energien-Sektors in der EU in Hinblick auf die 2020 ...
Motivation und zentrale Fragestellung

     •                Wie entsprechen der historische Verlauf und die Szenarienergebnisse des
                      erneuerbaren Elektrizitäts-, Wärme- und Verkehrssektors den selbstgesteckten
                      Zielen der nationalen Aktionspläne der 28 Mitgliedsstaaten?

     •                Welche Ergebnisse liefern modellbasierte Evaluierungen der energiepolitischen
                      Rahmenbedingungen für den Sektor der Erneuerbaren Energien der 28 EU
                      Mitgliedsstaaten in Hinblick auf die 2020 Zielerreichung eins 20% Anteils am
                      Bruttoendenergieverbrauch?

     •                Ein Vergleich von verschiedenen Ausbauszenarien des Green-X Modells soll ein
                      detailliertes Verständnis für den Stand, die Aussichten und Herausforderungen
                      des Erneuerbare-Energien-Sektors innerhalb der EU und deren 28 Mitgliedsstaaten
                      liefern.

   Legal disclaimer: The sole responsibility for the content of this presentation lies with the authors. It does not necessarily reflect the opinion of the
   European Union. Neither the EACI nor the European Commission are responsible for any use that may be made of the information contained therein.
Eine modellbasierte Evaluierung des Erneuerbaren-Energien-Sekto rs,
Graz, 10.2.2016… Slide 2
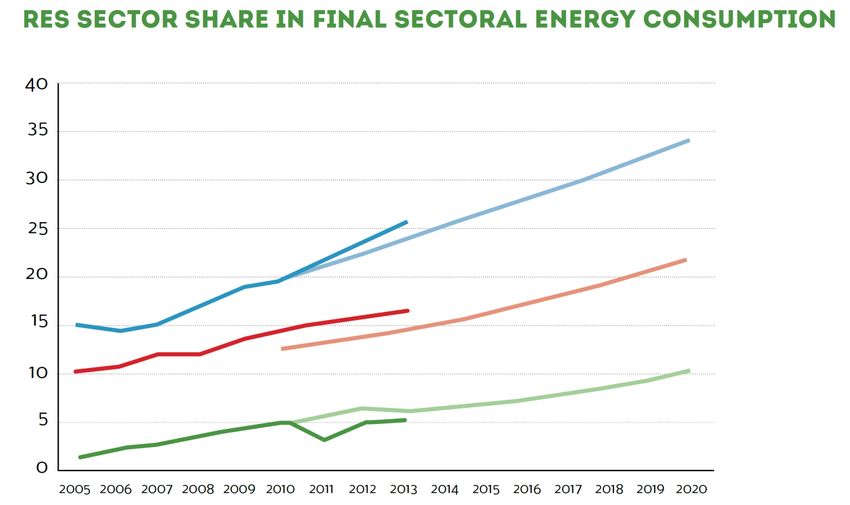
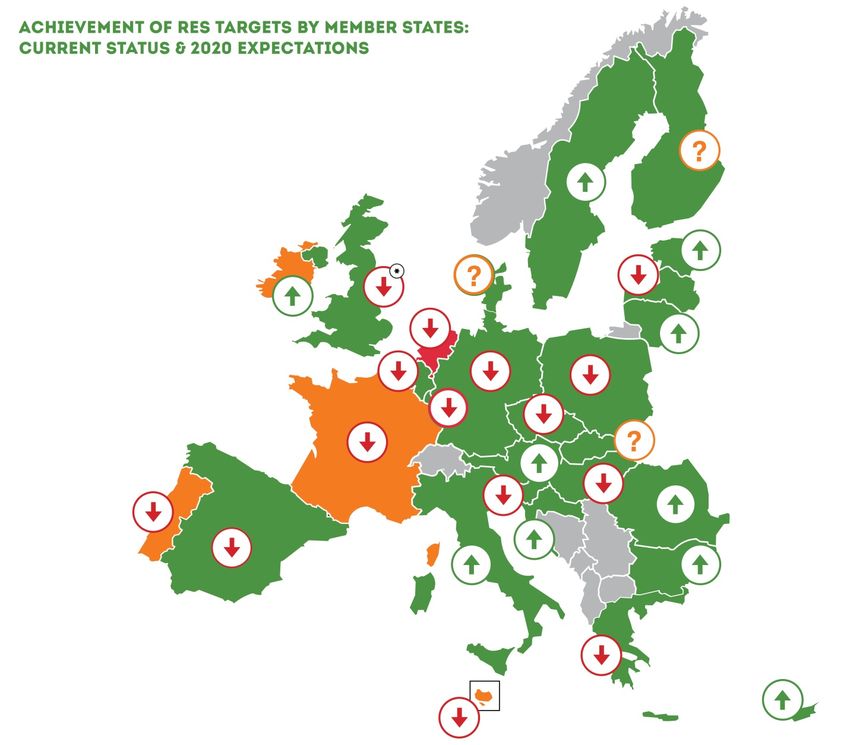
Eine modellbasierte Evaluierung der energiepolitischen Rahmenbedingungen des Erneuerbare-Energien-Sektors in der EU in Hinblick auf die 2020 ...
(1) Status Quo
                               (In 2 0 1 4 )

                                                2014

                                                       2014

                                                       2014

          2014

à 24 MS on track regarding NREAP targets,
and 4 underachieved.
à 27 MS have met the 2013/2014 RES directives
interim trajectory milestone.
Eine modellbasierte Evaluierung des Erneuerbaren-Energien-Sekto rs,   Source: All MS NREAPS, EUROSTAT Shares (2016) and Resch et al. (2015)
Graz, 10.2.2016… Slide 3
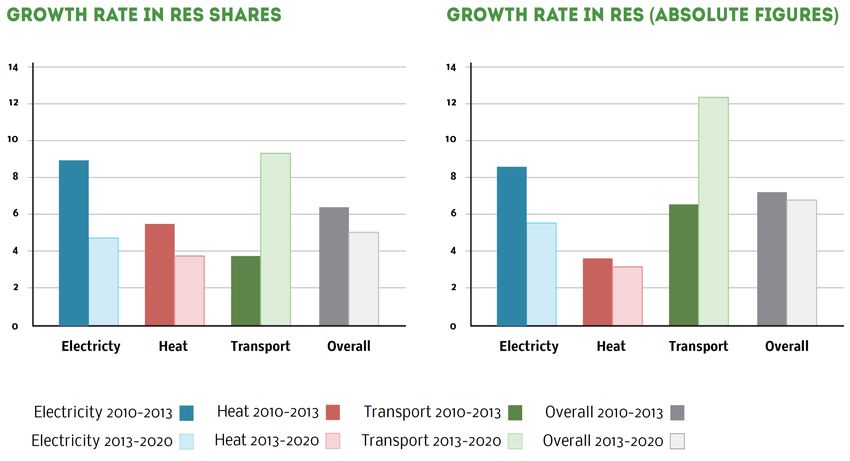
Eine modellbasierte Evaluierung der energiepolitischen Rahmenbedingungen des Erneuerbare-Energien-Sektors in der EU in Hinblick auf die 2020 ...
(1) Status Quo

            25%

            20%

            15%

            10%
                                                                                                                                   actual overall RES share
             5%
                                                                                                                                   NREAP overall RES trajectory
                                                                                                                                   minimum trajectory defined in RES dirctive
             0%

                                                                                                                     2019
                   2005

                          2006

                                 2007

                                        2008

                                               2009

                                                      2010

                                                             2011

                                                                    2012

                                                                           2013

                                                                                  2014

                                                                                         2015

                                                                                                2016

                                                                                                       2017

                                                                                                              2018

                                                                                                                            2020
            40%
            35%
            30%
            25%                                                                                                                      actual RES-E share
            20%                                                                                                                      NREAP RES-E trajectory
            15%                                                                                                                      actual RES-H&C share
            10%                                                                                                                      NREAP RES-H&C trajectory
                                                                                                                                     actual RES-T share
             5%
                                                                                                                                     NREAP RES-T trajectory
             0%
                                        2008

                                                                                                                            2020
                   2005

                          2006

                                 2007

                                               2009

                                                      2010

                                                             2011

                                                                    2012

                                                                           2013

                                                                                  2014

                                                                                         2015

                                                                                                2016

                                                                                                       2017

                                                                                                              2018

                                                                                                                     2019

Eine modellbasierte Evaluierung des Erneuerbaren-Energien-Sekto rs,                                Source: All MS NREAPS and EUROSTAT Shares (2016)
Graz, 10.2.2016… Slide 4
Eine modellbasierte Evaluierung der energiepolitischen Rahmenbedingungen des Erneuerbare-Energien-Sektors in der EU in Hinblick auf die 2020 ...
(1) Status Quo

  14.0%                                                                            14.0%

14.0%
 12.0%                                                                             12.0%

12.0%
 10.0%                                                                             10.0%

10.0%
   8.0%                                                                             8.0%

 8.0%
   6.0%                                                                             6.0%

 6.0%
   4.0%                                                                             4.0%

 4.0%
   2.0%                                                                             2.0%

 2.0%
   0.0%                                                                             0.0%
             Electricity         Heat        Transport            Overall                      Electricity     Heat       Transport       Overall
 0.0%

        Electricity 2010-2014                   Electricity 2014-2020                   Heating & Cooling 2010-2014   Heating & Cooling 2014-2020
        Transport 2010-2014                     Transport 2014-2020                     Overall 2010-2014             Overall 2014-2020

                   Electricity           Heating & Cooling                  Transport                Overall
    Growth rates of RES 2010-2013 [%/a] versus average annual growth rates [%/a] required from 2014 to
    2020 to achieve the 2020 target.
    Source: All MS NREAPS and EUROSTAT Shares (2016)

Eine modellbasierte Evaluierung des Erneuerbaren-Energien-Sekto rs,
Graz, 10.2.2016… Slide 5
(2) Ergebnisse einer modellbasierten Evaluierung

►   Key assumptions
   … by use of a specialised energy system model (Green-X) a quantitative assessment was
   conducted to assess feasible RES developments up to 2020 according to the defined policy
   pathways, indicating feasible RES deployment at country level that can be expected in the
   near future as well as related impacts on costs and benefits in a brief manner.

   Main input sources for scenario parameters

     Based on PRIMES                                     Based on Green-X database             Defined for this assessment
     Primary energy prices                               RES cost (investment, fuel, O&M)      RES policy framework
     Conventional supply portfolio
                                                         RES potential                         Reference electricity prices
     and conversion efficiencies
                                                                                               Modified data on energy demand
     CO2 intensity of sectors                            Biomass trade specification           by sector, impacted by energy
                                                                                               efficiency*
     Default data on energy demand                       Technology diffusion / Non-economic
     by sector                                           barriers
                                                         Learning rates

      *Primes scenario used: Reference
      case (as of 2013)
Eine modellbasierte Evaluierung des Erneuerbaren-Energien-Sekto rs,
Graz, 10.2.2016… Slide 6
(2) Ergebnisse einer modellbasierten Evaluierung

                                                                      This MS is expected to achieve
                                                                      its 2020 target
Results:

                                                                                                           “Business as usual” (BAU) scenario
                                                                      There are doubts whether this
Business-as-usual scenario                                            MS may achieve its 2020 target
… 2020 RES target                                                     This MS is not well on track to
                                                                      achieve its 2020 target
achievement

     ► 9 MSs appear being well
       on track
     ► In another 4 MSs there
       are doubts whether
       2020 targets are
       reached
     ► 14 MSs can be classified
       as “not well on track”!

Eine modellbasierte Evaluierung des Erneuerbaren-Energien-Sekto rs,      Source: Green-X –
Graz, 10.2.2016… Slide 7                                                 Keep on Track! scenarios (2014)
(2) Ergebnisse einer modellbasierten Evaluierung

                                                                      This MS is expected to achieve
                                                                      its 2020 target
Results:

                                                                                                           “Business as usual” (BAU) scenario
                                                                      There are doubts whether this
Business-as-usual scenario                                            MS may achieve its 2020 target
… 2020 RES target                                                     This MS is not well on track to
                                                                      achieve its 2020 target
achievement

     ► 10 MSs appear being
       well on track
     ► In another 3 MSs there
       are doubts whether
       2020 targets are
       reached
     ► 15 MSs can be classified
       as “not well on track”!

Eine modellbasierte Evaluierung des Erneuerbaren-Energien-Sekto rs,      Source: Green-X –
Graz, 10.2.2016… Slide 8                                                 Keep on Track! scenarios (2015)
(2) Ergebnisse einer modellbasierten Evaluierung

Results:                                                    This MS is expected to exceed its

                                                                                                               (PR) scenario
                                                            2020 target domestically and acts as
Policy recommendations                                      a (possible) seller within in the RES
                                                            cooperation mechanism in 2020
scenario (incl. complementary
                                                            This MS is expected to achieve its
activities to improve energy
                                                            2020 target through a combination
efficiency)                                                 of domestic action and RES

                                                                                                          “Policy recommendations”
… 2020 RES target                                           cooperation, acting as a buyer for
                                                            meeting the remaining gap
achievement

     ► All MSs achieve their
       2020 RES targets
     ► The majority of MSs
       even exceeds its
       obligations – there are
       good reasons doing so!
          (Supply security, local
          employment, …)

     ► 3 MSs make use of
       cooperation
       mechanisms as a
       buyer while all other act as
          (possible) seller

Eine modellbasierte Evaluierung des Erneuerbaren-Energien-Sekto rs,     Source: Green-X –
Graz, 10.2.2016… Slide 9                                                Keep on Track! scenarios (2015)
(3) Ein Vergleich von unterschiedlichen Ausbauszenarien

  Results: RES-H share development and absolute RES deployment at EU level
                                                      25%                                                Historic and expected future
                                                                                                     23,7% RES-H
                                                                                                     23.3%     RES developments
                                                                                                                      developments &
                                             energy
                                       finaldemand

                                                                                                     20%                                             2020 RES target
                                                      20%                                            19,5%                 BAU
                                                                  16,5%                              18.4%
                                                                                                                                                          fulfillment
                                                                                                                           PR
                                   energy
                                     [%]

                                                                                                                            BAU
                                                                                                                           Historic deployment
                              in gross

                                                      15%                                                                   PR
                           demand

                                                                          16.0%
                       sharefinal

                                                                                                                            Datenreihen3
                             [%]

                                                                                                                            2020 RES target
                    in gross

                                                      10%
                                                                                                                                                                                     Breakdown of
                RES-H

                                                                                                                                                       Biofuels for transport
                                                                                                                                                                                    RES generation
          RES share

                                                      5%                                                                                               RES-heating & cooling
                                                                                                                                                       RES-electricity                    by sector
                                                                                                                                                     3,500

                                                                                                                Energy production from RES [TWh/a]
                                                      0%
                                                        2010   2012   2014        2016   2018    2020                                                3,000
                                                                                                                                                                                           291.0
                                                                                                                                                     2,500                      238.6
            RES share in gross final energy demand                                                                                                   2,000      152.6                     1362.5
            at EU level                                                                                                                              1,500      1017.4
                                                                                                                                                                                1226.6

            according to the BAU and PR case                                                                                                         1,000
                                                                                                                                                                                          1262.5
                                                                                                                                                       500      871.5           1036.9

                                                                                                                                                         0
                                                                                                                                                                2014      2020 (BAU) 2020 (PR)

Eine modellbasierte Evaluierung des Erneuerbaren-Energien-Sekto rs,                             Source: Green-X –
Graz, 10.2.2016… Slide 10                                                                       Keep on Track! scenarios (2015)
(3) Ein Vergleich von unterschiedlichen Ausbauszenarien

  Results: Comparison of sector-specific RES deployment by 2020 at EU level

                                                                                                                           2020 (BAU)                         2020 (PR)
          Breakdwon (of generation) Breakdwon (of generation)

                                                                Biogas                              2013
                                                                Biomass*
          by RES-H&C technology by RES-E technology

                                                                                                                        3% 6%                                 5%
                                                                Geothermal                  2% 6%
                                                                Large hydro                                                                              8%
                                                                Small hydro                                                   13%                              12%
                                                                                               12%
                                                                PV                    25%                        30%
                                                                                                                                                  29%
                                                                CSP
                                                                                                                                                                   25%
                                                                Tidal & wave         10%                                      31%
                                                                                               37%                   11%
                                                                Wind onshore                                                                            15%
                                                                Wind offshore   6%                              5%                                                   4%

                                                                                                    2013                   2020 (BAU)                         2020 (PR)
                                                                                        8%                                   3%                               3%
                                                                                 2%                 3%      3%                               4%
                                                                                1%                                     11%                              12%
                                                                Biogas                                     1%                           1%
                                                                Biomass*
                                                                Geothermal
                                                                Solar thermal
                                                                                              86%                            82%                               80%
                                                                Heat pumps

             Breakdown (of generation) by RES-E and RES-H&C technology for EU-28
             according to the BAU and PR case

Eine modellbasierte Evaluierung des Erneuerbaren-Energien-Sekto rs,                                             Source: Green-X –
Graz, 10.2.2016… Slide 11                                                                                       Keep on Track! scenarios (2015)
(3) Ein Vergleich von unterschiedlichen Ausbauszenarien

  Results: Investments, costs & benefits of RES deployment at EU level
                                                                                                           Avoided expenses for CO2 emission allowances
                                                                                                           Avoided expenses for fossil fuel (imports)
                                                                                                           Support expenditures

                                            RES (installed 2011 to 2020) at EU level [billion €]
                                                                                                           Capital expenditures

                                            Indicators on yearly average (2011 to 2020) costs
                                              and benefits of as well as investments in new
                                                                                                   90
                                                                                                   80
                                                                                                   70
                                                                                                   60
                                                                                                   50
                                                                                                   40                                 80.8
                                                                                                                                                        4.9
                                                                                                   30    56.8
                                                                                                                             1.9

                                                                                                   20
                                                                                                                   28.7     30.1                       30.7
                                                                                                                                              26.2
                                                                                                   10
                                                                                                   0
                                                                                                        Business as usaul (BAU)    Policy recommendations (PR)

                                          Investments, selected costs & benefits
                                          according to the BAU case (left) and the
                                          “Policy recommendations” (PR) case

Eine modellbasierte Evaluierung des Erneuerbaren-Energien-Sekto rs,                                               Source: Green-X –
Graz, 10.2.2016… Slide 12                                                                                         Keep on Track! scenarios (2013)
(3) Ein Vergleich von unterschiedlichen Ausbauszenarien

  Results: RES-H share development and absolute RES deployment in Austria
                                                      25%
                                                      45%                                                Historic and expected future
                                                                                                     41.3%
                                                                                                     23,7% RES-H
                                                                                                     23.3%     RES developments
                                                                                                                       developments   &
                                             energy
                                       finaldemand

                                                      40%
                                                                                                     36.9%
                                                                                                     20%             2020 RES target
                                                      20%
                                                      35%                                            19,5%         BAU
                                                                  16,5%                              34%
                                                                                                     18.4%
                                                                                                                            fulfillment
                                                                           33.1%                                   PR
                                   energy
                                     [%]

                                                      30%                                                           BAU
                                                                                                                   Historic deployment
                              in gross

                                                      15%                                                           BAU
                                                                                                                    PR
                           demand

                                                      25%                 16.0%
                       sharefinal

                                                                                                                    PR
                                                                                                                    Datenreihen3
                             [%]

                                                      20%                                                           Datenreihen3
                                                                                                                    2020 RES target
                    in gross

                                                      10%
                                                                                                                    2020 RES target
                                                      15%                                                                                                                        Breakdown of
                RES-H

                                                                                                                        Biofuels for transport
          RES share

                                                      10%                                                               RES-heating & cooling                                   RES generation
                                                       5%
                                                                                                                        RES-electricity                                               by sector
                                                      5%
                                                                                                                      3,500
                                                                                                                      140

                                                                                                                 Energy production from RES [TWh/a]
                                                      0%
                                                                                                                                                      3,000
                                                                                                                                                      120                 6.9           7.9
                                                        2010   2012   2014        2016   2018    2020                                                                                  291.0
                                                                                                                                                      2,500
                                                                                                                                                      100     6.2
                                                                                                                                                                          238.6
                                                                                                                                                                          59.4         61.4
            RES share in gross final energy demand                                                                                                     80
                                                                                                                                                      2,000    152.6
                                                                                                                                                              49.7                    1362.5
            at EU level                                                                                                                                60
                                                                                                                                                      1,500   1017.4
                                                                                                                                                                          1226.6

            according to the BAU and PR case                                                                                                           40
                                                                                                                                                      1,000
                                                                                                                                                              49.6        56.8         57.6
                                                                                                                                                                                      1262.5
                                                                                                                                                       20
                                                                                                                                                       500     871.5      1036.9

                                                                                                                                                        00
                                                                                                                                                              2014
                                                                                                                                                               2014    2020
                                                                                                                                                                        2020(BAU)
                                                                                                                                                                             (BAU) 2020
                                                                                                                                                                                   2020 (PR)
                                                                                                                                                                                        (PR)

Eine modellbasierte Evaluierung des Erneuerbaren-Energien-Sekto rs,                             Source: Green-X –
Graz, 10.2.2016… Slide 13                                                                       Keep on Track! scenarios (2015)
(3) Ein Vergleich von unterschiedlichen Ausbauszenarien

  Results: Comparison of sector-specific RES deployment by 2020 in Austria

                                                                                                                       2020 (BAU)                  2020 (PR)
           Breakdwon (of generation) Breakdwon (of generation)

                                                                 Biogas                         2013
                                                                 Biomass*         6%
           by RES-H&C technology by RES-E technology

                                                                                                                           2%                      2%
                                                                 Geothermal       1%     1%
                                                                                                                                     4%
                                                                                                            4%
                                                                 Large hydro                                          9%                      9%
                                                                                                                            11%                     13%
                                                                 Small hydro              8%
                                                                 PV                13%                          12%                   11%
                                                                 CSP
                                                                 Tidal & wave
                                                                 Wind onshore                 71%                           62%                     61%
                                                                 Wind offshore

                                                                                                    2013               2020 (BAU)                  2020 (PR)
                                                                                                                      3%                  3% 5% 2%
                                                                                   4%    3%     1%              4% 6%
                                                                                 1%                                                  1%
                                                                                                           1%
                                                                 Biogas
                                                                 Biomass*
                                                                 Geothermal
                                                                 Solar thermal
                                                                 Heat pumps               91%                               86%                     89%

            Breakdown (of generation) by RES-E and RES-H&C technology for EU-28
            according to the BAU and PR case

Eine modellbasierte Evaluierung des Erneuerbaren-Energien-Sekto rs,                                         Source: Green-X –
Graz, 10.2.2016… Slide 14                                                                                   Keep on Track! scenarios (2015)
(3)   Recommendations
   In the Communication of the Energy Union Package, the EU dedicated itself to becoming the
   world’s “number one in renewables”. This is a much welcomed commitment, especially at a time
   with global warming on the rise and the lingering question of security of energy supply, enhanced by the
   continuing geopolitical tensions between Russia and the EU.

   In order to truly achieve the goal of making the EU the number one in renewables, the EU must:

   ► Ensure the achievement of its 20% renewables target by 2020.
   ► Strive for an ambitious and binding 2030 renewable energy target which is
     significantly higher than 27%, alongside energy efficiency and greenhouse gas
     emissions targets. Adopt a strong governance framework to facilitate and
     ensure the achievement of these targets.
   ► Ensure a predictable and stable legislative framework for renewables at the
     national level and in particular to avoid any retroactive changes to existing
     support schemes.
   ► Establish an energy market design based on increasing shares of renewable
     energies. Remove all subsidies for fossil fuels and nuclear.

Eine modellbasierte Evaluierung des Erneuerbaren-Energien-Sekto rs,
Graz, 10.2.2016… Slide 15
Danke für Ihre Aufmersamkeit!
   Literatur
   [1]        Richtlinie 2009/28/EG Des europäischen Parlaments und des Rates vom 23. April 2009 zur Förderung der
   Nutzung von Energie aus erneuerbaren Quellen und zur Änderung und anschließenden Aufhebung der Richtlinien
   2001/77/EG und 2003/30/EG.
   [2]           Hamelinck, C., de Lovinfosse, I., Koper, M., Beestermoeller, C., Nabe, C., Kimmel, M., van den Bos, A., Yildiz,
   I., Harteveld, M., Ragwitz, M., Steinhilber, S., Nysten, J., Fouquet, D., Resch, G., Liebmann, L., Ortner, A., Panzer, C.,
   Walden, D., Diaz Chavez, R., Byers, B., Petrova, S., Kunen, E., Fischer, G. (2012) Renewable energy progress and biofuels
   sustainability, Ecofys: Utrecht, Niederlande
   [3]          Hamelinck, C., Koper, M., Janeiro, L., Klessmann, C., Kuwahata, R., Nabe, C., Doering, M., Cuijpers, M., van
   den Bos, A., Spoettle, M., Alberici, S., Ragwitz, M., Steinhilber, S., Nysten, J., Fouquet, D., Resch, G., Liebmann, L.,
   Ortner, A., Panzer, C., Johnson, F., Olsen, O., Godar, J., Karlberg, L., Fischer, G. (2014) Renewable energy progress and
   biofuels sustainability, Ecofys: Utrecht, Niederlande, Verfügbar unter
   https://ec.europa.eu/energy/sites/ener/files/documents/Final%20report%20-November%202014.pdf.
   [4]          Resch, G., Liebmann, L., Ortner, A., Busch, S. (2014) 2020 RES scenarios for Europe - are Member States
   well on track for achieving 2020 RES targets?, Ein Bericht erstellt im Rahmen des Intelligent Energy Europe Projekts
   Keep-on-Track!, koordiniert von Eufores und Eclareon, Technische Universität Wien - Energy Economics Group (EEG):
   Wien, Österreich, Verfügbar unter www.keepontrack.eu.
   [5]          Resch, G., Liebmann, L., Welisch, M. (2015) 2020 RES scenarios for Europe - are Member States well on
   track for achieving 2020 RES targets?, Ein Bericht erstellt im Rahmen des Intelligent Energy Europe Projekts Keep-on-
   Track!, koordiniert von Eufores und Eclareon, Technische Universität Wien - Energy Economics Group (EEG): Wien,
   Österreich, Verfügbar unter www.keepontrack.eu.
Lukas Liebman
                                                                                              Contact
e-mail: liebmann@eeg.tuwien.ac.at phone: +43-1-58801-370 355
 Eine modellbasierte Evaluierung des Erneuerbaren-Energien-Sekto rs,
Energy   Economics
 Graz, 10.2.2016…   SlideGroup
                          16    (EEG), Vienna University of            Technology, http://eeg.tuwien.ac.at
(2) Outlook towards 2020

                                                                      … from “business as usual” (BAU) to improved RES policies
►   Green-X modelling                                                             in accordance with a detailed qualitative assessment
of expected future (2020)                                                                    (“Policy recommendations”       scenario)

RES progress
                                                                             Policy recommendations
                                                                                     scenario:
                                          BAU case:                         ◄ Meeting/Exceeding 20% RES by 2020
                                      RES policies are                                as precondition
                                    applied as currently                      ◄ Continuation BUT fine-tuning
                                       implemented                           (increasing cost-efficiency & effectiveness)
                                          (without any                  of national RES policies: improving the design of
                                        adaptation) until               RES policies but no change of the in prior chosen
                                              2020,                                RES policy instrument type
                                       i.e. a business as                      ◄ Mitigation of non-cost barriers
                                          usual (BAU)                      ◄ RES cooperation comes into play in the
                                            forecast.                      exceptional case that pure national target
                                                                                 fulfilment appears not feasible
                                                                         ◄ Increase in energy efficiency in accordance
                                                                               with 2020 energy efficiency targets
www.green-x.at
Eine modellbasierte Evaluierung des Erneuerbaren-Energien-Sekto rs,
Graz, 10.2.2016… Slide 17
You can also read