ELECTRIC BIKES (E-BIKES) IN THE UNITED STATES - FRIDAY PSU TRANSPORTATION SEMINAR OCTOBER 18, 2013
←
→
Page content transcription
If your browser does not render page correctly, please read the page content below
ELECTRIC BIKES (E-BIKES)
IN THE UNITED STATES

FRIDAY PSU TRANSPORTATION SEMINAR
OCTOBER 18, 2013

John MacArthur
OTREC at Portland State University
Presentation Outline Why do e-bikes matter? What is an e-bike? US e-bike user survey Conclusions
WHY DO E-BIKES MATTER?
US Transport Sector Impacts
Safety
32,788 fatalities in 2010 (-3% from 2009)
1.09 fatalities per 100 MVMT (VMT +0.7% in 2010)
2.2 M injuries in 2009
5.3 M crashes in 2011
$230 B total cost (including medical)
Leading cause of death for ages 4 to 34
Accessibility, Reliability and Mobility
4.8B hours travel delay (34 hours/auto commuter)
$121 billion cost of urban congestion
Household Expenses
Second biggest monthly expense, after housing
Environmental
28% of GHG emissions (78% CO, 58% NOx, 36% VOCs)
29% of energy consumed (mostly petroleum)
70% of petroleum consumption (60% imported)
Source: Prof. Robert Bertini 3.9 billion gallons of wasted fuel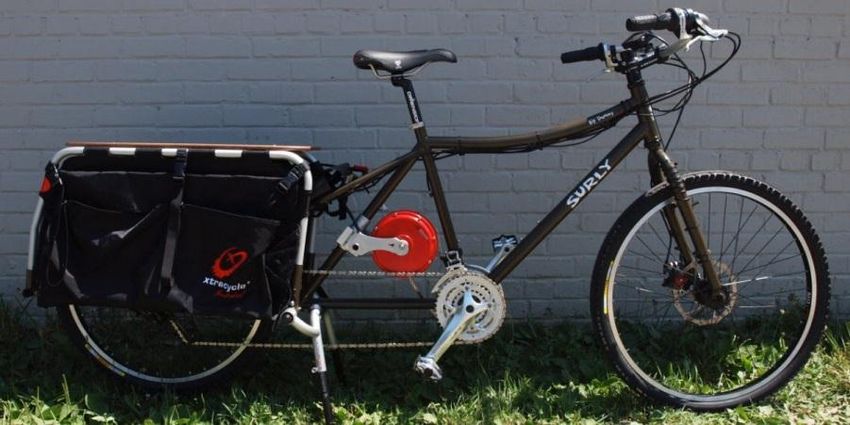
Commute Mode Share for Portland
Reduce per capita daily vehicle-miles traveled (VMT) by 30 % from 2008 levels.

              2009                                    2030

                                                                       Bike
                          Bike                                         Walk
                          Walk                                         Telecommute
                          Carpool                                      Carpool
                          Transit                                      Transit
                          Drive Alone                                  Drive Alone

                                                        Portland Climate Action Plan, 2009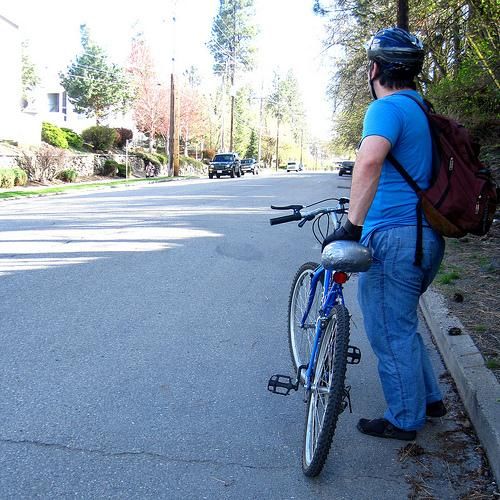
0%
                                                                                1%
                                                                                     2%
                                                                                          3%
                                                                                               4%
                                                                                                    5%
                                                                                                              7%

                                                                                                         6%
                                                                  Portland
                                                             Minneapolis
                                                             Washington
                                                                    Seattle
                                                            San Francisco
                                                                    Denver
                                                                     Tucson
                                                                 Oakland
                                                              Sacramento
                                                            New Orleans
                                                             Philadelphia
                                                                                                                   Commuting

                                                                  Honolulu
                                                                     Boston
                                                                   Buffalo
                                                                  Chicago
                                                                      Austin
                                                                    Tampa
                                                                Pittsburgh
                                                                  St. Louis
                                                               San Diego
                                                                Baltimore
                                                                   Raleigh
                                                                     Miami
                                                              Los Angeles
                                                           New York City
                                                                 San Jose
                                                                Columbus
                                                                   Phoenix
                                                                   Atlanta
                                                               Cleveland
                                                                 Anaheim
                                                                    Detroit
                                                                  Stockton
                                                              Jacksonville
                                                                Cincinnati
                                                             Indianapolis
Source: US Census Bureau, 2012 American Community Survey

                                                              Kansas City
                                                                   Houston
                                                                    Toledo
                                                               Las Vegas
                                                                 Charlotte
                                                                                                                   Large US Cities Ranked by % Bicycle

                                                                 Memphis
                                                                     Dallas
                                                             San Antonio
                                                                    El Paso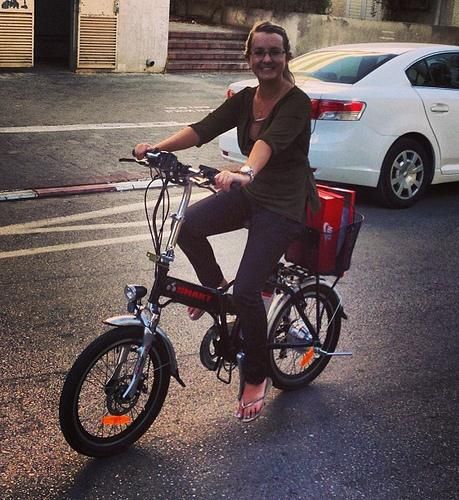
Factors why people don’t bike Safety Lack of infrastructure Weather Inconvenience Logistic issues Lack of fitness Lack of time Being tired Too much effort
Shifting the four types of cyclists

          4% Strong & Fearless

9% Enthused &         56% Interested                            31% No Way,
  Confident           but Concerned                               No How

                                   Geller, 2006 and Dill & McNeil, 2012
People that are
older
People who live in
areas that are hilly
People who commute
distances greater than
5 miles
People that have a
physical limitation that
makes cycling difficult
Woman tend to bike
less that men. Women
make up approx. 25% of
all bike trips in the US.
People don’t always
feel safe biking in
traffic
People who don’t want
to sweat or wear
special clothes to
commute
People who need to
carry or haul items or
people
What are the critical pieces to increase
cycling?

        Critical
                   Infrastructure     Cost
         Mass

      Technology      Access        Attitudes
WHAT IS AN E-BIKE?
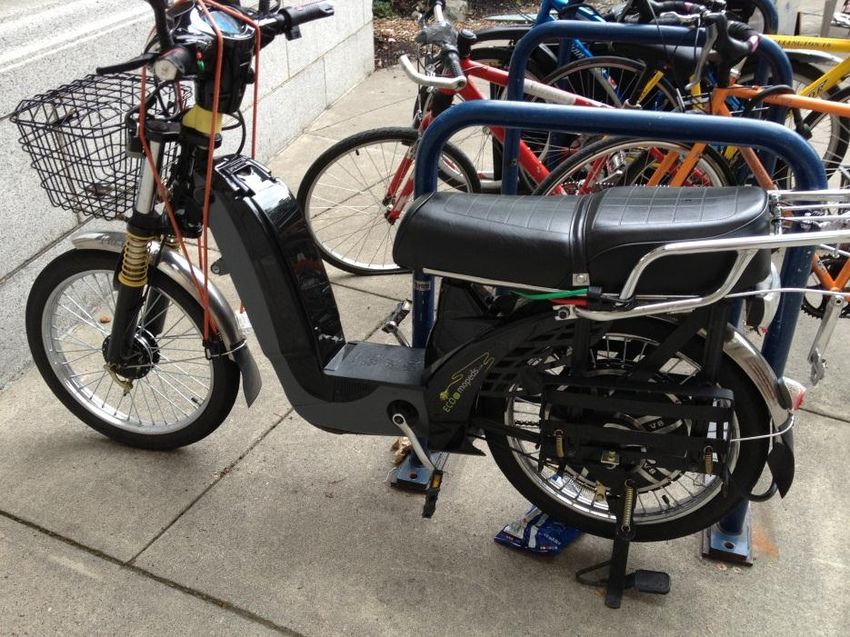
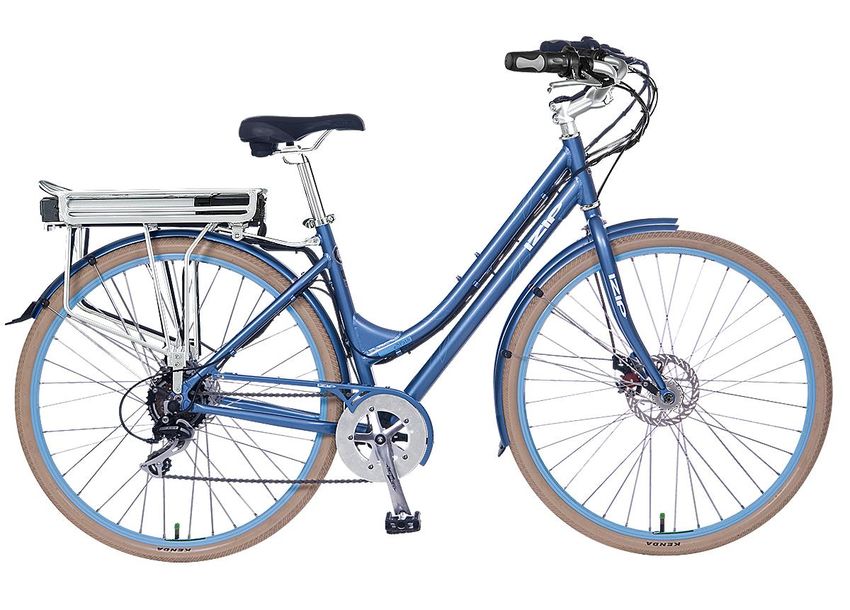
What is an electric bike?
Power controls
&
Battery
Gear shifts
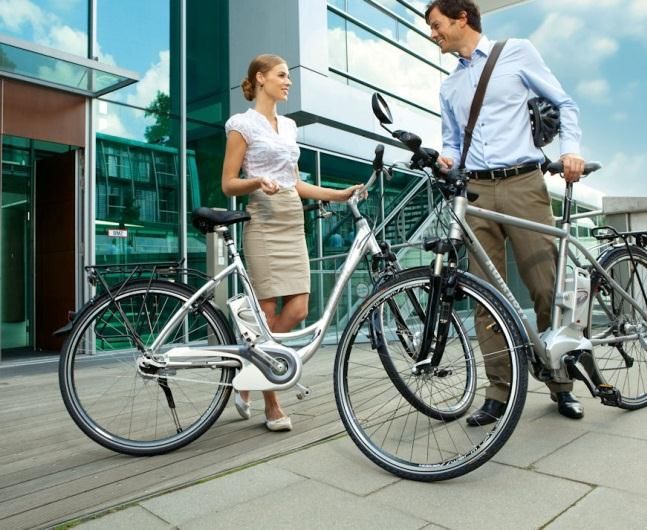
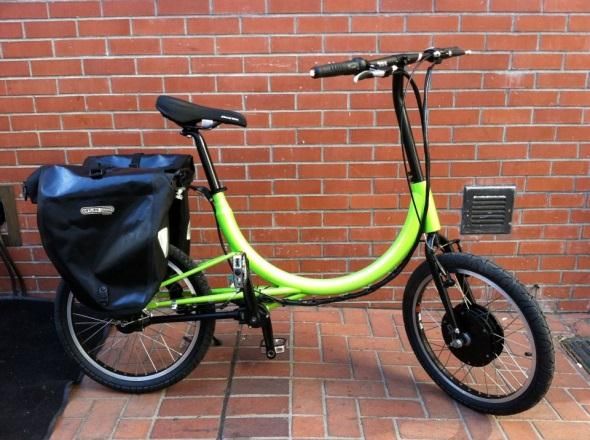
Motor (Hub or Chain drive)Come in all shapes and sizes
Different types of the e-bikes

Throttle                     Pedelec

Powered bicycle (PB) versus Powered-assisted bicycle (PAB)
Not considered “e-bikes”

Moped             Scooter
Definition of an E-bike
The Consumer Product Safety Act regulates the use of
low-speed electric bicycles to “two-or three-wheeled
vehicle with fully operable pedals and an electric motor
of less than 750 watts (1 horse power), whose maximum
speed on a paved level surface, when powered solely by
such a motor while ridden by an operator who weighs
170 pounds, is less than 20 mph” Sec. 38 [15 U.S.C. § 2085]
Oregon - ORS 801.258 “Has a power output of not more
than 1,000 watts” but ORS 807.020(15) “A person may
operate an electric assisted bicycle without a driver
license or driver permit if the person is 16 years of age
or older.”International Definitions Compared
Region Power Top Speed PB PAB Other
Limit allowed allowed
US 750W 20 mph Yes Yes Has operating pedals
Canada 500W 20 mph Yes Yes Has operating pedals,Market for E-bikes
Electric Bicycle Sales by Region, World Markets: 2012-2018
Source: Navigant/Pike ResearchProjected US Growth
Source: Navigant/Pike ResearchU.S. E-BIKE USER SURVEY
What Is Our Research Question? Will e-bikes… Get more people to bike, and Get people to bike more often.
Survey Methodology
Adapted a survey instrument from
the Institute of Transport Studies
at Monash University
The survey was distributed
through e-bike blogs & forums,
Facebook pages, Twitter accounts,
e-mails to manufacturers and
retailers, and via postcards to
retailers in the Portland region.
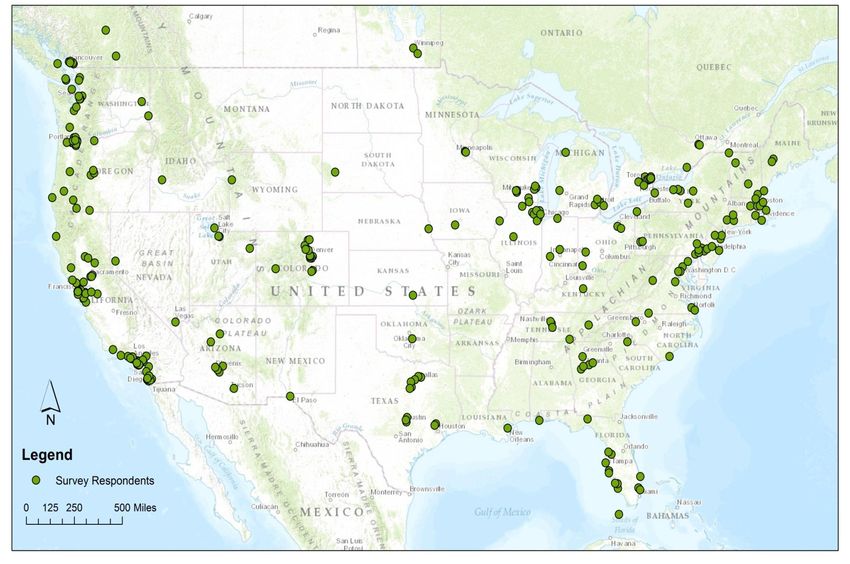
March 7 – July 1, 2013
553 e-bike owners responded to
the surveyGeography of survey respondents
Demographics
                 Gender                                             Age
          85%
                            n=553        65 and over                    13%              32%
                                             55 to 64
                             15%             45 to 54                            26%
                                             35 to 44                    18%
                                             25 to 34             10%
          Male              Female           18 to 24   1%                      n=451

           Education                                          Income
                      37%       34%
                                               $150,000 or more                         16%
n=448       25%                           $100,000 to$150,000                             18%
                                           $75,000 to $100,000                          16%
                                             $50,000 to $75,000                           18%
                                             $35,000 to $50,000                   13%
  4%                                                                       7%
                                            $25,000 to $35,000
                                             $15,000 to $25,000            7%
  High      Some      College Graduate            Under $15,000          5%      N = 448
 School    College   Graduate Degree
Demographic summary
90% White, 5% Asian, 5% other (n=428)
90% have access to a motor vehicle, 7% no vehicle
30% indicated that they have a physical condition that
makes riding a standard bike difficult (n=450)
How would you rate your general health?
40%
30%
20%
10%
0%
Excellent Very Good Good Fair Poor
n=449Purchase Decisions
48% purchased an e-bike,
while 52% converted a standard bike to electric-assist.
What type of bike did you convert?
40%
16%
10% 13%
11% 7%
2% 1%In which year did you purchase your
electric bike or conversion kit?
2005 or before 3%
2006 3%
2007 2%
2008 5%
2009 11%
2010 11%
2011 20%
2012 34%
2013 13%
n=421How much did your electric bike or
conversion kit cost to purchase?
28%
24% Purchased 25%
Converted
18% 18% 18%
16% 17%
14%
10%
8%
6%
$500 or less $501 - $1,000 - $1,501 - $2,001 - $2,501 or
$1,000 $1,500 $2,000 $2,500 more
n=414What were the main reasons you bought an
electric bike, or converted a standard bicycle?
80%
70%
60%
50%
40%
30%
20%
10%
0%
To replace some car Health - medical Health - to increase Because you live or To ride with less To be able to keep
trips condition reduced physical fitness work in a hilly area effort up with
your ability to ride friends/family when
a standard bike I go for rides
Male Female
Respondents w/ physical limitation Respondents w/out a physical limitation
Respondents 55What is the main reason that you use
your electric bike (purpose of trips)?
70%
60%
50%
40%
30%
20%
10%
0%
Commute to Local trips (shopping Recreation Other
work/school and errands)
Male Female
Respondents w/ physical limitation Respondents w/out a physical limitation
Respondents < 55 Respondents > 55
“I have bad knees( I'm retired, 68 years old). If I pedal a bike my range is
limited by pain to about 5 to 6 miles. The e-bikes has a range per charge
of 30 to 35 miles.” – Survey RespondentBike Use
94% indicated they had rode a
standard bike as an adult
55% rode their standard bike weekly
or daily prior to e-bike purchase --this
went up to 93% after purchase
Of the 6% that hadn’t rode a bike as
an adult, of those 89% ride their e-
bike daily or weekly
Over 90% use their e-bikes weekly or
daily
“To replace 95% of car trips and make commuting fun”
– Survey RespondentGetting around
45% indicated that they take a different
route on their e-bike than a standard
bike
35% don’t avoid hills on e-bike and
31% will take more direct or higher
traffic route on e-bike but 30% say they
take lower traffic or less direct route
Three quarters (73%) ride to different
destinations on their e-bikes than they
did on a standard bikeWhat are the different destinations
you ride to on your electric bike?
52% of women responded 40%
that they take a different 35%
route on their electric bike 30%
than they did on their 25%
standard bike as compared 20%
to 42 percent of men. 15%
82% of women responded 10%
that they ride to different 5%
destinations on their electric 0%
bike than they did on their
standard bike compared to
73 percent of men.My top speed is higher than when I
rode a standard bike
Respondents without physical
26% 65%
limitation
Respondents with physical
16% 74%
limitation Disagree or
Strongly Disagree
55 and Older 20% 71% Neither agree or
disagree
Under 55 25% 65% Agree or Strongly
Agree
Don't know
Female 23% 68%
Male 23% 68%
All respondents 23% 68%My average speed is higher than when
I rode a standard bike
Respondents without physical
11% 84%
limitation
Disagree or
Respondents with physical Strongly Disagree
8% 85%
limitation
Neither agree or
55 and Older 12% 82% disagree
Agree or Strongly
Under 55 9% 86% Agree
Don't know
Female 12% 77%
Male 10% 86%
All respondents 10% 74%I don't need to shower at the end of
the trip
Respondents without physical
10%12% 77%
limitation
Respondents with physical
11% 19% 69%
limitation Disagree or
Strongly Disagree
55 and Older 13% 18% 68%
Neither agree or
disagree
Under 55 8%12% 80%
Agree or Strongly
Agree
Female 6% 18% 77%
Don't know
Male 11% 14% 74%
All respondents 10% 14% 74%To ride the same trip by standard bike
I would need a shower
Respondents without
13% 19% 65%
physical limitation
Respondents with physical Disagree or
8% 20% 70% Strongly
limitation
Disagree
55 and Older 6% 25% 66% Neither agree or
disagree
Under 55 17% 15% 67% Agree or
Strongly Agree
Female 19% 24% 55% Don't know
Male 11% 19% 69%
All respondents 12% 20% 67%I feel safer on the e-bike than on a
standard bike
Respondents without
16% 24% 60%
physical limitation
Respondents with physical
15% 21% 61%
limitation Disagree or
Strongly
55 and Older 20% 21% 56% Disagree
Neither agree or
Under 55 12% 25% 63% disagree
Agree or
Female 12% 28% 54% Strongly Agree
Male 16% 22% 61% Don't know
All respondents 15% 23% 60%What are the main advantages to riding an e-bike? 20% 15% 10% 5% 0%
What are the main disadvantage to
      riding an e-bike?
30%
25%
20%
15%
10%
5%
0%
Conclusions
Have a potential to get more people on bikes
Older adults
People with physical limitations
Women (?)
I Icannot
live in drive
a hillydue
town to and
epilepsy.
wouldI never
cannotcommute
bus due to to severe
work on a
motion
standardsickness.
bike -- Biking
I wouldn'tis my
beonly
ableway to work
to make it upother than My
the hills.
getting
electrica assist
ride. Bike
bikecommuting maintains
makes commuting bymybikefitness level. I can
possible.
ride even when I don't feel physically well or am overtired. I get
toI am
workagefaster
78, than
legallyit takes
blind, when I get in
live alone a car ride. I love
a semi-rural the time
area. 4
outdoors,
miles to theseeing the city
nearest and feeling
scheduled like part
bus route andoftown,
the bike
7 miles to
community.
my favorite shopping area, 12 miles to my church.Conclusions
Encourages more people to bike more often & to
more distant locations
Commuters
Less sweaty, not strenuous
Not avoiding trips or locations
Enjoy biking!
Reported increase in bike usage
I use
get more
the e-bike
exercise
primarily
with the
as e-bike
a substitute
because
for the
I ride
carmore.
where I would have
otherwise would have driven a car.
E-bikes are a fantastic replacement for a car for short distances.
I can carry my son and a week’s worth of groceries.
I can ride to and from work without needing to shower at my
destination.Limitations No response rate Method of delivery Online survey and self reporting use Not random and potential basis
Additional Research Needs
Comparative analysis with different regions (e.g.,
Australia)
Infrastructure planning
More evaluations of existing users
Studies of potential e-bike users, especially women and
older adults
Safety
Impacts on physical activity
Interactions with other road users (perceptions & attitudes)
Policy and legalKaiser Permanente E-bike Project
Currie iZip E3 Compact
Top Speed: 18 mph
Range: 15-22 miles
Weight: 42 lbs
Folding
Kaiser Employees at 3
campuses (1st/last mile
commuting)
18 month trail & 180 peopleContact Information John MacArthur macarthur@pdx.edu 503-725-2866 ebike.research.pdx.edu Thanks to Prof. Jennifer Dill and Mark Person for their work on the survey and OTREC/NITC for funding this project. Special thanks to Geoffrey Rose & Marilyn Johnson, Institute of Transport Studies at Monash University for the use of the survey instrument
You can also read