Electricity Consumers and Compliance - Trust, Reciprocity, and Socio-economic Factors in Uttar Pradesh - Council on Energy ...
←
→
Page content transcription
If your browser does not render page correctly, please read the page content below
An initiative supported by                 i

Electricity Consumers
and Compliance
Trust, Reciprocity, and Socio-economic
Factors in Uttar Pradesh

Report | February 2019

Karthik Ganesan, Kapardhi Bharadwaj, and
Kanika Balani
ii Electricity Consumers and Compliance: Trust, Reciprocity, and Socio-economic Factors in Uttar Pradesh
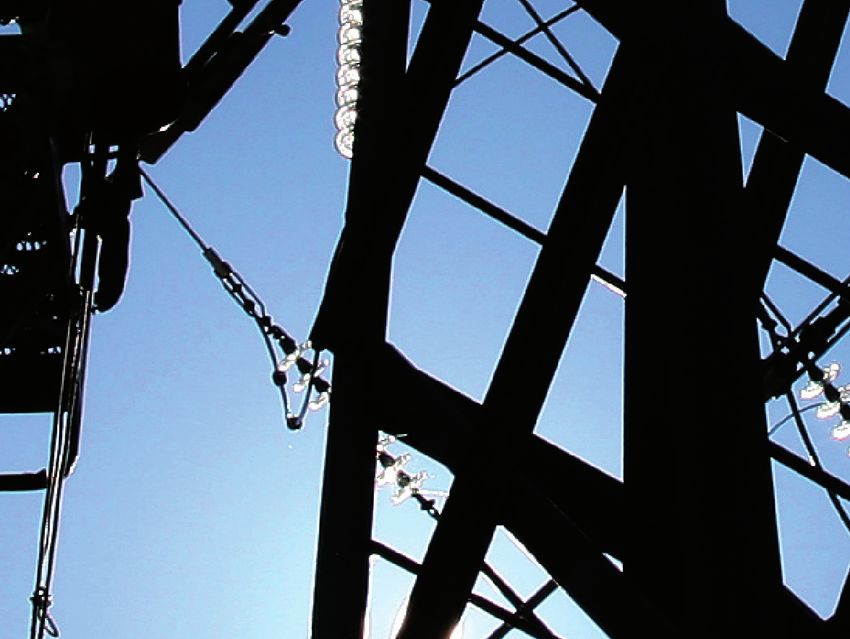
Image: iStock
i

         An initiative supported by

    Electricity Consumers
       and Compliance
Trust, Reciprocity, and Socio-economic
        Factors in Uttar Pradesh

     Karthik Ganesan, Kapardhi Bharadwaj, and Kanika Balani

                            Report
                         February 2019
                            ceew.in
ii   Electricity Consumers and Compliance: Trust, Reciprocity, and Socio-economic Factors in Uttar Pradesh

     Copyright © 2019                  Council on Energy, Environment and Water (CEEW)

                                       Open access. Some rights reserved. This report is licensed under the Creative Commons
                                       Attribution-Noncommercial 4.0. International (CC BY-NC 4.0) license. To view the full license,
                                       visit: www.creativecommons.org/licenses/ by-nc/4.0/legalcode.

                                       Report on ‘Electricity Consumers and Compliance: Trust, Reciprocity and Socio-economic
                                       Factors in Uttar Pradesh’.

     Citation:                         Karthik Ganesan, Kapardhi Bharadwaj, and Kanika Balani (2019) ‘Electricity Consumers and
                                       Compliance: Trust, Reciprocity, and Socio-economic Factors in Uttar Pradesh,’ February.

     Dataset citation:                 Ganesan, Karthik; Bharadwaj, Kapardhi; Balani, Kanika; Council on Energy, Environment and
                                       Water; Initiative for Sustainable Energy Policy; Electricity Consumers and Compliance: Trust,
                                       Reciprocity, and Socio-economic Factors in Uttar Pradesh, 2019.

     Disclaimer:                       The views expressed in this report are those of the authors and do not necessarily reflect
                                       the views and policies of the Council on Energy, Environment and Water. The views/analysis
                                       expressed in this report do not necessarily reflect the views of the Shakti Sustainable Energy
                                       Foundation or the Initiative for Sustainable Energy Policy (ISEP), Johns Hopkins University. The
                                       organisations do not guarantee the accuracy of any data included in this publication nor do they
                                       accept any responsibility for the consequences of its use.

     Cover image:                      iStock

     Peer reviewers:                   Dr Jonathan Balls, Postdoctoral Fellow, University of Melbourne; Shantanu Dixit, Group
                                       Coordinator, Prayas Energy Group; Vikas Chandra Agarwal, Director-Distribution, UPERC; and
                                       Abhishek Jain, Senior Programme Lead, CEEW.

     Publication team:                 Alina Sen (CEEW), Mihir Shah (CEEW), Surit Das, Aspire Design, and Friends Digital.

     Organisations:                    Council on Energy, Environment and Water (CEEW)

                                       The Council on Energy, Environment and Water (www.ceew.in) is one of South Asia’s leading
                                       not-for-profit policy research institutions. The Council uses data, integrated analysis, and
                                       strategic outreach to explain—and change—the use, reuse, and misuse of resources. It prides
                                       itself on the independence of its high-quality research, develops partnerships with public and
                                       private institutions, and engages with the wider public. In 2019, CEEW was once again featured
                                       across nine categories in the “2018 Global Go To Think Tank Index Report”. CEEW has also been
                                       consistently ranked among the world’s top climate change think tanks. Follow us on Twitter
                                       @CEEWIndia for the latest updates.

                                       Shakti Sustainable Energy Foundation

                                       Shakti Sustainable Energy Foundation works to strengthen the energy security of the country by
                                       aiding the design and implementation of policies that encourage energy efficiency, renewable
                                       energy and sustainable transport solutions, with an emphasis on subsectors with the most
                                       energy saving potential. Working together with policy makers, civil society, academia, industry
                                       and other partners, we take concerted action to help chart out a sustainable energy future for
                                       India (www.shaktifoundation.in).

                                       Council on Energy, Environment and Water
                                       Sanskrit Bhawan, A-10, Qutab Institutional Area
                                       Aruna Asaf Ali Marg, New Delhi – 110067, India
iii

ABOUT CEEW
The Council on Energy, Environment and Water (CEEW) is one of South Asia’s leading not-for-profit policy
research institutions. The Council uses data, integrated analysis, and strategic outreach to explain – and
change – the use, reuse, and misuse of resources. The Council addresses pressing global challenges
through an integrated and internationally focused approach. It prides itself on the independence of its
high-quality research, develops partnerships with public and private institutions, and engages with the
wider public.

In 2019, CEEW once again featured extensively across nine categories in the ‘2018 Global Go To Think
Tank Index Report’, including being ranked as South Asia’s top think tank (15th globally) with an annual
operating budget of less than USD 5 million for the sixth year in a row. CEEW has also been ranked as South
Asia’s top energy and resource policy think tank in their latest rankings. In 2016, CEEW was also ranked
2nd in India, 4th outside Europe and North America, and 20th globally out of 240 think tanks as per the
ICCG Climate Think Tank’s standardised rankings. In 2013 and 2014, CEEW was rated as India’s top climate
change think-tank as per the International Center for Climate Governance (ICCG) standardised rankings.

In over eight years of operations, The Council has engaged in 200 research projects, published well over
130 peer-reviewed books, policy reports and papers, advised governments around the world nearly 500
times, engaged with industry to encourage investments in clean technologies and improve efficiency
in resource use, promoted bilateral and multilateral initiatives between governments on more than 60
occasions, helped state governments with water and irrigation reforms, and organised nearly 250 seminars
and conferences.

The Council’s major projects on energy policy include India’s largest multidimensional energy access survey
(ACCESS); the first independent assessment of India’s solar mission; the Clean Energy Access Network
(CLEAN) of hundreds of decentralised clean energy firms; India’s green industrial policy; the USD 125 million
India-U.S. Joint Clean Energy R&D Centers; developing the strategy for and supporting activities related
to the International Solar Alliance; designing the Common Risk Mitigation Mechanism (CRMM); modelling
long-term energy scenarios; energy subsidies reform; energy storage technologies; India’s 2030 Renewable
Energy Roadmap; energy efficiency measures for MSMEs; clean energy subsidies (for the Rio+20 Summit);
clean energy innovations for rural economies; community energy; scaling up rooftop solar; and renewable
energy jobs, finance and skills.

The Council’s major projects on climate, environment and resource security include advising and
contributing to climate negotiations (COP-24) in Katowice, especially on the formulating guidelines of the
Paris Agreement rule-book; pathways for achieving Nationally Determined Contribution and Mid-Century
Strategy for decarbonisation; assessing global climate risks; heat-health action plans for Indian cities;
assessing India’s adaptation gap; low-carbon rural development; environmental clearances; modelling HFC
emissions; the business case for phasing down HFCs; assessing India’s critical minerals; geoengineering
governance; climate finance; nuclear power and low-carbon pathways; electric rail transport; monitoring
air quality; the business case for energy efficiency and emissions reductions; India’s first report on global
governance, submitted to the National Security Adviser; foreign policy implications for resource security;
India’s power sector reforms; zero budget natural farming; resource nexus, and strategic industries and
technologies; and the Maharashtra-Guangdong partnership on sustainability.

The Council’s major projects on water governance and security include the 584-page National Water
Resources Framework Study for India’s 12th Five Year Plan; irrigation reform for Bihar; Swachh Bharat;
supporting India’s National Water Mission; collective action for water security; mapping India’s traditional
water bodies; modelling water-energy nexus; circular economy of water; participatory irrigation
management in South Asia; domestic water conflicts; modelling decision making at the basin-level;
rainwater harvesting; and multi-stakeholder initiatives for urban water management.
iv Electricity Consumers and Compliance: Trust, Reciprocity, and Socio-economic Factors in Uttar Pradesh
v

ACKNOWLEDGMENTS
The authors of this report thank the Shakti Sustainable Energy Foundation for their support in
carrying out this study and Morsel Research and Development Private Ltd., the survey agency, and its
enumerators for their tireless effort in administering the survey and collecting the data.

For their valuable contributions in the conceptualisation and design of the survey, we thank our
collaborators Johannes Urpelainen (Professor, Johns Hopkins School of Advanced International
Studies); Jason Chun Yu Wong (Columbia University); and Brian Dylan Blankenship (Columbia
University).

We thank Mr Vikas Chandra Agarwal for his guidance throughout the study and state sector experts
Mr Rama Shankar Awasthi and Mr Awadesh Kumar Verma for conversations that expanded our
understanding of the power sector in Uttar Pradesh.

We thank our reviewers – Dr Jonathan Balls (University of Melbourne); Shantanu Dixit (Group
Coordinator, Prayas Energy Group); Vikas Chandra Agarwal (Director, Distribution, Uttar Pradesh
Electricity Regulatory Commission); and Abhishek Jain (Senior Programme Lead, CEEW) – for their
critical comments and feedback, which helped us in presenting our findings better.

Many discom officials apprised us of the ground realities that utilities face and vetted the survey
results – Pankaj Kumar (CE, Azamgarh zone, Purvanchal Vidyut Vitran Nigam Limited (PuVVNL));
A. K. Srivastava (CE, Saubhagya), accompanied by discom officials of Mau, Balia, and Kaushambi
regions, PuVVNL; Shashi Bhushan Sharma (CE (Commercial), PuVVNL); V. K. Gangwar (CE, Agra
zone, Dakshinanchal Vidyut Vitran Nigam Limited (DVVNL)); Satish Singh (SE, Headquarters,
LESA, Madhyanchal Vidyut Vitran Nigam Limited (MVVNL)); and Brahm Pal (Director, Commercial,
Headquarters, MVVNL).

Finally, the authors thank our colleagues at CEEW – Prateek Agarwal, Kangkanika Neog, Sunil Mani,
Tauseef Shahidi, and Saurabh Tripathi – for their support in providing valuable inputs in the writing
of the report.
vi Electricity Consumers and Compliance: Trust, Reciprocity, and Socio-economic Factors in Uttar Pradesh
vii

ABOUT THE AUTHORS

Karthik Ganesan                         Kapardhi Bharadwaj                    Kanika Balani
karthik.ganesan@ceew.in                 kapardhibm0102@gmail.com              kanika.balani@ceew.in

Karthik is a Research Fellow at         Kapardhi was a Programme              Kanika is a Research Analyst at
CEEW. He has over seven years of        Associate at CEEW. He has been        CEEW. She has been working in
experience in analysing energy          involved in state-level tariff         the power sector for over three
and macroeconomic policies.             determination for Odisha and          years. Her past work includes
His current work is on cost-            Gujarat, working on tariffs for        conducting a study on ‘Regulatory
effective power generation options       biomass and hydro-power. He           Oversight of Discoms Under
for discoms, understanding              has five years of experience in        UDAY Scheme’ and conducting
environmental impacts of power          the power sector. He has a BE in      an on-field exploratory study on
generation, and the role of energy      Mechanical Engineering and an         the regulation of electricity theft
efficiency in industrial production.      MBA in Power Management from          with IIT-Kanpur. She has a BA
He has a B.Tech. and an M.Tech.         the University of Petroleum and       (Honours) in Political Science
in Civil Engineering from IIT           Energy Studies, Dehradun.             from the University of Delhi and
Madras and a Master’s in Public                                               an MA in Regulatory Governance
Policy from National University of      “Uttar Pradesh can alter the          from the Tata Institute of Social
Singapore.                              perception of success in power        Sciences, Mumbai.
                                        sector reform. With the single
“The challenges for Uttar Pradesh       largest addition of consumers         “The interactions with the
are in managing a large system          under the Saubhagya scheme, it        stakeholders establish that the
with varying degrees of capacity        presents some unique challenges.      power sector has been looked at
at different levels of the electricity   We have attempted to prioritise       as an isolated system. With public
value chain. The most important         the tasks that lie ahead, for the     sector utilities, inefficiencies are
step will be to communicate to          discoms of UP, as they make strides   passed on to consumers – either
consumers that the discoms are          in achieving and sustaining 24×7      directly or indirectly. Consumers
committed to cost recovery and          power for all”.                       are both tariff-payers and tax-
service delivery”.                                                            payers in the system, and policies
                                                                              to govern the sector must be
                                                                              cognisant of this”.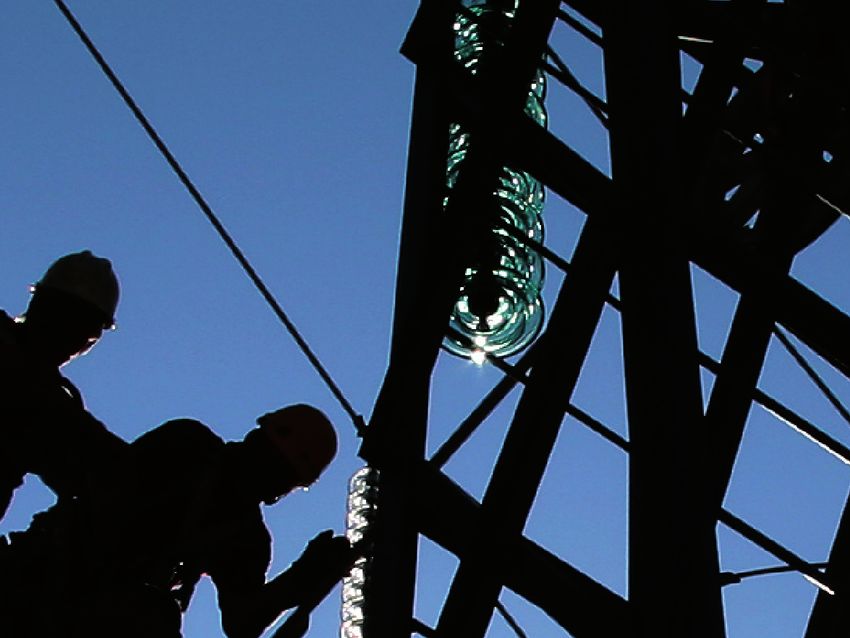
viii Electricity Consumers and Compliance: Trust, Reciprocity, and Socio-economic Factors in Uttar Pradesh
ix

CONTENTS

Executive Summary

1. Introduction                                        1

  1.1   Non-technical losses                           2

  1.2   The case of Uttar Pradesh                      3

  1.3   Non-technical losses and associated impacts   4

  1.4   Drivers of compliance and theft                5

  1.5   Motivation and objectives                     8

2. Methodology and Framework for Assessment           13

  2.1   Survey of households in UP                    14

  2.2   Framework for assessment of survey findings    16

  2.3   Limitations of the survey                     17

3. Survey Findings                                    19

  3.1   Power supply and consumer satisfaction        19

  3.2   Metering and billing – the building blocks    22

  3.3   Metering, billing, and collection losses      25

  3.4   Electricity theft                             32

4. Conclusion and Way Forward                         41

Bibliography                                          43
x   Electricity Consumers and Compliance: Trust, Reciprocity, and Socio-economic Factors in Uttar Pradesh

    LIST OF FIGURES

    Figure 1:      Electric power T&D losses (% of output)                                                      1

    Figure 2:      Surveyed districts in the state map                                                         15

    Figure 3:      Improved power supply situation in UP                                                       19

    Figure 4:      Power supply hours measured by sensors deployed across UP                                  20

    Figure 5:      Demand-supply gap in electricity supplied in rural and urban areas                          21

    Figure 6:      High share of unmetered consumers in discoms of UP                                         22

    Figure 7:      Low metering in rural areas                                                                24

    Figure 8:      Metering exercise relatively recent in rural households                                    25

    Figure 9:      Infrequent billing in rural households                                                     26

    Figure 10: Differences in billing frequency across UP discoms for rural households                        26

    Figure 11:     Proactiveness of consumers in the face of non-receipt of a bill                            28

    Figure 12: Rural and urban consumers not paying bills ahead of due date                                   30

    Figure 13: Consumers facing infrequent billing less likely to make complete payments                      30

    Figure 14: Low preference for online payments in urban and rural areas                                     31

    Figure 15: Low trust levels on discom officials, discom agents and state government                        36

    LIST OF TABLES

    Table 1:       Classification of non-technical losses                                                       3

    Table 2:       AT&C loss (%) of discoms in Uttar Pradesh                                                   9

    Table 3:       Districts sampled for survey and respective discom areas                                   14

    Table 4:       Income disparity across discom regions                                                      21

    Table 5:       Profile of unmetered domestic consumers in UP                                               23

    Table 6:       Efficiency in issuing first bill is low even in urban areas                                  26

    Table 7:       Employee costs of discoms                                                                   27

    Table 8:       Domestic consumers of States                                                                27

    Table 9:       Summary of the status of MBC                                                               32

    Table 10:      Financial management of utility and perceived personal
                   cost are important drivers of katiya acceptance                                          33-34

    Table 11:      Frequency of billing more important than trust and corruption
                   perception in driving compliance                                                         37-38

    Table 12:      Disparity across UP discoms                                                                39

    Table 13:      Policy roadmap for sustaining reliable electricity supply in Uttar Pradesh                 42
xi ABBREVIATIONS ACCESS Access to Clean Cooking Energy and Electricity Survey of States ACoS average cost of supply AMR automated meter reader AMI advanced metering infrastructure ARR annual revenue requirement AT&C aggregate technical and commercial CEA Central Electricity Authority DDUGJY Deen Dayal Upadhyaya Gram Jyoti Yojana Discom distribution company DVVNL Dakshinanchal Vidyut Vitaran Nigam Limited ESMI Electricity Supply Monitoring Initiative FY financial year GCI Global Corruption Index GJ Gujarat HT half the time IEA International Energy Agency KA Karnataka kW kilo watt kWh kilo watt hour HH household INR Indian Rupees MBC metering, billing and collection MoP Ministry of Power MoU Memorandum of Understanding MH Maharashtra MT most of the time MVVNL Madhyanchal Vidyut Vitaran Nigam Limited PEG Prayas Energy Group PVVNL Paschimanchal Vidyut Vitaran Nigam Limited PuVVNL Purvanchal Vidyut Vitaran Nigam Limited R-APDRP Restructured Accelerated Power Development Reforms Programme Saubhagya Pradhan Mantri Sahaj Bijli Har Ghar Yojana ST some of the time T&D transmission and distribution TPL Torrent Power Limited UDAY Ujwal Discom Assurance Yojana UP Uttar Pradesh UPERC Uttar Pradesh Electricity Regulatory Commission UPPCL Uttar Pradesh Power Corporation Limited USD United States Dollar
xii         Electricity Consumers and Compliance: Trust, Reciprocity, and Socio-economic Factors in Uttar Pradesh

      ~42%
      of the total electricity
      supplied by all the
      discoms is consumed by
      households

      Electricity is supplied for

      17     hours in urban areas

      12       hours in rural areas

      55%
      of rural consumers are
      unmetered

      Paying consumers
      making one-time
      bill payments in full
             % When billed
      86        monthly

      73%          Bi-monthly
                   or longer

                                                                                                                    Image: iStock
      Source: CEEW analysis
xiii EXECUTIVE SUMMARY Uttar Pradesh An opportunity to alter the national debate I n September 2017, the Government of India announced its ambitions to achieve 100 per cent household electrification through the Saubhagya scheme. Under this, Uttar Pradesh (UP) added the largest number of households to its existing consumer base – as many new consumers as served by state distribution companies (discoms) before the launch of the scheme. Discoms, already plagued by high under-recovery, face the onerous challenge of serving a large consumer base that has low capacity to pay. A lion’s share of the electricity consumption in UP – about 42 per cent of the total electricity supplied by all discoms – is attributable to domestic consumers (households). More than two-thirds of the total subsidy earmarked (for discoms) for 2017–2020 is targeted at rural consumers. That is the size of pub- lic spending needed to enable the incremental universal energy access. Household consump- tion significantly impacts the overall financial position of discoms and the state. Any discussion on losses and theft calls for an evaluation of services provided by discoms. Electricity loss other than that attributable to technical reasons may be broadly classified into hard theft and metering, billing, and collection (MBC) losses. Hard theft refers to theft as defined under Section 135 of the Electricity Act-2003 (referred as Act) and entails, mainly, theft due to hooking of wires (katiya), meter tampering, and unauthorised electricity usage, and includes wilful misrepresentation of electricity consumption. MBC losses are a ‘soft’ form of theft, arising from lax operational diligence of the discom and the consumer’s lack of awareness, which precipitates consumer indifference or alienates them. This soft theft includes inter alia losses due to incorrect recording or wrong accounting of energy consump- tion at the discom’s end, billing irregularities, and non-timely payment or non-payment of outstanding amounts by consumers as per bills. Overwhelmingly, households believe that the government should oversee energy provision and management, but the provision of electricity beyond the limited levels required to pro- mote development outcomes must be on commercial terms, where the full value of electricity is realised by every stakeholder in the value chain. An evaluation of Ujwal Discom Assurance Yojana and Power for All, at the end of their respective implementation periods (2019/20) will provide details on the efforts of discoms, and the response from the consumer in shoring up revenue realisation and discom finances. And the UP experience is likely to shape the policy discourse and design of any new interventions. This CEEW study, in the meanwhile, was car- ried out to improve our understanding of the discom–consumer dynamics in UP and how it manifests in supply outcomes for the consumer. This study further aims to: unpack the commercial losses attributed to domestic consumers;
xiv Electricity Consumers and Compliance: Trust, Reciprocity, and Socio-economic Factors in Uttar Pradesh
capture the consumer perspective and actions (or lack thereof) in the midst of the
administrative reform under way; and
explore how this reform can help drive targeted activities to improve compliance,
satisfaction, and create a virtuous cycle for the utility business in the state.
Sampling, survey, and data This study
In addition to relying on administrative data, stakeholder interviews and interactions, CEEW
aims to capture
undertook a consumer survey to capture the finer details of electricity distribution in UP. the consumer
The survey captures information on the electricity supply situation, compliance metrics, perspective and
perceptions on trust and prevalence of theft and most importantly, social and economic actions (or lack
endowments of households in rural and urban areas. The survey was supported by Shakti
Sustainable Energy Foundation and conducted in association with the Initiative for Sustain-
thereof) in the
able Energy Policy at the School of Advanced International Studies, Johns Hopkins University. midst of the
Extending across 10 districts of the state in both rural and urban areas, the survey was under- administrative
taken over a three-month period from April 2018 to June 2018. reform under
The sampling design is representative of rural and urban areas. The findings can be extended
way
to the state as a whole. The 10 districts (Aligarh, Ambedkar Nagar, Banda, Ballia, Budaun,
Kaushambi, Mau, Moradabad, Muzaffarnagar, and Sultanpur) cover the operating areas of
four of the five public distribution companies – Dakshinanchal Vidyut Vitran Nigam Limited
(DVVNL), Paschimanchal Vidyut Vitran Nigam Limited (PVVNL), Purvanchal Vidyut Vitran
Nigam Limited (PuVVNL), and Madhyanchal Vidyut Vitran Nigam Limited (MVVNL). We
surveyed a total of 90 villages (rural), 90 wards (urban), and around 1,800 households – 900
each in rural and urban areas.
Discom services through the consumer’s lens
Electricity is supplied for 17 hours in urban areas and 12 hours in rural areas (median fig-
ure). Both rural and urban households experience the highest gap between availability and
requirement from 5 pm to 11 pm. Supply during evening and late evening hours is highly
valued by consumers, especially urban consumers. Their satisfaction with supply is linked to
availability during this period.
The lack of metering among residential consumers is one of the major contributors to discom
losses. The share of unmetered consumers in rural areas is expectedly high – 55 per cent. The
standout observation is that 10 per cent of urban consumers are unmetered. In rural house-
holds, meters are relatively new (see figure next page). The median age of meters installed in
rural areas of three of the discoms (barring MVVNL) is less than one year. Metered connec-
tions are much older in most urban areas. In the PuVVNL service area, however, the median
age of meters in urban areas is only three years. Many urban areas are well short of complete
metering as well.
Billing is a key part of the discom service value chain, but discoms find the exercise adminis-
tratively and financially draining. Apart from technical challenges (IT systems, ledgerisation,
indexation of consumers), discoms in UP lack the manpower to cover the vast region they
serve, and their administrative cost of reading meters manually and issuing bills is high. Bill-
ing is more frequent in PVVNL areas than in others, but it is lax in the MVVNL control area
(see follwing graph).Executive Summary xv
Years since installation of first meter Metering exercise
2.2 3.6 4.3 3.2
100% 5.2 5 6.5 relatively
7.5 7.1 1.6
5 5 7.1 8.5 3.2 recent for rural
90% 17.8 7.1
12.5 7.1
80% 7.1 38.9 households
20.5 29
10 Source: CEEW analysis
% of households
70% 35 25 38.3
58.1 37.8
60% 35.7
50% 37.5
40%
69.2
30% 61.1 62.9
55 28.9 57.1
42.9 48.9
20% 35.5
32.5
10%
13.3
0%
Ambedkar
Nagar
Sultanpur
Muzaffarnagar
Aligarh
Banda
Budaun
Ballia
Kaushambi
Mau
Moradabad
DVVNL MVVNL PuVVNL PVVNL
20 years
Discom-wise billing frequency in rural households Billing in rural
100%
12 10 9 5 8 12 households is
90% 20
5.7 23 16 infrequent
15.9 30 12
80% 3 22 Source: CEEW analysis
2
Share of households
70% 13 52
10.6 40 16 4
21
10 7 21
60% 36.7 19
50% 23.9 9 22
17 10
40% 12
26
30% 17 26
59
53
20% 42.6 40 39.6 28
16 41
10% 24 21
8 9
0
Ambedkar
Nagar
Sultanpur
Muzaffarnagar
Aligarh
Banda
Budaun
Ballia
Kaushambi
Mau
Moradabad
DVVNL MVVNL PuVVNL PVVNL
Monthly Bi-monthly Every 3 months >3 months Others
The financial burden of accumulated bills is significant on rural households, especially
those with low and seasonal incomes; they find it difficult to set aside large sums in the
anticipation of bills. The significance of monthly billing is evident in the bill payments made
by consumers. When billed monthly, 86 per cent of paying consumers make one-time bill
payments in full, but this figure falls to 73 per cent if the billing frequency is bi-monthly or
When billed
longer. We also find that when billed frequently, rural households pay their dues just as frequently, rural
much as urban households do. A delay in payments from consumers affects discoms’ work- households pay
ing capital flows, and they are forced to resort to commercial borrowing to finance day-to-day their dues just as
operations – yet another avoidable cost.
much as urban
households doxvi Electricity Consumers and Compliance: Trust, Reciprocity, and Socio-economic Factors in Uttar Pradesh
RURAL URBAN Declining efficiency
from supply to
Surveyed HHs 900 900 collection
Source: CEEW analysis
Share of grid-connected HHs 85% 95%
Share of metered HHs 45% 90%
Share of metered and billed HHs 33% 85%
Share of metered billed and paying HHs 28% 79%
Source: CEEW analysis
The table above shows the progressive decline in discom efficiency from supply to bill-
ing. Despite this, nearly 63 per cent of all legally connected consumers pay some non-zero
amount in lieu of their dues.
Trust, compliance, and hard theft
Losses arising from indifference to proper metering, billing, and collection – on the part of
both discoms and consumers – are large enough to significantly dent utility finances. When
measurement is absent to such a large degree, speculation gives rise to alternative explana-
tions that promote the notion of extensive hard theft, to explain high levels of discom losses.
With such entrenched issues, it is unlikely that aggregate technical and commercial (AT&C)
targets can be met soon. A more pragmatic approach that gathers support for metering and
provides resources for extensive billing and collection infrastructure, is needed. Curbing
hard theft of electricity has been one of the key goals of the present administration in the
state, and efforts are under way to improve monitoring and reduce discom losses from elec-
tricity theft. That said, we take a look at the socio-economic drivers of electricity theft in the
state.
To assess how they view the utility business, we asked households to rate the importance of
four attributes of a utility – quality of electricity service, method and frequency of bill collec-
tion, communications with the utility employee, and good financial management of the util-
ity – on a scale of 1 (least) to 5 (most). An overwhelming share of rural and urban households
valued supply quality (70 per cent rating of ‘important’ or ‘very important’). The method and
frequency of bill collection was considered important by 51 per cent of rural respondents but
67 per cent of urban residents. Good financial management was considered important by
57 per cent of rural residents and 59 per cent of urban residents. Many people who consider In rural areas,
supply quality important do not consider the financial management of the utility important; the median
that suggests that the commercial aspects of the utility business are not widely understood. monthly payment
Metered consumers exhibited a lesser acceptance of katiya among other consumers. An is INR 60 to the
increase in the perceived importance of the utility’s financial management results in lesser linesman and
acceptance. More than 84 per cent of respondents find katiya either unacceptable or highly INR 250 to the
unacceptable, but more than 52 per cent of them would issue only a warning to anyone
found using a katiya. This is in line with the official position for the most part where crimi-
discom, and in
nal proceedings have rarely been undertaken. Levying heavy punishments is, however, not urban areas it is
the only contributor to discouraging dishonest behaviour; the perceived likelihood of being ~INR 100 to the
punished must also increase commensurately. linesman and
Overall, consumer trust in the utility (the principal) and its actors (agents – discom offi- INR 600 to the
cials, linesmen, bill agents) is low – less than 20 per cent of consumers trust these entities. discomExecutive Summary xvii
The principal is particularly distrusted. Given the distrust, is the consumer exploiting the
principal–agent asymmetry to their benefit? Overall, nearly 23 per cent of all grid-connected
rural households make a monthly non-zero payment to the linesman. This share drops to 15
per cent in urban areas. A majority of households reporting payments to the linesman report
that they regularly pay their utility dues too. In rural areas, the median monthly payment is
INR 60 to the linesman and INR 250 to the discom, and in urban areas it is ~INR 100 to the
linesman and INR 600 to the discom. For households that make an informal payment to the Households that
linesman, the sum is substantial relative to their formal payment to the discom. are billed more
However, it would be difficult to attribute these payments as indicators of theft. Documented frequently are
accounts suggest that the utility lacks the manpower to carry out various operational and 57 per cent more
maintenance works, and that households have to pay the linesman to attend to faults in their likely to pay on
homes or investigate power outages. Payments to bill agents are reported by only 2 per cent
of the population.
time and 72 per
cent more likely
An econometric assessment of the drivers of compliance (in paying bills) shows that lack of to pay in full than
trust in the utility and perception of corruption are significant deterrents. Frequent billing is
the most important and consistent driver. Households that are billed more frequently are 57
households that
per cent more likely to pay on time and 72 per cent more likely to pay in full than households are not
that are not. The findings suggest that, both principal and agent need an image makeover. To
maintain service standards, and persuade consumers of the intent for reform, increased en-
gagement with consumers through targeted outreach and communication will be essential.
Uttar Pradesh has not one but a diverse set of challenges
in dealing with losses
Uttar Pradesh is not a singular entity - in terms of the extent of the various challenges faced by the power sector.
The four discom regions present significant diversity in geographical spread, economic status, demographic
mix, and prevailing social norms. The Purvanchal region in the state is the poorest performer on most of the
discom service parameters. In part, some of this can be attributed to the consumer mix as well. PuVVNL has
the most skewed residential consumer mix with 70% being in rural areas. While the rest have a higher share of
urban consumers, as compared to rural, MVVNL will see a near tripling of its consumer base, as per recent tariff
orders. Many of these rural consumers are unmetered, and not surprisingly, our study reveals consumers of
MVVNL and PuVVNL service areas are more accepting of the practice of katiya. The share of paying – industrial
and commercial, consumer base is expected to decrease for all discoms and even at present PuVVNL and DVVNL
have a disproportionately low share. The power sector scenario could improve when the expectations from the
discom reflect the situation on the ground. Madhyanchal discom, despite benefiting from housing the seat of
political power, has also come up short on performance. The drivers of issues in each of these discoms arise from
dissimilar endowments – political capital, economic progress, social norms and, most importantly, the discom’s
competency to administer the region under their control. Both state and central government agencies must
acknowledge that all discoms in UP cannot function under one efficiency improvement trajectory. The targets
under UDAY are paced much more aggressively for poorer performing discoms.
A true separation of discoms, and autonomy for each, is not on the cards. The immediate focus must firmly be
on augmenting resources for metering and delivering bills periodically and etching in the consumer’s mind that
payment is mandatory, and non-negotiable. Driving this common agenda is important, alongside the need to
provide context-specific incentives – to both consumers and discom agents. It would be important, especially in
areas with a significant new-consumer base, to conduct awareness-raising campaigns on consumers’ financial
responsibility to discoms and the implications of losses on the quality of supply. Bill-paying consumers must also
be in a position to hold the discom to account for supply quality and service levels, as envisaged in the supply
code.xviii Electricity Consumers and Compliance: Trust, Reciprocity, and Socio-economic Factors in Uttar Pradesh
Image: iStock1
1. Introduction
A rguably, the standout feature of India’s power system is the scale of annual losses – in
both energy (kWh) and financial terms (INR) – of the utilities involved in supplying elec-
tricity (discoms). The share of electricity injected into the network but not accounted for in
final billing is nominally defined as the transmission and distribution (T&D) loss. This T&D
loss comprises technical and non-technical loss incurred in the wires and through various
transformations that electricity undergoes as it reaches end consumers.1 Technical loss is
due to energy dissipated in T&D equipment. The T&D loss is higher in India than in its neigh-
bours in South Asia, Brazil, China, Russia, and South Africa (IEA, 2018) (Figure 1).
25 T&D loss (per cent) India and it's global counterparts FIGURE 1:
Electric power T&D
20 19.4% 18.9% losses (% of output)
Source: Electric power T&D
15.8% losses (% of output), IEA
15
Per cent
Statistics © OECD/IEA 2014
10 10%
8.4%
5.5%
5
0
Brazil China India Russia South South-
Africa Asia
In developing countries, the losses owing to lacunae in the electricity distribution utility’s
energy accounting – metering, billing, and collection (MBC) practices – and pilferage of
energy form a significant chunk of T&D loss. In most parts of the developed world, T&D loss
is essentially technical loss, as utilities are competitively operated; they move electricity ef-
ficiently, and they bill clients for their level of consumption. Technical and governance chal-
lenges plague the electricity distribution sector in India, and public utilities lack the capacity
and resources to monitor their vast consumer base.
Metering is poor at various points in the network – interface, distribution feeders, and end
consumers – and estimating input energy and energy billed is difficult. The measure of
1 In the case of India, the IEA data represents the difference between net generation and consumption (from
utilities and captive). In effect, it subsumes all underlying losses into the T&D component. The overall loss
figure is 20 per cent because captive consumption does not experience the same kind of losses – technical or
non-technical – that utility supply does. Many captive plants are on-site and do not traverse much of the T&D
network.2 Electricity Consumers and Compliance: Trust, Reciprocity, and Socio-economic Factors in Uttar Pradesh
aggregate technical and commercial (AT&C) loss was introduced to account for discom loss
arising from MBC inefficiencies; AT&C loss indicates the amount of electricity injected into
the distribution network but not paid for. Thus, AT&C loss is considered to be a better repre-
sentation of power theft, when understood in its broad sense, than T&D loss.
Particularly in the state of Uttar Pradesh (UP), discom loss has crippled the power sector
since the 1980s. Consumers suffer from the poor power supply and unplanned outages
The losses owing
(Balls, 2018). Public discoms in UP ranked 35–39 out of 41 discoms assessed in the Ministry
of Power’s annual rating of discoms, and last among discoms in the northern region (Care
to lacunae in
Ratings, 2018). the electricity
distribution utility’s
energy accounting
1.1 Non-technical losses – metering, billing,
and collection (MBC)
Significant energy is lost in the T&D system in India due to non-technical factors: wrong
practices – and
accounting of energy due to defective meters, errors in meter reading and in estimating un-
metered consumption of energy, false readings taken due to collusion between consumers2
pilferage of energy
and meter readers/billing agents, and pilferage of electricity by consumers in one form or the form a significant
other. Losses incurred due to these reasons are called non-technical losses. chunk of T&D loss
In India, it is difficult to accurately apportion losses to various causes. Studies and anecdotal
evidence show that discoms often mis-account losses and attribute higher consumption
to unmetered connections than in reality, thus obscuring loss figures. For instance, a case
study3 of a distribution circle in Maharashtra establishes the difficulty in determining losses
in an unmetered agricultural feeder. It highlights the utility’s practice of inflating consump-
tion by nearly 100 per cent over and above actual consumption (Feedback Ventures, 2010).
Energy accounting is all the more problematic as there is little or no data on energy input
into feeders, in locations with unmetered connections. The push for better metering technol-
ogy and smart meters, to improve data accounting, is a welcome move, but it would make
little sense if the data obtained is not utilised effectively.
Losses due to inaccuracies in metering and billing may occur due to involuntary factors, but
a key component of the discourse on electricity loss in the developing world and, in particu-
lar, in India is theft in the distribution network as understood in its most conventional sense.
Globally, electricity supply utilities lose around USD 25 billion each year owing to non-tech-
nical losses; India’s share is nearly 20 per cent (Depuru, Wang, & Devabhuktani, 2011).
The Electricity Act, 2003 (the Act) defines electricity theft mainly as hooking of wires
(katiya), meter tampering and bypassing, and usage of electricity for unauthorised purpos-
es.4 Smith (2004), on the other hand, incorporates billing irregularities and non-payment of
bills, too, in his definition. Reinforcing this definition, Jamil and Ahmad (2013) sum up theft
2 In this study, ‘consumers’ refers to household (or domestic) consumers, unless otherwise specified.
3 The Maharashtra Electricity Regulatory Commission appointed Feedback Ventures as a third-party evaluator
to estimate technical and commercial losses within Solapur district in Maharashtra and identify and estimate
the factors contributing to losses. An important part of the assignment was the estimation of energy supplied
to unmetered agricultural consumers.
4 Section 135 of Electricity Act, 2003 defines theft as: Whoever, dishonestly,
(a) taps, makes or causes to be made any connection with overhead, underground or under water lines or
cables, or service wires, or service facilities of a licensee or supplier as the case may be; or
(b) tampers a meter, installs or uses a tampered meter, current reversing transformer, loop connection or
any other device or method which interferes with accurate or proper registration, calibration or metering
of electric current or otherwise results in a manner whereby electricity is stolen or wasted; or
(c) damages or destroys an electric meter, apparatus, equipment, or wire or causes or allows any of them to
be so damaged or destroyed as to interfere with the proper or accurate metering of electricity, or
(d) uses electricity through a tampered meter; or
(e) uses electricity for the purpose other than for which the usage of electricity was authorised ….Introduction 3
in three Rs: improper recording of electricity, due to illegal abstraction through hooking of
wires and meter tampering; inaccurate reporting of electricity consumption due to collusion
between employees and consumers; and low recovery, due to non-payment of bills by con-
sumers. These activities are not all voluntary in nature –or wilful acts of commission on the
part of the consumer or discom – but they all contribute to the discom’s energy and revenue
loss.
Electricity loss not attributable to technical reasons may be classified into hard theft and
MBC loss. ‘Hard theft’ refers to theft as defined under Section 135 of the Act, which entails
theft due to hooking of wires (katiya), meter tampering, unauthorised electricity usage, and
wilful acts of misrepresenting electricity consumption; MBC losses refer to losses arising
from lax operational diligence of the discom or the consumer’s lack of awareness, which
precipitates consumer indifference or alienates them, and are outside the wilful actions
mentioned under Section 135 of the Act. Metering, billing, and collection losses are a subtle
form of theft, which include inter alia losses due to incorrect recording or wrong accounting
of energy consumption at the discom’s end, billing irregularities, non-payment of outstand-
ing amounts by consumers as per bills, and non-timely payments by consumers.
Electricity utilities mis-account energy consumption by unmetered consumers to mask inef-
ficiencies and their inability to operate in a financially prudent manner (Swain and Charnoz,
2012). Discoms need to institute stringent metering and billing practices; mis-accounting lets
them put it off. Non-timely payment of bills results in debtor days, which affect the discom’s
collection rate and adds to their operational burden. Consumers and discom officials are
culpable in both hard and soft theft.
Activities defined as ‘Hard Theft’ - wilful acts Activities resulting in metering, billing, and TABLE 1:
collection losses Classification of
non-technical losses
Hooking of wires Lack of metering or appropriate recording of
consumption Source: CEEW analysis
Tampering and bypassing of meter Billing irregularities
Damaging meter and other electricity appara- Non-receipt of bills by consumers
tus and wilful misrepresentation of consump-
tion
Using electricity for unauthorised purposes Non-payment, partial payment, or irregular
payment of bills
1.2 The case of Uttar Pradesh
Uttar Pradesh has the largest population, the largest number of households added under the Electricity
Saubhagya scheme, and the highest commitment to reforms under the Ujwal Discom Assur-
utilities in UP ran
ance Yojana (UDAY); and, therefore, the greatest need to address discom losses. Electricity
utilities in UP ran up approximately INR 30,000 crores in losses in FY 2015–16, the largest in up approximately
any state (PFC India, 2017). That figure is 75 per cent of the state’s power purchase cost for INR 30,000
that year (PFC India, 2017; UPERC, 2015). The multi-year tariff order for the period 2017–2020 crores in losses
had a loss target of 11.96 per cent for the terminal year of the order, and this is more aggres-
sive than what Uttar Pradesh had committed to in the UDAY MoU (14.86 per cent) (Ministry
in FY 2015–16,
of Power, 2016; UPERC, 2017, p. 162). However, the state’s AT&C losses stood at 33.08 per cent the largest in any
(as of December 2018), which accentuates the socio-economic realities peculiar to the state, state4 Electricity Consumers and Compliance: Trust, Reciprocity, and Socio-economic Factors in Uttar Pradesh
within which its electricity distribution sector operates, and suggests that the state faces
challenges in delivering on past promises (Ministry of Power2018).
The Uttar Pradesh Power Corporation Limited (UPPCL) manages power procurement and
bulk sales in the state. Its data shows that by the end of the first six months of FY 2018–19,
the cash gap of UP discoms was INR 8,000 crores. Almost 6.15 lakh urban consumers each
had billing arrears above INR 10,000 during the period. Rural consumers number 163 lakh,
but only 115 lakh are metered. Only 32.58 lakh rural metered consumers were issued bills,
By the end of the
and 33.6 lakh rural consumers (or 20.60 per cent of the total consumer base) had paid their
bills by the end of six months (UPPCL, 2018). The deterioration in coverage from metering to
first six months
collection is stark. Inefficiencies in MBC practices drive this quantum of ‘soft theft’. of FY 2018–19,
the cash gap of
CEEW’s ACCESS Survey (2018) highlighted that 37 per cent of rural households in UP re-
UP discoms was
ported that hard theft was prevalent in their villages, and that 94 per cent of respondents
were aware that it is illegal (Jain, et al., 2018). In the first round of the ACCESS Survey (2015), INR 8,000 crores
46 per cent of rural households felt that theft was prevalent in their village (Jain, et al., 2015).
This drop in the perception of theft suggests progress in limiting unlawful consumption.
In their commentary on power theft (as understood in the Act) and losses in UP, Golden and
Min (2012) highlight that unsanctioned connections (katiya) to the grid constitute the way
most of the electricity is stolen in the state. These connections are easily detached when
discom engineers or bill agents arrive. In some cases, employees and consumers (or non-
consumers) act in collusion, and users stay illegally connected to the grid indefinitely. The
Hindi documentary Katiyabaaz (2014) focuses on how a katiya-man, or the person facilitat-
ing katiya connections, becomes a Robin Hood-like figure for the masses – enabling the
poor and needy to consume electricity at will, at the cost of the state and the utility, which is
shown to be not concerned with the plight of those needing electricity when they want it.
A common practice for consumers who indulge in metering fraud is to make facilitation
payments to meter readers for reporting less than the actual reading. Meter tampering or
bypassing is another common practice, wherein users use more electricity than they pay for
(Golden and Min 2012). The level of metering is low in rural areas, and meter bypassing is a
smaller issue to contend with. Even when bills are sent to consumers, they are sometimes
not paid, and discom revenues are affected. There are several reasons – not always related
to corruption on the part of discom employees – for non-payment; one is inconvenience. In
rural parts of UP, if consumers want to pay their bill, they need to travel a long distance to
the discom office or a faciliation centre (Golden and Min 2012).
Hard theft is quite prevalent, but since there is no clear documentation of the scale of the
issue, it has become the go-to straw man for explaining the abnormal levels of loss faced
by UP discoms. Theft may be prevalent, but it is only one driver of loss, and other drivers of If discoms are
discom losses must be ascribed due importance before theft is addressed. If discoms are held
accountable, and they improve their MBC practices, attempts to access electricity illegally
held accountable,
should automatically go down. and they
improve their
MBC practices,
1.3 Non-technical losses and associated attempts to
impacts access electricity
Non-technical losses – driven by hard theft or MBC losses – cost discoms energy or revenue
illegally should
and impair discoms from providing reliable and adequate supply even to honest consumers. automatically go
The already overloaded existing distribution infrastructure experiences high technical losses downIntroduction 5
and interruptions, which in itself undermines the quality of service provided. It affects the
overall productivity of assets and deters much needed investments.
Hard theft of electricity creates a vicious spiral where poor investments and poor returns
reinforce each other to drive the system into the ground (Gaur and Gupta, 2016). If the under-
standing of current patterns of electricity consumption is poor, projections of demand will be
incorrect; and poor demand projections drive sub-optimal procurement practices and force
discoms to resort to unscheduled power outages at peak periods. The unpredictable amount
of additional load also imposes uncertainties on the generation assets that are requisitioned
by the discom.
In a regulated return environment, discoms pass on a significant portion of the losses to con-
sumers as tariffs. Discoms borrow to tide over the rest of the losses, and pass the interest on
borrowings to tariff-paying consumers. Every consumer, sanctioned or otherwise, pays taxes
indirectly to the system, and they pay for government bailout schemes – such as Financial
Restructuring Plan 1 and 2 and UDAY – to turn discoms around.
1.4 Drivers of compliance and theft
Every electricity system has distinct characteristics. These characteristics are linked to the
socio-economic realm within which the system operates, and these need to be understood
to address the problem of theft (Smith, 2004). Factors such as corruption levels, human
development indicators, income, religion and caste dynamics, and tariff interact with one
another in various ways and manifest themselves in different forms of theft (Saini, 2017). For
instance, billing disputes constitute a significant issue as evinced in the petitions filed in
the consumer grievance redressal forums, and this is an issue that discoms need to address
urgently. Consumer behaviour is affected by (inter alia) social and economic determinants
such as purchasing power, corruption, trust in the utility, and trust in society.
1.4.1 Purchasing power
Uttar Pradesh, with a population of more than 200 million, has one of the lowest per capita
incomes in the country (Census, 2011; MOSPI, 2017). The per capita energy consumption in
UP is 524 kWh, against the all India average of 1,075 kWh (Ministry of Power, 2017). The rural
household electrification level was 65 per cent for the state as on 6 June 2018; this figure is
the third lowest in India (Ministry of Power, 2018).5 Of all the rural households in UP that are
not connected to the electricity grid, 46 per cent have no interest in applying for new connec- Of all the rural
tions (Jain, et al., 2018). In a few districts, un-electrified households using kerosene as their households in
primary source of lighting were of the view that grid electricity is expensive, even though
UP that are not
they were spending as much on kerosene.
connected to the
The Ministry of Power introduced the universal household electrification programme, Saub- electricity grid,
hagya, in September 2017. Under the Saubhagya scheme, willing and poor households were 46 per cent have
to be given free connections, and other households could avail a connection for a nominal
no interest in
payment in monthly instalments. This provision should have resolved the challenges associ-
ated to high upfront cost, but the perception that recurring costs will be high and supply applying for new
unreliable still persist. connections
5 Though electrification rates have subsequently increased, on account of the Saubhagya programme.6 Electricity Consumers and Compliance: Trust, Reciprocity, and Socio-economic Factors in Uttar Pradesh
ACCESS 2018 highlighted that at least 40 per cent of the electrified households (Jain, et al.,
2018) were not paying for the electricity they consumed, up from 27 per cent in 2015 (Jain,
et al., 2015). That payment rates have dropped further, and exacerbated discoms’ financial
woes, is at least partly because many households cannot afford to pay.
1.4.2 Corruption
The level of electricity theft correlates with governance indicators; theft is higher in geogra-
phies with ineffective accountability, political instability, low government effectiveness, and
high corruption (Smith, 2004). India was ranked 81 out of 180 countries and territories in the
Global Corruption Index (GCI), 2017 by Transparency International, based on the perceived
levels of public sector corruption (Transparency International, 2018). Interestingly, out of
the total GCI 2017 survey respondents in UP, about 21 per cent said that corruption levels
had reduced in the state in comparison to the previous year. In another study, 59 per cent of
residents in UP admitted to have paid facilitation payments/bribes to get their work done,
out of which 38 per cent gave bribes (directly or indirectly) once or twice and 21 per cent gave
bribes (directly or indirectly) several times (Transparency International India, Local Circles,
2018).
Electricity is a source of considerable rent-seeking for discom employees (Jamil and Ahmad,
2013). The agent (discom employee) is constrained by the ability of the principal (discom, as
an institution) to set rules for them to function and closely monitor them. Generally, rules
allow employees some discretion, since thorough monitoring is exorbitant. The extent of im-
precision in the implementation of rules, and the cost of monitoring the employees in a util-
ity, may determine the level of corruption and, thus, the level of power theft in the system.
Adding the opportunity cost element to the theory, Jamil and Ahmad (2013) state that theft
occurs if its perceived cost is less than the subjective gains. A consumer can steal electricity
by bribing either the discom employee or the meter reader; whether they will depends on the
cost and benefit of doing so. Similarly, for a discom employee, the perceived cost of colluding
with a consumer could be the fine imposed in case of apprehension or job dismissal.
1.4.3 Trust in the utility
Power theft originates from distrust between utility and consumers, high tariff rate, and
consumers’ unwillingness to pay for the service (Never, 2015). People’s degree of compliance
with the law depends upon their perception of the utility, their evaluation of co-inhabitants,
In the consumer–
and their wider concerns (Winther, 2012). In the consumer–utility relationship, consum-
ers should be seen not merely as passive recipients of electricity but as agents interacting utility relationship,
continually with technologies (such as meters) and actors (such as bill agents and meter consumers should
readers). Consumer compliance is determined by their constant interaction with discom be seen not
infrastructure, officials, and agents and by the view consumers take of their attitude.
merely as passive
Power theft creates a vicious theft–loss spiral. Theft impairs discoms’ ability to supply elec- recipients of
tricity reliably to consumers, increases honest consumers’ dissatisfaction, and negatively electricity but as
impacts willingness to pay for the service. The panel data set in the ACCESS study from 2015 agents interacting
and 2018 provides some evidence. Median supply hours for rural electrified households
increased from 8 hours per day in 2015 to 12 hours per day in 2018; however, about two-thirds
continually with
of all households receive only three hours of supply between sunset and midnight, almost technologies and
36 per cent of electrified rural households were dissatisfied with their electricity supply, and actorsIntroduction 7 about 76 per cent of them complained also about frequent voltage fluctuations that led either to sub-optimal use or damage of appliances (Jain, et al., 2018). As per the UP’s 24X7 Power for All Roadmap document, the state government and discoms had committed 24 hours of electricity in all supply areas by October 2018 (Ministry of Power, 2017), but they have not met their commitment. The UPERC’s Tariff Order for FY 2017–18 states that the projections for discoms’ annual expense for FY 2018–19 will consider 24 hours of supply, and consumer tariff shall be determined accordingly (UPERC, 2017, p. 139), but in that case consumers are paying for 24X7 electricity while not actually receiving the service. 1.4.4 Trust in society The literature on regulatory compliance suggests that trust nurtures compliance in society. If citizens are not compelled to comply and, instead, they volunteer compliance, they choose to do the right thing, and they persuade themselves that their actions are ‘virtuously right’ (Braithwaite and Makka, 1994). The relational aspects and levels of trust between consumers and counterparts matter in determining their compliance with the law (Fjeldstad, 2004). Consumer compliance is determined by three dimensions of trust. The first two dimensions echo the earlier notions of trust in the utility to use revenues to provide expected services and to establish fair procedures for revenue enforcement and distribution of services. The third dimension is the trust consumers have in other citizens (their peers, so to say) to pay their share of the service charge. Consumers might not comply if they do not find others complying. The discoms’ performance on the second dimension of trust can be inferred from the ACCESS study findings on metering and billing status of households in rural UP. Less than 15 per cent of the grid-connected households had meters installed (Jain, et al., 2018); at least 25 per cent of electrified households, metered and unmetered, were not paying their electricity bill; and 25 per cent of metered households were receiving fixed bills, as opposed to variable bills based on their electricity consumption. This could be because the meters are not working, or discoms were not reading them regularly; operational inefficiencies lead to MBC losses for discoms and affect their consumers’ trust. ACCESS 2018 findings on the third dimension of trust suggest 37 per cent of rural households held that theft is prevalent in their village; 85 per cent of unmetered rural households and 25 per cent of total connected households do not make any payments to the utility for their consumption (Jain, et al., 2018). This perpetuates the social norm that it is acceptable for consumers not to pay for utility services and that non-payment has no consequences. This implicit social norm is a manifestation of path dependence – a concept rooted in his- torical institutionalism. The literature suggests that years of conditioning electricity users to certain attitudes, also results in power theft. The idea that electricity is one’s fundamental right, and must be provided regardless of their ability to pay for it, could further embolden people to indulge in theft. The mindset seems to be built on the impression that the lives of the poor and development opportunities for them would improve if the government makes electricity readily available to them and that, therefore, it is the government’s responsibility, not that of other consumers or service providers (Rao, 2002). Another related notion among illegal consumers is that it is dishonest to steal something from their neighbour but not from the government or the discom (Depuru, Wang, and Devabhuktani, 2011). Losses arising from electricity theft (hard and soft) constitute a contextual phenomenon; to
You can also read