Ely-Bloomenson Community Hospital
←
→
Page content transcription
If your browser does not render page correctly, please read the page content below
Ely-Bloomenson
Community Hospital
Community Health Needs Assessment, Focus Group Findings, Key
Stakeholder Interviews, and Secondary Data Analysis

January 2022

 525 South Lake Avenue, Suite 320
 Duluth, Minnesota 55802
 (218) 727-9390 | info@ruralcenter.org | www.ruralcenter.org
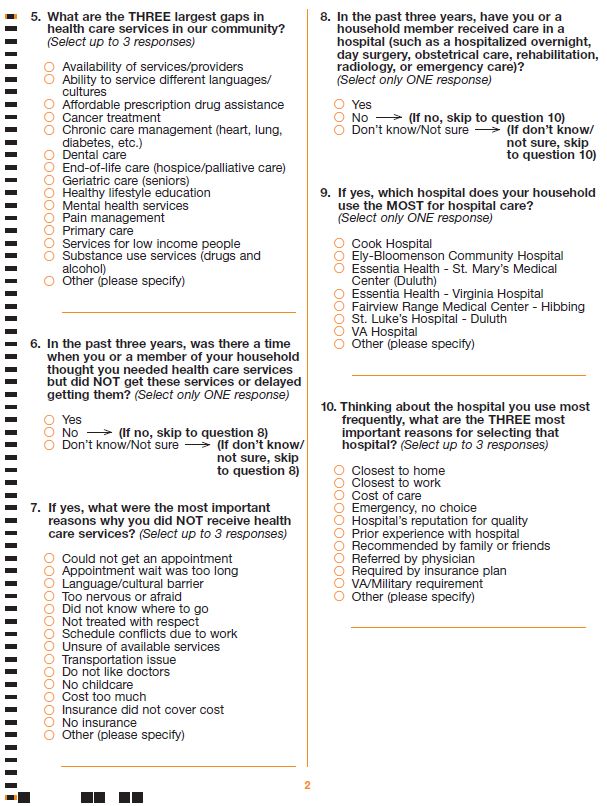
Table of Contents
Introduction ............................................................................................... 3
Survey Findings .......................................................................................... 5
Focus Group Findings ................................................................................. 29
Key Stakeholder Findings ........................................................................... 32
Conclusions, Recommendations, and Acknowledgements ................................. 35
Appendix A: Survey Instrument ................................................................... 37
Appendix B: “Other” Survey Comments ........................................................ 42
Appendix C: Secondary Data Analysis ........................................................... 50
Hospital Compare ...................................................................................... 57
Appendix D: Index of Secondary Data Indicators ............................................ 59
Appendix E: Focus Group Invitation and Questions ......................................... 69
Appendix F: Key Stakeholder Invitation and Questions .................................... 71

RURAL HEALTH INNOVATIONS                                                                                    2
Introduction
Ely-Bloomenson Community Hospital (EBCH) is a 21-bed critical
access hospital with an independent nursing home and clinic
located on the same campus in Ely, Minnesota, within St. Louis
County. EBCH participated in Community Health Needs
Assessment (CHNA) services administrated by Rural Health
Innovations (RHI), a subsidiary of the National Rural Health
Resource Center.

In the Summer of 2021, RHI conferred with leaders from EBCH to discuss the
objectives of a regional CHNA. A mailed survey instrument was developed to assess
the health care needs and preferences in the service area. The survey instrument
was designed to be easily completed by respondents. Responses were electronically
scanned to maximize accuracy. The survey was designed to assemble information
from local residents regarding:

      Demographics          Perception of community      Utilization and perception
                                     health               of local health services

Sampling
EBCH provided RHI with a count of inpatient admissions by zip code from the
previous year. Zip codes with the greatest number of admissions and utilization
were stratified in the initial sample selection. Each area would be represented in the
sampling proportionately to both the overall served population and the number of
past admissions or utilization. Eight hundred addresses representing the sample
area were selected randomly from PrimeNet Data Source, a marketing organization.
Although the survey samples were proportionately selected, actual surveys
returned from each population area varied. This may result in slightly less
proportional results.

Survey Implementation
In November 2021, the CHNA, a cover letter on EBCH’s letterhead, and a postage
paid reply envelope were mailed first class to 800 randomly selected residents in
the targeted region (seven zip codes). EBCH announced the CHNA survey in a press

RURAL HEALTH INNOVATIONS                                                              3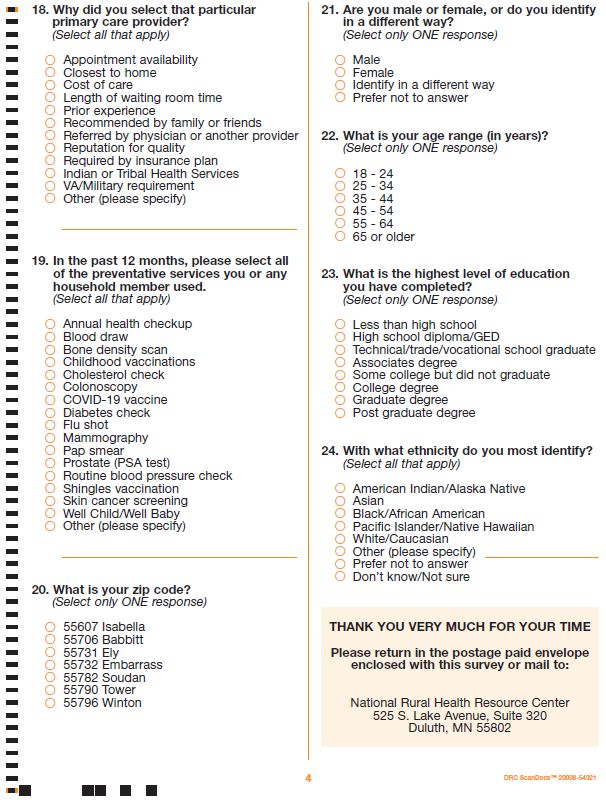
release in the Ely Echo and the Timberjay newspapers the week of October 25,
2021. The information ran in the Timberjay on October 29, 2021, and the Ely Echo
on October 30, 2021. EBCH also promoted the survey on social media and the local
radio station WELY.

Two hundred fifteen (215) mailed surveys were returned, providing a 29.7%
response rate. Based on the sample size, surveyors are 95% confident that the
responses are representative of the service area population, with a margin of error
of 5.61. Note that 76 of the original 800 surveys sent was returned by the U.S.
Postal Service as undeliverable. A copy of the survey instrument is included in
Appendix A.

                                                     Completed         Response
       Year       Number Sent      Undeliverable
                                                      Surveys            Rate

       2021            800               76              215             29.7%

       2018            800               73              197              27%

       2015            800               45              320              42%

A secondary data analysis and a series of focus group and key stakeholder
interviews were also conducted to add information to the CHNA findings.
Methodology and findings of the focus groups, key stakeholder interviews, and
secondary data are discussed later in the report.

Report findings may be used for:
   ◼   Developing and implementing plans to address key issues as required by the
       Patient Protection and Affordable Care Act §9007 for 501(c)3 charitable
       hospitals
   ◼   Promoting collaboration and partnerships within the community or region
   ◼   Supporting community-based strategic planning
   ◼   Writing grants to support the community’s engagement with local health care
       services
   ◼   Educating groups about emerging issues and community priorities
   ◼   Supporting community advocacy or policy development

RURAL HEALTH INNOVATIONS                                                              4
Survey Findings
In the following tables and graphs, the question asked on the mailed survey is
emboldened and the question number from the mailed survey is appropriately
labeled, for example as “Q4”. The number of respondents per question is also noted
since not all respondents answered every question. On certain questions, each of
the 215 respondents could select more than one answer, so the percentages do not
total to 100%. Comparative data is included for 2018 and 2015.

Demographics
Q20: What is your zip code? (Select only ONE response) A majority (74%) of
respondents live in Ely. (N=215)

     Zip Code         n=       2021      2018      2015

 55731 Ely            159      74%        57%       72%

 55706 Babbitt        34        17%       25%       17%

 55782 Soudan          8        4%        6%        2%

 55790 Tower           6        3%        5%        5%

 55607 Isabella        2        1%        2%        1%

 55796 Winton          2        1%        5%        2%

 55732 Embarrass       1        0%        N/A       N/A

RURAL HEALTH INNOVATIONS                                                         5
Q21: Are you male or female, or do you identify in a different way? (Select
only ONE response) Sixty-one percent of survey respondents were female and
35% male. This is a higher representation of females compared to secondary data.
(n=214)
Gender n= 2021 2018 2015
Female 131 61% 53% 62%
Male 75 35% 44% 35%
Prefer not to answer 7 3% N/A N/A
Identify in a different way 1 1% N/A N/A
SECONDARY DATA: GENDER
St. Louis 50.1% 49.9%
Lake 51.4% 48.6%
Itasca 50.6% 49.4%
MN 49.8% 50.2%
US 49.2% 50.8%
0% 20% 40% 60% 80% 100%
Male Female
RURAL HEALTH INNOVATIONS 6Q24: With what ethnicity do you most identify? (Select all that apply)
Ninety-five percent of survey respondents indicated they are White/Caucasian. This
is comparable to secondary data. (N=215)
Ethnicity n= 2021
White/Caucasian 204 95%
Prefer not to answer 7 3%
American Indian/Alaska Native 4 2%
Other (please specify) 2 1%
Don’t know/Not sure 1 0%
Pacific Islander/Native Hawaiian 0 0%
Black/African American 0 0%
Asian 0 0%
SECONDARY DATA: POPULATION BY RACE AND
ETHNICITY
100%
80%
60%
40%
20%
0%
American Native
Some
Indian/ Hawaiian/ Multiple
White Black Asian Other
Alaska Pacific Races
Race
Native Islander
St. Louis 92.1% 1.6% 1% 1.8% 0% 0.5% 3%
Lake 96.9% 0.6% 0.1% 0.9% 0% 0.1% 1.2%
Itasca 92.8% 0.5% 0.4% 3.7% 0% 0.2% 2.4%
MN 82.8% 6.4% 4.8% 1% 0% 1.9% 3%
US 72.5% 12.7% 5.5% 0.8% 0.2% 5.5% 3.3%
RURAL HEALTH INNOVATIONS 7Q22: What is your age range (in years)? (Select only ONE response) Fifty-
nine percent of survey respondents were 65 years or older. This age range is
followed by 55-64 at 24%. Secondary data indicates that both age ranges have a
higher percentage for the community than MN or US. Secondary data indicates that
the 55-64 age range has the highest percentage of all age ranges for the
community. (N=215)
Age n= 2021 Age 2018 2015
18-24 1 1% 18-25 0% 0%
25-34 9 4% 26-35 5% 3%
35-44 16 7% 36-45 7% 5%
45-54 11 5% 46-55 9% 10%
55-64 52 24% 56-65 23% 24%
65 or older 126 59% 66-75 30% 34%
76-85 18% 17%
86 or older 6% 5%
SECONDARY DATA: POPULATION BY AGE
20%
18%
16%
14%
12%
10%
8%
6%
4%
2%
0%
Under
5 5-9 10-14 15-19 20-24 25-34 35-44 45-54 55-64 65-74 75-84 85+
years
St. Louis 5.1% 5% 5.8% 6.9% 9% 11.5% 11.1% 11.7% 15.1% 10.8% 5.5% 2.6%
Lake 4.6% 5.2% 5% 4.6% 4.1% 9.6% 10.8% 13% 18% 13.8% 8.4% 3.6%
Itasca 5.3% 6.3% 5.6% 6% 4.7% 9.6% 11.1% 12.3% 16.6% 13.1% 6.7% 2.9%
MN 6.3% 6.5% 6.6% 6.4% 6.4% 13.6% 12.5% 12.7% 13.4% 8.8% 4.6% 2.1%
US 6.1% 6.2% 6.4% 6.5% 6.8% 13.9% 12.6% 13% 12.9% 9.1% 4.6% 1.9%
RURAL HEALTH INNOVATIONS 8Q23: What is the highest level of education you have completed? (Select
only ONE response) Twenty-seven percent of respondents have a college degree
and an additional 31% report a graduate or post graduate degree. Education level
for survey respondents is higher than what is found in secondary data which
indicates the highest percentage for the three counties report high school degree.
(N=215)
Level of Education n= 2021
Less than high school 5 2%
High school diploma/GED 28 13%
Technical/trade/vocational school graduate 25 12%
Associates degree 25 12%
Some college but did not graduate 29 13%
College degree 59 27%
Graduate degree 34 16%
Post graduate degree 10 15%
SECONDARY DATA: LEVEL OF EDUCATION
40%
30%
20%
10%
0%
High School
9th to 12th Some
Less than Degree Associates Bachelor's Graduate
grade, no college, no
9th grade (includes Degree Degree Degree
diploma degree
equivalency)
St. Louis 1.4% 4.1% 27.2% 24.9% 13.1% 19.2% 10.1%
Lake 0.9% 4.4% 30.9% 21.6% 13.3% 19.6% 9.2%
Itasca 1.3% 4.7% 30% 26.8% 14.1% 15.8% 7.2%
MN 2.9% 4% 24.6% 21% 11.5% 23.7% 12.4%
US 5.1% 6.9% 27% 20.4% 8.5% 19.8% 12.4%
RURAL HEALTH INNOVATIONS 9SECONDARY DATA:
UNEMPLOYMENT RATE
10%
9% All counties have lower
8%
median household income
7%
6% 5.4% than MN or US.
5% 4.1% Unemployment rates are
3.7% 3.4%
4% 3.3%
lower than US.
3%
2%
1%
0%
St. Louis Lake Itasca MN US
SECONDARY DATA:
INDIVIDUALS BELOW THE
POVERTY LEVEL
25%
St. Louis and Itasca have
20% higher rates of those living
15%
14.1% 13.4% below the poverty level as
12.2%
9.7% compared to MN.
10% 8.7%
5%
0%
St. Louis Lake Itasca MN US
SECONDARY DATA: CHILDREN
IN POVERTY
25%
The same trend is seen for
20% 18.5%
children living in poverty as
15.9%
14.5% compared to MN although
15% 12.2%
12.1%
the rates are lower as
10% compared to the US.
5%
0%
St. Louis Lake Itasca MN US
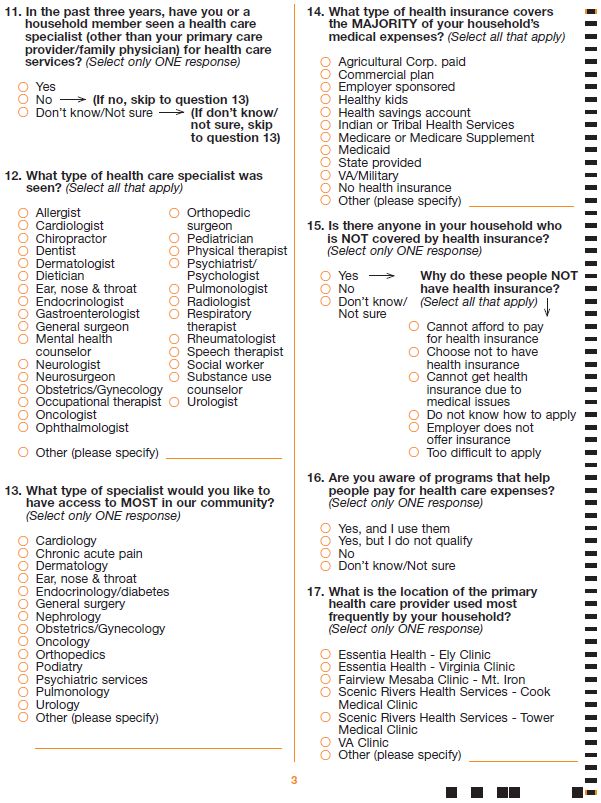
RURAL HEALTH INNOVATIONS 10Health Insurance
Q14: What type of health insurance covers the MAJORITY of your
household’s medical expenses? (Select all that apply) Almost all survey
respondents indicate that they do have insurance, whether Medicare, employer, or
state sponsored. One percent indicated no insurance. Respondents were asked to
select all that apply, so the total does not equal 100 percent. (N=215)
Health Insurance n= 2021
Medicare or Medicare Supplement 120 56%
Employer sponsored 67 31%
State provided 20 9%
VA/Military 18 8%
Commercial plan 17 8%
Other (please specify) 17 8%
Medicaid 13 6%
Health savings account 7 3%
No health insurance 3 1%
Indian or Tribal Health Services 1 0%
Agricultural Corp. paid 1 0%
Healthy kids 0 0%
RURAL HEALTH INNOVATIONS 11Q15: Is there anyone in your household who is NOT covered by health
insurance? (Select only ONE response) Ninety-seven percent of survey
respondents indicate that there is no one in their household not covered by
insurance. Three percent indicated there is someone in the household not covered.
This percentage is slightly better than secondary data. (n=214)
Response n= 2021
No 208 97%
Yes 6 3%
Don’t know/Not sure 0 0%
SECONDARY DATA: SECONDARY DATA:
POPULATION UNDER AGE POPULATION UNDER AGE
65 WITHOUT HEALTH 18 WITHOUT HEALTH
INSURANCE INSURANCE
20% 20%
15% 15%
10.8%
10% 7% 10%
5.2% 5.3% 5.8% 5.6%
3.4% 4.4%
5% 5% 2.8% 3.1%
0% 0%
St. Lake Itasca MN US St. Lake Itasca MN US
Louis Louis
If yes, why do these people NOT have health insurance? (Select all that
apply) Of the 3% (n=6) that do not have health insurance, 83% (n=5) indicate
that they cannot afford insurance. Respondents were asked to select all that apply,
so the total does not equal 100 percent.
Reason Why n= 2021
Cannot afford to pay for health insurance 5 83%
Employer does not offer insurance 1 17%
Too difficult to apply 1 17%
RURAL HEALTH INNOVATIONS 12Reason Why n= 2021
Do not know how to apply 0 0%
Cannot get health insurance due to medical issues 0 0%
Choose not to have health insurance 0 0%
Awareness of Programs that Help Pay for Health
Care Expenses
Q16: Are you aware of programs that help people pay for health care
expenses? (Select only ONE response) Thirty-nine percent indicate they are
aware of programs that help people pay for health care expenses, but they do not
qualify. Twenty-seven percent of respondents report that they are not aware.
(n=211)
Awareness n= 2021
Yes, but I do not qualify 83 39%
No 56 27%
Don’t know/Not sure 40 19%
Yes, and I use them 32 15%
Community’s Greatest Strengths
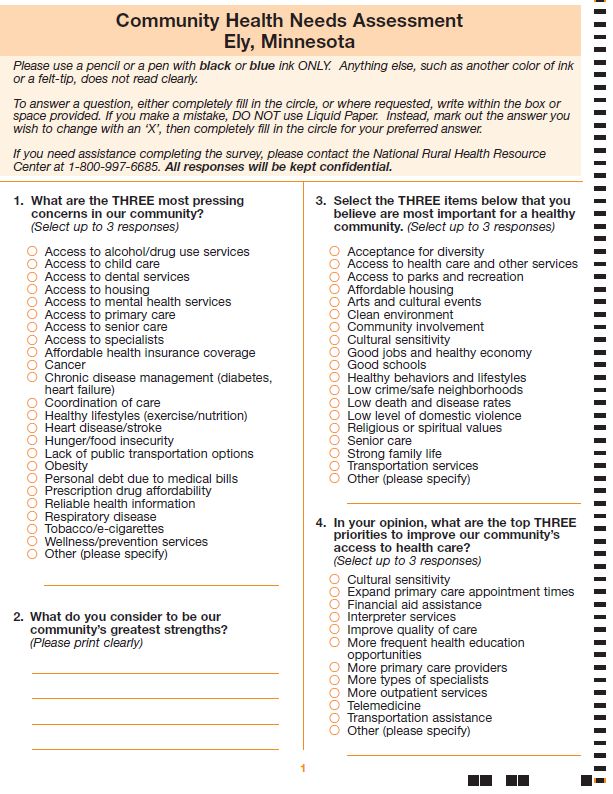
Q2: What do you consider to be our community’s greatest strengths?
(Please print clearly) This was an open-ended question where respondents were
able to write in any answer they wanted. The top three answers are listed below.
See the full list of answers in Appendix B.
People helping Hospital (33) Sense of community/small
people/caring/friendly (41) town feel (28)
RURAL HEALTH INNOVATIONS 13Criteria for a Healthy Community
Q3: Select the THREE items below that you believe are the most important
for a healthy community. (Select up to 3 responses) Fifty-six percent of
survey respondents identify good jobs and healthy economy as the most important
criteria for a healthy community. This was followed by access to health care and
other services (51%). Respondents were asked to select up to 3 responses, so the
total does not equal 100 percent. (N=215)
Item n= 2021
Good jobs and healthy economy 120 56%
Access to health care and other services 109 51%
Good schools 68 32%
Low crime/safe neighborhoods 58 27%
Affordable housing 49 23%
Clean environment 40 19%
Acceptance for diversity 34 16%
Strong family life 33 15%
Community involvement 25 12%
Senior care 24 11%
Religious or spiritual values 23 11%
Healthy behaviors and lifestyles 22 10%
Access to parks and recreation 15 7%
Transportation services 7 3%
Cultural sensitivity 6 3%
Arts and cultural events 6 3%
RURAL HEALTH INNOVATIONS 14Item n= 2021
Low level of domestic violence 5 2%
Low death and disease rates 4 2%
Other (please specify) 3 1%
Pressing Health Concerns
Q1: What are the THREE most pressing health concerns in the community?
(Select up to 3 responses) Access to dental services (53%) is the most pressing
health concern identified. This was followed by access to childcare (34%) and
access to specialists (26%). Respondents were asked to select up to 3 responses,
so the total does not equal 100 percent. (N=215)
Pressing Health Concern n= 2021
Access to dental services 114 53%
Access to childcare 72 34%
Access to specialists 56 26%
Affordable health insurance coverage 53 25%
Access to mental health services 45 21%
Prescription drug affordability 35 16%
Access to housing 31 14%
Lack of public transportation options 29 14%
Chronic disease management (diabetes, heart failure) 20 9%
Access to primary care 19 9%
Access to senior care 17 8%
Coordination of care 16 7%
RURAL HEALTH INNOVATIONS 15Pressing Health Concern n= 2021 Access to alcohol/drug use services 15 7% Healthy lifestyles (exercise/nutrition) 14 6% Obesity 13 6% Personal debt due to medical bills 12 6% Cancer 11 5% Other (please specify) 11 5% Hunger/food insecurity 8 4% Heart disease/stroke 8 4% Wellness/prevention services 8 4% Reliable health information 7 3% Respiratory disease 5 2% Tobacco/e-cigarettes 1 0% Gaps in Health Care Services Q5: What are the THREE largest gaps in health care services in our community? (Select up to 3 responses) The top three gaps in health care services included dental care (70%), availability of services/providers (33%), and mental health services (32%). The need for more mental health services was the number one gap identified in 2018 (45%) followed by availability of services/providers (44%). Respondents were asked to select up to 3 responses, so the total does not equal 100 percent. (N=215). The secondary data reveals that there is a concerning ratio for behavioral health providers in Lake County (1,330:1). This is approximately triple the number of residents for each provider as compared to St. Louis and Itasca counties, MN, and US. Because of the impact of Duluth on St. Louis County numbers, the ratio for that county could be worse than the data indicates. The need for behavioral health RURAL HEALTH INNOVATIONS 16
services was the number one priority in the focus groups and key stakeholder
interviews.

This is the first-time dental care emerged as the primary gap. This was also
identified in the focus group as a gap and need. Secondary data also revealed a
ratio of residents to dentists in Lake County (2,130:1) that is much worse than the
other counties, MN, or US. Attendees of the focus groups suggested the same issue
is true for St. Louis County although the secondary data does not reveal that
because most of the dentists in that county are in Duluth. They state that the
situation in the rest of the county is very different.

Availability of services/providers is the number two gap identified in 2021 (33%).
This was the second identified gap in 2018 as well (44%). Secondary data indicates
that the ratios of providers to residents is similar for Lake and Itasca counties as
compared to MN and US. St. Louis County has a much better ratio.

                            Gap                          n=       2021       2018

 Dental care                                             151      70%        N/A

 Availability of services/providers                      71       33%        44%

 Mental health services                                  69       32%        45%

 Affordable prescription drug assistance                 45        21%       15%

 Chronic care management (heart, lung, diabetes, etc.)   34        16%       N/A

 Substance use services (drugs and alcohol)              34        16%       23%

 Cancer treatment                                        33        15%       N/A

 Primary care                                            30        14%       18%

 Pain management                                         20        9%        23%

 Geriatric care (seniors)                                20        9%        23%

 Healthy lifestyle education                             19        9%        N/A

 Services for low-income people                          19        9%        18%

RURAL HEALTH INNOVATIONS                                                            17
Gap n= 2021 2018
End-of-life care (hospice/palliative care) 12 6% 12%
Other (please specify) 4 2% 13%
Ability to service different languages/cultures 2 1% N/A
SECONDARY DATA
ACCESS TO DENTISTS ACCESS TO PRIMARY ACCESS TO MENTAL
CARE PHYSICIANS HEALTH PROVIDERS
St. Louis – 1,090:1 St. Louis – 780:1 St. Louis – 360:1
Lake – 2,130:1 Lake – 1,180:1 Lake – 1,330:1
Itasca – 1,410:1 Itasca – 1,100:1 Itasca – 370:1
MN – 1,340:1 MN – 1,120:1 MN – 370:1
US – 1,400:1 US – 1,320:1 US – 380:1
Priorities to Improve Community Access to Health
Care
Q4: In your opinion, what are the top THREE priorities to improve our
community’s access to health care? (Select up to 3 responses) Survey
respondents identified more types of specialists as the number one priority (53%).
This is followed by more primary care providers (38%). These were the two
priorities identified in 2018 as well. More outpatient services were the third priority
for 2021 (34%). Respondents were asked to select up to 3 responses, so the total
does not equal 100 percent. (N=215)
Priority n= 2021 2018
More types of specialists 114 53% 61%
More primary care providers 82 38% 37%
More outpatient services 74 34% N/A
RURAL HEALTH INNOVATIONS 18Priority n= 2021 2018
Expand primary care appointment times 56 26% 26%
Improve quality of care 54 25% 17%
Transportation assistance 49 23% 29%
Financial aid assistance 42 20% N/A
More frequent health education opportunities 31 14% 17%
Other (please specify) 21 10% 10%
Cultural sensitivity 17 8% N/A
Telemedicine 16 7% 16%
Interpreter services 3 1% N/A
Preventive Services
Q19: In the past 12 months, please select all of the preventive services you
or any household member used. (Select all that apply) The most utilized
preventive service was COVID-19 vaccine (85%) followed by flu shot (77%) and
annual health checkup and blood draw, both at 69%. Respondents were asked to
select all that apply, so the total does not equal 100 percent. (N=215)
Preventive Service n= 2021
COVID-19 vaccine 182 85%
Flu shot 166 77%
Blood draw 149 69%
Annual health checkup 149 69%
Routine blood pressure check 113 53%
Mammography 93 43%
RURAL HEALTH INNOVATIONS 19Preventive Service n= 2021
Cholesterol check 87 40%
Shingles vaccination 62 29%
Colonoscopy 45 21%
Diabetes check 45 21%
Prostate (PSA test) 41 19%
Pap smear 34 16%
Skin cancer screening 26 12%
Bone density scan 23 11%
Childhood vaccinations 19 9%
Well Child/Well Baby 13 6%
Other (please specify) 11 5%
Delayed Health Care Services
Q6: In the past three years, was there a time when you or a member of
your household thought you needed health care services but did NOT get
or delayed getting them? Sixty-five percent of respondents report that they or a
household member did not delay seeking health services when needed. Thirty-three
percent report that they did delay. (N=215)
Response n= 2021
No (If no, skip to question 8) 141 65%
Yes 70 33%
Don’t know/Not sure (If don’t know/not sure, skip to question 8) 4 2%
RURAL HEALTH INNOVATIONS 20Q7: If yes, what were the most important reasons why you did NOT receive
health care services? (Select up to 3 responses) Appointment wait was too
long was the biggest reason identified (46%) This was followed by insurance did
not cover cost (26%) and could not get an appointment (24%). Respondents were
asked to select up to 3 responses, so the total does not equal 100 percent. (n=70)
Reason n= 2021
Appointment wait was too long 32 46%
Insurance did not cover cost 18 26%
Could not get an appointment 17 24%
Unsure of available services 12 17%
Other (please specify) 12 17%
Cost too much 10 14%
Schedule conflicts due to work 8 11%
Transportation issue 7 10%
Not treated with respect 5 7%
Too nervous or afraid 5 7%
No insurance 5 7%
Did not know where to go 4 6%
Do not like doctors 2 3%
No childcare 0 0%
Language/cultural barrier 0 0%
RURAL HEALTH INNOVATIONS 21Recently Received Care in a Hospital
Q8: In the past three years, have you or a household member received
care in a hospital (such as a hospitalized overnight, day surgery,
obstetrical care, rehabilitation, radiology, or emergency care)? (Select only
ONE response) Seventy-two percent of respondents answered yes. This is similar
to 2018 (70%). (N=215)
Response n= 2021 2018
Yes 154 72% 70%
No (If no, skip to question 10) 61 28% 30%
Don’t know/Not sure (If don’t know/not sure, skip to 0 0% N/A
question 10)
Q9: If yes, which hospital does your household use the MOST for hospital
care? (Select only ONE response) Ely-Bloomenson Community Hospital is the
preferred location for hospital care (56%). This is higher than 2018 (46%).
(n=154)
Hospital n= 2021 2018
Ely-Bloomenson Community Hospital 86 56% 46%
Essentia Health – St. Mary’s Medical Center (Duluth) 35 23% N/A
Essentia Health - Virginia Hospital 15 10% 8%
Other (please specify) 10 6% 13%
St. Luke’s Hospital - Duluth 6 4% N/A
Fairview Range Medical Center - Hibbing 2 1% N/A
Cook Hospital 0 0% 1%
VA Hospital 0 0% 2%
RURAL HEALTH INNOVATIONS 22Most Important Reasons for Selecting Hospital
Q10: Thinking about the hospital you use most frequently, what are the
THREE most important reasons for selecting that hospital? (Select up to 3
responses) The three top reasons for selecting a hospital included closest to home
(66%), prior experience (42%), and emergency, no choice (37%). These were the
top three answers for 2018 as well. Respondents were asked to select up to 3
responses, so the total does not equal 100 percent. (N=215)
Reason n= 2021 2018
Closest to home 143 66% 71%
Prior experience with hospital 90 42% 50%
Emergency, no choice 80 37% 38%
Hospital’s reputation for quality 73 34% 30%
Referred by physician 66 31% 35%
Required by insurance plan 33 15% 19%
Recommended by family or friends 17 8% 9%
Other (please specify) 13 6% 7%
Closest to work 9 4% N/A
Cost of care 5 2% N/A
VA/Military requirement 4 2% 3%
RURAL HEALTH INNOVATIONS 23Primary Care
Q17: What is the location of the primary health care provider used most
frequently by your household? (Select only ONE response) Essentia Health-
Ely Clinic was by far the most used location (79%). (n=214)
Location n= 2021
Essentia Health - Ely Clinic 168 79%
Other (please specify) 23 11%
Essentia Health - Virginia Clinic 10 5%
VA Clinic 5 2%
Fairview Mesaba Clinic - Mt. Iron 4 2%
Scenic Rivers Health Services - Tower Medical Clinic 3 1%
Scenic Rivers Health Services - Cook Medical Clinic 1 0%
Q18. Why did you select that particular primary care provider? (Select all
that apply) Closest to home was the number one reason that provider was
selected (73%). This was followed by prior experience (30%). Respondents were
asked to select all that apply, so the total does not equal 100 percent. (N=215)
Reason n= 2021
Closest to home 156 73%
Prior experience 65 30%
Appointment availability 44 20%
Reputation for quality 42 20%
Recommended by family or friends 27 13%
Required by insurance plan 23 11%
Other (please specify) 13 6%
RURAL HEALTH INNOVATIONS 24Reason n= 2021
Referred by physician or another provider 12 6%
Length of waiting room time 9 4%
VA/Military requirement 9 4%
Indian or Tribal Health Services 1 0%
Cost of care 0 0%
Specialty Care
Q11: In the past three years, have you or a household member seen a
health care specialist (other than your primary care provider/family
physician) for health care services? (Select only ONE response) Eighty-five
percent of respondents indicate they have seen a specialist. This is higher than
2018 (76%). (N=215)
Response n= 2021 2018
Yes 182 85% 76%
No (If no, skip to question 13) 33 15% 24%
Don’t know/Not sure (If don’t know/not sure, skip to 0 0% N/A
question 13)
Q12: What type of health care specialist was seen? (Select all that apply)
Dentist was the number one specialist seen (42%). This is lower than 2018 (73%).
Respondents were asked to select all that apply, so the total does not equal 100
percent. (n=182)
Specialist n= 2021 2018
Dentist 77 42% 73%
Orthopedic surgeon 60 33% 25%
Physical therapist 47 26% 30%
RURAL HEALTH INNOVATIONS 25Specialist n= 2021 2018 Cardiologist 38 21% 18% Ophthalmologist 30 16% 21% Radiologist 29 16% 18% Dermatologist 29 16% 12% Ear, nose & throat 24 13% 18% General surgeon 23 13% 20% Chiropractor 22 12% 14% Urologist 20 11% 10% Other (please specify) 18 10% 10% Mental health counselor 17 9% 10% Gastroenterologist 17 9% 12% Obstetrics/Gynecology 16 9% 7% Oncologist 16 9% 10% Neurologist 15 8% 14% Rheumatologist 15 8% 9% Occupational therapist 15 8% 10% Psychiatrist/Psychologist 8 4% 10% Endocrinologist 8 4% 7% Neurosurgeon 7 4% N/A Respiratory therapist 6 3% N/A Allergist 4 2% 6% RURAL HEALTH INNOVATIONS 26
Specialist           n=       2021       2018

 Pulmonologist                   4        2%       7%

 Dietician                       3        2%       4%

 Social worker                   3        2%       4%

 Pediatrician                    2        1%       4%

 Speech therapist                0        0%       2%

 Substance use counselor         0        0%       2%

Q13: What type of specialist would you like to have access to MOST in our
community? (Select only ONE response) The instruction for this question was
to select only ONE response, however several individuals selected more than one
option, which is why other (please specify) is showing up as the most popular
answer. The scanner could not read the surveys with multiple answers, so they are
recorded in Appendix B. After incorporating the surveys with multiple answers,
Cardiology is the most needed specialty identified by the community. In 2018, this
was asked as an open-ended question. Cardiology was also the top requested
specialty. (n=198)

        Specialist          n=       2021

 Other (please specify)     35       18%

 Cardiology                 29       15%

 General surgery            26       13%

 Orthopedics                18       9%

 Dermatology                16       8%

 Psychiatric services       13       7%

 Chronic acute pain         13       7%

 Endocrinology/diabetes     12       6%

RURAL HEALTH INNOVATIONS                                                        27
Specialist n= 2021 Oncology 10 5% Obstetrics/Gynecology 9 4% Ear, nose & throat 6 3% Urology 5 2% Podiatry 4 2% Pulmonology 2 1% Nephrology 0 0% RURAL HEALTH INNOVATIONS 28
Focus Group Findings
Introduction
RHI was contracted by EBCH to conduct focus group interviews to provide
qualitative data on the strengths and needs of local health care services. Focus
group comments reflect the perceptions of the individual and may differ or support
survey and secondary data findings.

Background
Four focus groups were scheduled to occur over the course of two weeks in
November and December 2021 to obtain information from community residents.
EBCH provided names, demographics, and contact information for 72 potential
attendees. RHI reached out to all 72 to invite them to participate. Attendees could
choose the focus group they preferred to attend based on their availability. Each
focus group included a mix of attendees representing their community. Attendees
included seniors, representatives from businesses, health care consumers, and
social services.

Sixteen of the 72 people signed up to attend; two did not show. Demographics of
attendees based on observation and general comments and characteristics
included:
       • Gender: males (4), females (10)
       • Estimated age: 60-70 (4), 50-59 (7), 40-49 (1), 20-39 (2)
       • Employment status: employed (9), not working/retired (5)

Secondary data was presented to attendees at the beginning of the focus groups
and included information about community population by race and ethnicity, age
range, percentage of unemployed, and percentage living in poverty. Data regarding
quality-of-life variables such as rates of diabetes, obesity, adults currently smoking,
HIV, and suicide were shared. Ratios of population to primary care providers,
dentists, and mental health providers were also presented.

Limitations
There are two major limitations that should be considered when reviewing these
results:
   1. The information is based on comments from a rather small segment of the
       community.

RURAL HEALTH INNOVATIONS                                                            29
2. Participants represented are primarily middle income and Caucasian. Some
segments of the community are not represented in these findings, specifically
those of lower socio-economic status, (i.e., unemployed, low wage
employees, etc.).
Summary of Major Focus Group Findings
Below are the common themes in responses. The number in parenthesis ( )
indicates the number of focus groups in which the item was mentioned.
1. Are you surprised about what this data reveals about your community,
or is it what you expected?
• Not surprised (3)
• The population for St. Louis County is focused on Duluth and may not
represent the rural areas (2)
2. Do you find any particular statistic surprising?
• The Dentist ratio for St. Louis County is not reflective of the county
outside of Duluth which only has one Dentist (2)
3. Are some population groups healthier than other groups? If yes, which
ones?
• Retirees have better health, good income, and are often active; they
choose to move here (4)
• Affluent community has more access to exercise, outdoor gear, and
recreation (2)
4. Are some population groups suffering more than other groups? If yes,
which ones?
• Longtime residents (4)
o Less likely to take advantage of opportunities
o Some are underperforming with few job opportunities, especially
when mining left
o Used to a certain lifestyle and less likely to change
• Economic disparities (3)
o Consolidation of grocery stores that impact cost of food and ability
to get across town - utilization of food pantry is up
o No insurance
• Those with behavioral health and substance use disorder (SUD) issues (2)
• Homebound elderly who don’t qualify for some services, don’t know about
them, or don’t have someone to set up care for them (2)
RURAL HEALTH INNOVATIONS 305. In your opinion, what are some of the barriers to accessing care in this
region?
• Transportation (4)
o Long distances to travel
o Some services were discontinued with COVID
o Inconsistent services or schedules or only provided for a specific
population such as seniors
o Liability issues
• Attitudes - isolationist, independent, don’t believe in getting mental health
help, stigma (4)
• Cost (3)
• Staffing issues (3)
o Burnout
o Not enough staff such as personal care assistants (PCAs)
6. What do you think EBCH could do to increase the health of the
community? Where are opportunities to collaborate?
• Collaborate more actively (4)
o Ministerial council
o Northern Lights Clubhouse
o Free Clinic
o Food shelf
o Community college
o Community health center
o Services such as lab
o Faith based groups
• Revisit idea of community recreational center and resume collaboration
with Y and non-profit (2)
7. What is the greatest health need in this community?
For this item, each participant had three votes they could distribute on the list of
health needs they generated.
• Behavioral health and SUD services for all age groups - this has been
impacted by COVID (13 votes)
• Improve workforce with PCAs and certified nursing assistants (11 votes)
• Dental care access as a health issue that impacts nutrition, pain, and
digestion (5 votes)
• Exercise access and quality for all age groups and mobility issues (5
votes)
RURAL HEALTH INNOVATIONS 31Key Stakeholder Findings
Introduction
RHI was contracted by EBCH to conduct key stakeholder interviews to provide
qualitative data on the strengths and needs of local health care services.
Background
Twenty-four residents were identified by the hospital to potentially participate in
key stakeholder interviews in November and December 2021. The key stakeholders
were identified based on the various consumer groups of local health services
including senior citizens, young parents, health care providers, and community
leaders. Invitations were emailed with the key stakeholder questions attached or a
call was made to invite by phone.
Six people agreed to participate. In total, three men and three women participated.
Each virtual meeting session was approximately 50 minutes in length and included
a review of the secondary data at the beginning. Each key stakeholder was asked
the same questions.
Limitations
There are three major limitations that should be considered when reviewing these
results:
1. The information is based on comments from a small segment of the
community.
2. Participants were professional or retired, middle-income, and Caucasian.
Some segments of the community are not represented in the findings,
specifically those with lower socioeconomic status, (i.e., employed in non-
professional jobs and not employed) and young adults ages 18-35.
3. Participants were chosen as key stakeholders by EBCH, which could introduce
selection bias.
Summary of Major Points
Below are the common themes in responses.
1. Are you surprised about what this data reveals about your community,
or is it what you expected?
RURAL HEALTH INNOVATIONS 32• Not surprised (6)
2. Do you find any particular statistics surprising?
• High suicide rates (3)
• Ratio of population to mental health providers in Lake County (3)
• Native American population percentages seem low and surprised about
the median household income increase over the decade
3. Are some population groups healthier than other groups? If yes, which
ones?
• Active people (4)
• Economically secure residents (2)
4. Are some population groups suffering more than other groups? If yes,
which ones?
• Elderly (4)
• People in poverty (2)
• People with mental health or substance use issues (3)
• Children/young Adults (2)
• Veterans, smokers, drinkers, and single parents were also mentioned
5. In your opinion, what are some of the barriers to accessing care in this
region?
• Transportation (6)
• Immobility (3)
• Mental health and substance use stigma (2)
• Broadband, cost of internet, ability to use technology, health literacy,
translation services, daycare, and health care services hours of operation
and cost of services were also mentioned
• Lack of a local substance use treatment facility
• Pandemic - can’t transfer patients to larger hospitals right now due to
pandemic
6. What do you think EBCH could do to increase the health of the
community? Where are opportunities to collaborate?
• Communicate, cooperate, and collaborate (4)
o Collaborate with private practice instead of competing – more
patient focused care
o Collaborate with housing authority to build more housing
RURAL HEALTH INNOVATIONS 33o Well Being Development wants to collaborate – could help EBCH to
implement Community health workers or care facilitators. They’re
really addressing BH in the area.
o Partner with economic development people to recruit someone to
bring in inpatient SU and MH treatment facilities – utilize the
natural beauty and peacefulness of the area
o Collaborate with local housing authority (build housing), Well-being
Development (community health workers)
o Work on collaboration and improving strong, positive relationships
between EBCH, free clinic, Tower Scenic Rivers, and Essentia clinics
o EBCH could support other community organizations and initiatives
financially. Maybe share their shared savings.
• Address mental health / substance use stigma (3)
• Specialty care locally (2)
• Help with transportation (2)
• More telehealth and/or home visits
• More care facilitation or community health workers
• Improve ED redirect – those visiting ED not for a physical health need. ED
flows aren’t intended for those in mental health crisis. How can hospital
serve those people?
• Ambulance – opportunities to fill some transportation gaps – can they
purchase another vehicle – leverage resources.
• Home health – such a high need and doesn’t work to contract it out. Can
the hospital revisit the home health model to make it work using their
employment benefits?
• Revitalize the community recreational complex project – bring the
community together and promote healthy behaviors
7. What is the greatest health need in this community?
• Mental health services (3)
• Specialty services (3)
• School social workers to get to the source of issues
• Address substance use disorder – alcohol use especially (opioids not
primary concern in this community)
RURAL HEALTH INNOVATIONS 34Conclusions, Recommendations, and Acknowledgements Conclusions In addition to noting secondary data, EBCH solicited community input for the CHNA through surveys, focus groups, and key stakeholder interviews. This variety provided a rich source of information. A theme emerging through the survey, secondary data, and focus groups concerns the need for more dental care and providers in the community. Access to dental services is the most pressing health concern and the number one gap in care identified in the survey. This was identified as the number three health need in the focus groups. Respondents discussed the relevance of oral health to other physical conditions, digestion, pain issues, and possibly mental health. The survey data identified the need for more mental health services (32%) to be a close third to availability of services/providers (33%). The need for more mental health services was the number one gap identified in 2018 (45%). The secondary data reveals that there is a concerning ratio for behavioral health providers in Lake County (1,330:1). This is approximately triple the number of residents for each provider as compared to St. Louis and Itasca counties, MN, and US. Because of the impact of Duluth on St. Louis County numbers, the ratio for that county could be worse than the data indicates. The need for behavioral health services was the number one priority in the focus groups and key stakeholder interviews. Related to this is the concern about stigma and attitudes towards accessing care for behavioral health issues. Survey results indicate high community usage of EBCH services. This was even more favorable than 2018. Key stakeholders and focus groups concur. Results indicate positive experiences with the hospital and appreciation of having services locally. Comments include, “phenomenal job to partner with groups in general, drive through COVID services” and “the hospital does a very good job partnering with other groups in the community.” When asked in the survey about the community’s greatest strength, EBCH was identified as number two, only behind “People helping people/caring/friendly.” RURAL HEALTH INNOVATIONS 35
Recommendations
Recommendations include exploring possibilities to bring dental services and oral
health education to the community. As noted in the focus group, oral health is tied
closely to other health issues. We recommend EBCH reach out to other small rural
hospitals that have found ways to support dental services or clinics. This is an
example of a strategy that, if selected, will require partnering with other community
organizations, businesses, faith-based groups, and the school system. While this
might be a long-term strategy, in the short term, education to the community could
be provided to help residents understand the connection between oral and physical
health, including substance use disorders.

As with most communities, there is an opportunity to continue to address
behavioral health services, education, and stigma. Telehealth has improved the
access of services for some communities, especially when transportation is
identified as a barrier to access as it was in the focus groups and key stakeholder
interviews. It was noted that broadband challenges in the remote parts of the
counties as well as limited access to technology is another barrier. It is
recommended that EBCH continue to collaborate and create new and stronger
partnerships to help address this. Suggested partners include Ministerial Council,
Northern Lights Clubhouse, Free Clinic, Food Shelf, Community College, and Well
Being Development. Additionally, the more EBCH can go into the community and
outside the city to provide education, the more people can be reached.

Acknowledgements
RHI would like to thank EBCH’s Marketing & Communications Team Leader, Jodi
Martin for her contributions and work with developing and distributing the
assessment and coordinating the focus groups and key stakeholder interviews.

RURAL HEALTH INNOVATIONS                                                              36
Appendix A: Survey Instrument

RURAL HEALTH INNOVATIONS        37
RURAL HEALTH INNOVATIONS 38
RURAL HEALTH INNOVATIONS 39
RURAL HEALTH INNOVATIONS 40
RURAL HEALTH INNOVATIONS 41
Appendix B: “Other” Survey Comments
  1. What are the THREE most pressing concerns in our community?
     (Select up to 3 responses)
        • Access to home health care options (2)
        • Doctors
        • COVID-19 spread
        • Senior housing
        • Fitness Center with lap swimming pool
        • There is access to many services, but not an avenue to identify who
           would benefit and get them to agree to the services and coordinate it.
           Coordination of care?
        • Low wages/seasonal jobs
        • Timely access to specialists
        • Chronic pain management

  2. What do you consider to be our community's greatest strengths?
       • People helping people/caring/friendly (41)
       • Hospital (33)
       • Sense of community/small town feel (28)
       • Environment/nature (22)
       • Clinic (21)
       • Our schools (12)
       • Outdoor recreation (11)
       • Safe place to live/low crime (11)
       • Volunteerism (11)
       • Health care/medical care (10)
       • Northwoods Partners/senior services (9)
       • Our doctors (8)
       • Community involvement (7)
       • Access to primary care (6)
       • Community college (VCC) (6)
       • Charitable donations (4)
       • Strong family life (3)
       • Ely food shelf (3)
       • Mining resources/mining jobs (3)
       • Senior housing (2)
       • Tourism (2)
       • Location (2)

RURAL HEALTH INNOVATIONS                                                       42
• Access to specialists (2)
• Access to a healthy lifestyle (2)
• Care for kids
• Youth services, strong support from local businesses
• Senior center meals and activities, Young Life
• Ely community resources
• United when facing issues
• Not having toxic mining in the area
• VA outpatient center, big grocery store
• The ability to accurately address issues and challenges
• Great place to visit, great place to raise kids
• Welcoming to new residents, faith communities
• A lot for kids to do
• Dental care in town
• Doctors know our name and our health problems
• The Arts (theater, City Band, Folk School, venues for live music Art &
Soul, NLAA, etc.!)
• Vaccine availability
• Cooking activities
• Active people, economic growth
• Good elderly living conditions
• Wellness/prevention services
• Access to specialists in Duluth/Twin Cities, reliable health information
• Access to radiology
• Very good emergency services (ambulance, fire, police, etc.)
• Easy access to nursing home
• Ely is very fortunate to have a pharmacy
• Natural resources
• Essentia has a very knowledgeable, professional, courteous staff. 24-7
• Housing
• Services provided by Essentia Health for continuity of care
• Access to public lands, support networks for children, creative problem
solving
• Peaceful living
• I like being remote
• Face-to-face interaction
• Wide variety of job skills due to influx of persons seeking a quieter
lifestyle
• Personal relationships with providers, banks, stores, health care
• Self-sufficiency
RURAL HEALTH INNOVATIONS 43• Jobs
• Options for social networking within the community
• Local small businesses
• Educated citizens, large number of senior citizens, large number of
independent businesses
• Logging
• Resilience, sense of inclusion, belief in our children
• Work quality ethics, inclusive of every person regardless of ethnic
background (color, etc.), involvement in preserving Ely's 'history',
arts/cultural involvement
• Being divided!
• Advance in cultural and arts promotion
• EMT's
• Active community, incoming community members with new insights
• Community supports, coordination of care
3. Select the THREE items below that you believe are the most
important for a healthy community. (Select up to 3 responses)
• Healthy environment
• Senior housing
• Comprehensive indoor recreation center for all community ages and
needs
4. In your opinion, what are the top THREE priorities to improve our
community's access to health care? (Select up to 3 responses)
• Home health care options (3)
• Urgent care (not just ER) (2)
• More dentists (2)
• Integrative health
• Not rushing thru appointments!! 15 minutes is too short a time!
• Continue with what you have!
• Less wait times
• More childcare
• We need a national single-payer system
• Accept more insurance providers
• Substance abuse outpatient programs
• Paid medical leave, free healthcare
• Keeping confidentiality/HIPAA
• Medical transport other than ambulance
• OB-GYN
RURAL HEALTH INNOVATIONS 44• Birthing center
• I think access is good except mental health
5. What are the THREE largest gaps in health care services in our
community? (Select up to 3 responses)
• Audiology
• Childcare
• Unable to connect to clinic without going through Duluth
• Urgent care vs. ER
7. In the past three years, was there a time when you or a member of
your household thought you needed health care services but did NOT
get these services or delayed getting them? If yes, what were the
most important reasons why you did NOT receive health care
services? (Select up to 3 responses)
• COVID-19 pandemic (5)
• Services not offered in Ely
• Doctor kept changing appointment date. This has happened several
times by letter, often delaying appointment by months.
• Unable to get physician you want!
• Medicare required face-to-face with doctor
• Too difficult trying to get through the scheduling process with Essentia
Health
• Specialist not available
9. In the past three years, have you or a household member received
care in a hospital (such as a hospitalized overnight, day surgery,
obstetrical care, rehabilitation, radiology, or emergency care)? If yes,
which hospital does your household use the MOST for hospital care?
(Select only ONE response)
• Region's Hospital - St. Paul
• M Health Fairview
• Twin Cities Orthopedics – Edina
• Depends on need. For ER use Ely. For Cardio use St. Mary's. For Osteo
use Lakewalk.
• Multiple (Ely-Bloomenson Community Hospital AND Essentia Health -
St. Mary's Medical Center (Duluth)) (2)
• Multiple (Ely-Bloomenson Community Hospital AND Essentia Health -
Virginia Hospital
• Multiple (Ely-Bloomenson Community Hospital AND Mayo facility)
RURAL HEALTH INNOVATIONS 45• Multiple (Ely-Bloomenson Community Hospital AND Essentia Health -
Babbitt)
• Multiple (Essentia Health St. Mary's Medical Center (Duluth) AND Mayo
Clinic)
10. Thinking about the hospital you use most frequently, what are the
THREE most important reasons for selecting that hospital? (Select up
to 3 responses)
• Specialty care only offered at larger hospital
• Hospice regulations
• Trusted the surgeon
• Specialized services available there
• Specialists, more help available
• Want to support local health care
• Surgeon was there
• Personal connection to physicians
• Only local option
• Quality of care
• Closest option for what we need to be seen for
• Specialist for surgeries
• I work there
12. In the past three years, have you or a household member seen a
health care specialist (other than your primary care provider/family
physician) for health care services? (If yes) What type of health care
specialist was seen? (Select all that apply)
• Podiatrist (3)
• Audiologist (2)
• Colorectal surgeon (2)
• Kidney specialist
• Sleep specialist
• Optometrist
• Nephrologist
• Proctologist
• Migraine specialist
• Back surgeon
• Vascular surgeon
• Emergency room doctor
• Nutritionist
• Plastic surgeon
RURAL HEALTH INNOVATIONS 4613. What type of specialist would you like to have access to MOST in our
community? (Select only ONE response) Answers where “multiple” is
written are ones where individuals selected multiple answers. The instructions
were to select only ONE response, however several individuals selected more
than one option.
• Ophthalmology (3)
• Dentist (3)
• Gastroenterology (2)
• Rehabilitation services
• Non 'Western' ex-homeopathic
• Nutritionist
• Pediatrician
• Chiropractor, Acupuncturist
• All once in a while would be great
• Multiple (Endocrinology/diabetes AND Oncology AND Psychiatric
services)
• Multiple (General surgery AND Obstetrics/gynecology)
• Multiple (General surgery AND Obstetrics/gynecology AND
Orthopedics)
• Multiple (Obstetrics/gynecology AND Orthopedics)
• Multiple (Obstetrics/gynecology AND Psychiatric services)
• Multiple (Orthopedics AND Podiatry AND Psychiatric services)
• Multiple (Dermatology AND Orthopedics AND Urology)
• Multiple (Dermatology AND Ear, nose & throat)
• Multiple (Dermatology AND Ear, nose & throat AND
Obstetrics/Gynecology)
• Multiple (Endocrinologist/diabetes AND Neurosurgeon)
• Multiple (Cardiology AND Dermatology)
• Multiple (Cardiology AND Dermatology AND Oncology)
• Multiple (Endocrinologist/diabetes AND General surgery)
• Multiple (General surgery AND Orthopedics AND Urology)
• Multiple (Orthopedics AND Psychiatric services)
• Multiple (Dermatology AND Ear, nose & throat AND podiatry (a good
doctor!!))
• Multiple (Chronic acute pain AND Endocrinology/diabetes AND
Urology)
• Multiple (Cardiology AND Dermatology AND Ear, nose & throat)
• Multiple (Cardiology AND Dermatology AND General surgery)
• Multiple (Ear, nose & throat AND Obstetrics/Gynecology AND
Podiatry)
• Multiple (Psychiatric services AND Behavioral Health neurologist)
RURAL HEALTH INNOVATIONS 4714. What type of health insurance covers the MAJORITY of your
household's medical expenses? (Select all that apply)
• Blue Cross/Blue Shield (6)
• U-Care (3)
• Medica (2)
• Subsidy
• Health Partners
• MN Sure
• Tri-Care
• Former employer 'retiree' sponsored
• I pay cash
17. What is the location of the primary health care provider used most
frequently by your household? (Select only ONE response) Answers
where “multiple” is written are ones where individuals selected multiple
answers. The instructions were to select only ONE response, however several
individuals selected more than one option.
• Essentia Health - Duluth Clinic (3)
• Laurentian Clinic (2)
• St. Luke's Laurentian - Mt. Iron (2)
• St. Luke's Laurentian - Virginia (2)
• Essentia Health - Aurora Clinic
• Aurora White
• Vermillion Clinic
• Hermantown Clinic – Duluth
• Skin doctors – Orino
• Minneapolis
• M Health Fairview
• In Twin Cities
• Don't have one
• Multiple (Essentia Health - Ely Clinic AND St. Luke's Laurentian
Medical Clinic)
• Multiple (Essentia Health - Ely Clinic AND Essentia Health Aurora
Northern Pines)
• Multiple (Essentia Health - Ely Clinic AND Scenic Rivers Health
Services - Tower Medical Clinic AND VA Clinic)
• Multiple (Essentia Health - Ely Clinic AND VA Clinic)
• Multiple (Essentia Health - Ely Clinic AND Essentia Health - Virginia
Clinic)
18. Why did you select that particular primary care provider? (Select all
that apply)
RURAL HEALTH INNOVATIONS 48• Don't want to see provider in my own small town
• Previous employee at facility
• Want to support local health care
• My previous doctor quit seeing me and went to ER only
• Like her profile on Essentia Health website
• Respect and no gossip about me coming to clinic
• Don't have one
• Essentia's stance on masking in schools
• Gender – female
• Only local option
• Knows past health history best
• Followed primary when practice moved to Tower
• Work at the hospital - all housed together
19. In the past 12 months, please select all of the preventative services
you or any household member used. (Select all that apply)
• Kidney stone
• Kidney examination
• Pneumonia vaccine
• Cologuard screening
• Monthly B-12 injection
• Eye and dental care check-ups
• Lyme Disease prevention
• Eye exam
• Pacemaker checks remote/clinic
• Dental check-up
• Please note that most of the above do not prevent disease
24. With what ethnicity do you most identify? (Select all that apply)
• Hispanic
• Homo Sapiens
RURAL HEALTH INNOVATIONS 49Appendix C: Secondary Data Analysis Introduction There are two different types of sources used to conduct a CHNA. The first type is a primary source that is the initial material that is collected during the research process. Primary data is the data that RHI collects using methods such as surveys, focus groups, key stakeholder interviews, as well as objective data sources. Primary data is a reliable method to collect data as RHI knows the source, how it was collected and analyzed. Secondary data is the analysis of preexisting data. Secondary data analysis utilizes the data that was collected by another entity in order to further a study. Secondary data analysis is useful for organizational planning to complement primary data or if there is not time or resources to gather raw data. It has its drawbacks, however, as data from the different agencies is collected during different timeframes and with varying methods. This can make direct comparisons of secondary data difficult. See Appendix D for source details and definitions. Please note, the data collected for this report is the most current information as of November 2021. The types of measures selected to analyze in this report were identified based on data available for St. Louis County, Lake County, Itasca County, MN, and the US. For more secondary data information, RHI offers users the ability to extract multiple data elements that are focused on specific scenarios in population health management on the Population Health Portal. RURAL HEALTH INNOVATIONS 50
You can also read