Emerging Market Sovereign Debt Opportunities and Outlook for 2021
←
→
Page content transcription
If your browser does not render page correctly, please read the page content below

Emerging Market Sovereign Debt
       Opportunities and Outlook for 2021

                                              23 March 2021

                                www.colchesterglobal.com

Colchester Global Investors Limited is authorized and regulated by the Financial Conduct Authority and registered
        with the Securities and Exchange Commission and the Commodity Futures Trading Commission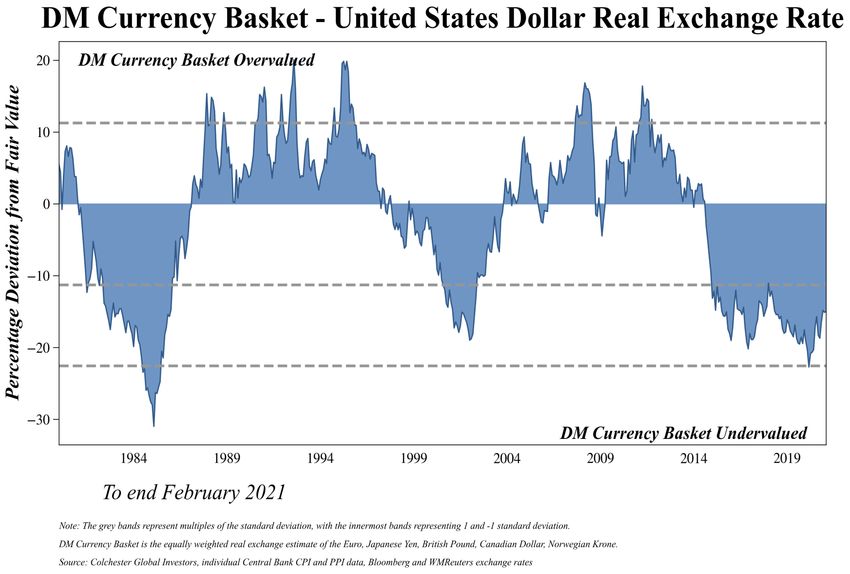
IMPORTANT NOTES
Risk Disclosures

•     Unless otherwise stated, this document reflects Colchester Global Investor’s (‘Colchester’) views and opinions as of 28 February 2021. In respect of the products and
      strategies mentioned in this document, the information is provided for illustrative purposes only and is intended only for professional clients and third-party
      intermediaries. Colchester makes no representation or warranty as to the accuracy or completeness of the information in this document and disclaims all liability for any
      direct, indirect, consequential or other losses or damages including loss of profits incurred by you or any third party that may arise from reliance on this document.
•     This document is not a financial promotion. Investors should seek professional advice before making an investment. Past performance is no guarantee of future
      performance and the value of any investment may fall as well as rise. Investment in the products mentioned in this document puts your capital at risk, and you may lose
      some or all of your investment.
•     Prospective investors and clients should be aware that any investment involves a degree of risk. The return of your investment may increase or decrease as a result of
      currency fluctuations if your investment is made in a currency other than that used in the past performance calculation within this document.
•     Unless shown otherwise, all returns are illustrated as gross of fees. Gross returns do not reflect the deduction of fees and expenses, which would inevitably reduce the
      client’s returns. Clients may request net performance results at fees agreed in their Investment Management Agreement or Prospectus/Offering documents at any time.
      A full performance document in compliance with Global Investment Performance Standards (GIPS ®) is available upon request. Additional information regarding
      policies and procedures for calculating and reporting returns is also available on request. Nothing in this document should be construed as providing any type of
      investment, tax or other advice, or be considered a solicitation, recommendation, endorsement or offer to purchase or sell any financial instrument.
•     This is not a research report and is not intended as such. Certain information in this document may constitute forward-looking statements. Due to the various
      uncertainties and actual events, the actual performance of the markets may differ materially from those reflected or contemplated in such forward-looking statements.
      As a result, clients/investors should not rely on such forward-looking statements in making any investment decisions.
•     This document may contain information obtained from third parties, including ratings from credit ratings agencies. Reproduction and distribution of third party content
      in any form is prohibited, except with the prior written permission of the related third party. Third party content providers do not endorse or recommend the securities
      or products discussed herein, nor do they guarantee the accuracy, completeness, timeliness or availability of any information, including ratings (negligent or otherwise),
      regardless of the cause, or for the results obtained from the use of such content. Third party content providers give no express or implied warranties, including, but not
      limited to, any warranties of merchantability or fitness for a particular purpose or use. Third party content providers shall not be liable for any direct, indirect,
      incidental, exemplary, compensatory, punitive, special or consequential damages, costs, expenses, legal fees, or losses (including lost income or profits and opportunity
      costs or losses caused by negligence) in connection with any use of their content, including ratings. Credit ratings are statements of opinions and are not statements of
      fact or recommendations to purchase, hold or sell securities. They do not address the suitability of securities for investment purposes and should not be relied on as
      investment advice.
•     Information concerning the calculation of statistics used for portfolio characteristics is available upon request. Various industry standards, indices and industry
      performance comparative data are provided in this document and are detailed where appropriate. These include indices from FTSE, Bloomberg Barclays, MSCI, JP
      Morgan and ICE. Data is sourced additionally from Bloomberg and Datastream.
•     FTSE Russell is a trading name of certain of the LSE Group* companies. FTSE® is a trade mark of the relevant LSE Group companies and is used by any other LSE
      Group company under license. “TMX®” is a trade mark of TSX, Inc. and used by the LSE Group under license. All rights in the FTSE Russell indexes or data vest in
      the relevant LSE Group company which owns the index or the data. Neither LSE Group nor its licensors accept any liability for any errors or omissions in the indexes
      or data and no party may rely on any indexes or data contained in this communication. No further distribution of data from the LSE Group is permitted without the
      relevant LSE Group company’s express written consent. The LSE Group does not promote, sponsor or endorse the content of this communication. * London Stock
      Exchange Group plc and its group undertakings (collectively, the “LSE Group”). © LSE Group 2021.

                            ®
                                                                                                                                                                              2
IMPORTANT NOTES
    Risk Disclosures

    •     Bloomberg Index Services Limited. BLOOMBERG® is a trademark and service mark of Bloomberg Finance L.P. and its affiliates (collectively “Bloomberg”).
          BARCLAYS® is a trademark and service mark of Barclays Bank Plc (collectively with its affiliates, “Barclays”), used under license. Bloomberg or Bloomberg’s
          licensors, including Barclays, own all proprietary rights in the Bloomberg Barclays Indices. Neither Bloomberg nor Barclays approves or endorses this material, or
          guarantees the accuracy or completeness of any information herein, or makes any warranty, express or implied, as to the results to be obtained therefrom and, to the
          maximum extent allowed by law, neither shall have any liability or responsibility for injury or damages arising in connection therewith.
    •     Information has been obtained from sources believed to be reliable but J.P. Morgan does not warrant its completeness or accuracy. The Index is used with permission.
          The Index may not be copied, used, or distributed without J.P. Morgan's prior written approval. Copyright 2021, J.P. Morgan Chase & Co. All rights reserved.
    •     ICE Data Indices, LLC (“ICE Data”), is used with permission. ICE Data, its affiliates and their respective third party suppliers disclaim any and all warranties and
          representations, express and/or implied, including any warranties of merchantability or fitness for a particular purpose or use, including the indices, index data and any
          data included in, related to, or derived therefrom. Neither ICE Data, its affiliates nor their respective third party providers shall be subject to any damages or liability
          with respect to the adequacy, accuracy, timeliness or completeness of the indices or the index data or any component thereof, and the indices and index data and all
          components thereof are provided on an “as is” basis and your use is at your own risk. ICE Data, its affiliates and their respective third party suppliers do not sponsor,
          endorse, or recommend Colchester Global Investors Limited, or any of its products or services.
    •     There can be no assurance that professionals currently employed by Colchester will continue to be employed by the firm or that a level of experience or past
          performance is indicative of future performance or success.
    •     Information about how to make a complaint, any right to compensation and any cancellation rights will be provided to you upon request.

    Regulatory Information

•       Colchester is an employee owned firm headquartered in London and has regional offices in New York, Singapore and Dubai and a representative office in Sydney,
        Australia.
•       Colchester is authorised and regulated by the Financial Conduct Authority in the United Kingdom. Colchester is also registered with the Securities and Exchange
        Commission in the USA and is registered as a Commodity Trading Advisor and Commodity Pool Operator with the Commodity Futures Trading Commission.
•       Discretionary investment management services and funds are not and will not be marketed in Argentina by means of a public offering, as such term is defined under
        Section 2 of Law Nº 26,831, as amended. No application has been or will be made with the Argentine Comisión Nacional de Valores, the Argentine securities
        governmental authority, to offer funds or discretionary investment management services in Argentina.
•       Colchester Global Investors Limited is licenced as a financial services provider by the Financial Sector Conduct Authority (licence number 43012) in South Africa.
•       Colchester Global Investors Limited is registered with the Securities Commission of The Bahamas, as the investment manager for an investment fund licensed as a
        Smart Fund model 003, in accordance with the provisions of the Investment Funds Act, 2019.
•       Colchester Global Investors (Singapore) Pte. Ltd holds a capital markets services licence in fund management issued by the Monetary Authority of Singapore.
        Colchester Global Investors (Singapore) Pte. Ltd also holds an offshore discretionary investment management services licence issued by the Financial Services
        Commission of Korea.
                                 ®
                                                                                                                                                                                    3
IMPORTANT NOTES
Regulatory Information

•     Please note the following in respect of Colchester's regulatory status in Australia: (i) neither Colchester Global Investors Limited nor Colchester Global Investors
      (Singapore) Pte. Ltd. holds an Australian financial services licence for the provision of certain financial services, and both entities are exempt from the requirement to
      hold an Australian financial services licence under the Corporations Act 2001 (Cwlth) in respect of the financial services Colchester provides; (ii) Colchester Global
      Investors Limited is authorised and regulated by the Financial Conduct Authority of the United Kingdom under UK laws, which differ from Australian laws; (iii)
      Colchester Global Investors (Singapore) Pte. Ltd. is regulated by the Monetary Authority of Singapore under Singapore laws, which differ from Australian laws.
      Therefore, Australian wholesale clients are not necessarily subject to the same types of legal protections or remedies that they would enjoy if Colchester was directly
      subject to the Corporations Act. Colchester is entitled to offer its financial services in Australia pursuant to an exemption from the requirement to hold an Australian
      Financial Services Licence under the Corporations Act, on the basis, among other things, that the clients are “wholesale clients” within the meaning of the Corporations
      Act.
•     Colchester Global Investors Middle East Limited is regulated by the Dubai Financial Services Authority for the provision of Advising on Financial Products and
      Arranging Deals in Investments. All communications and services are directed at Professional Clients only. Persons other than Professional Clients, such as Retail
      Clients, are not the intended recipients of Colchester Global Investors Middle East Limited’s communications or services. Colchester Global Investors Middle East
      Limited is a company established in the Dubai International Financial Centre (DIFC) pursuant to the DIFC Companies Law with registration number CL 3239.
•     Colchester Global Investors Inc. is a wholly owned subsidiary of Colchester Global Investors Limited. It is not permitted to provide investment advice or otherwise
      engage in a regulated activity.
•     Shares in Colchester funds (“securities”) may not be offered or sold to the public in Brazil. Accordingly, the securities have not been and will not be registered with the
      Brazilian Securities and Exchange Commission (Comissão de Valores Mobiliários, the “CVM”), nor have been submitted to the foregoing agency for approval.
      Documents relating to the securities, as well as the information contained therein, may not be supplied to the public in Brazil, as the offering of securities is not a public
      offering of securities in Brazil, nor used in connection with any offer for subscription or sale of securities to the public in Brazil. A seller of the securities may be asked
      by the purchaser to comply with procedural requirements to evidence previous title to the securities and may be subject to Brazilian tax on capital gains which may be
      withheld from the sale price. Persons wishing to offer or acquire the securities within Brazil should consult with their own counsel as to the applicability of these
      registration requirements or any exemption therefrom.
•     The Colchester UCITS fund has not and will not be registered in the National Registry of Securities maintained by the National Banking and Securities Commission,
      and therefore may not be offered or sold publicly in Mexico. The Colchester UCITS fund may be offered or sold to qualified and institutional investors in Mexico,
      pursuant to the private placement exemption set forth under Article 8 of the Securities Market Law as part of a private offer. These materials do not constitute an offer
      to purchase securities and should not be viewed as marketing or offering materials.

THIS DOCUMENT IS INTENDED FOR PROFESSIONAL USE ONLY AND IS NOT FOR PUBLIC DISTRIBUTION. IT MAY CONTAIN INFORMATION THAT IS
PRIVILEGED, CONFIDENTIAL OR EXEMPT FROM DISCLOSURE UNDER APPLICABLE LAW. IF YOU HAVE RECEIVED THIS COMMUNICATION IN ERROR,
PLEASE DISREGARD AND DELETE IT AND DO NOT DISSEMINATE THE CONTENTS TO ANY OTHER PERSON.

THIS DOCUMENT DOES NOT CONSTITUTE A PROSPECTUS OR OFFERING CIRCULAR TO SUBSCRIBE FOR ANY SECURITIES. POTENTIAL INVESTORS
MUST REVIEW THE RELEVANT PRODUCT OFFERING DOCUMENTS OR INVESTMENT MANAGEMENT AGREEMENT, AND IN PARTICULAR, THE RISK
DISCLOSURES SET OUT THEREIN.

                             ®
                                                                                                                                                                                   4
TABLE OF CONTENTS

       1. Introduction to Emerging Market Debt

       2. The role of EMD in a diversified Portfolio

       3. Comparing Valuations in Local and Hard Currency

       4. Conclusions

       5. Appendix

          ®
                                           Please refer to the Important Notes section on pages 2-4.   5
1. Introduction to Emerging Market Debt
®
Please refer to the Important Notes section on pages 2-4. 6INTRODUCTION TO EMERGING MARKET DEBT
⚫ Emerging Market Debt is made up of;
• Foreign currency denominated sovereign bonds
• Local currency denominated sovereign bonds
• Corporate bonds
⚫ The standard index for the foreign i.e. hard currency asset class is
the JP Morgan EMBI. This was launched in the early 1990’s with 14
countries, and now contains 73.
⚫ The local currency standard is the JP Morgan GBI-EM, launched in
2005. This index contains 19 countries.
®
Please refer to the Important Notes section on pages 2-4. 7INTRODUCTION TO EMERGING MARKET DEBT
⚫ Local Currency Universe is materially larger at 2.1trn USD (JP
Morgan GBI-EM Global market cap) and this does not include
markets such as Egypt or India.
⚫ The Hard Currency Universe is 1.3trn USD (market cap of the JP
Morgan EMBI Global).
Index Characteristics
JP Morgan GBI-EM GD JP Morgan EMBI GD
Yield to Maturity 4.71% 5.08%
Average Coupon 5.44% 5.28%
Modified Duration (yrs) 5.28 7.94
Average Credit Rating BBB+ BBB-
Source: JP Morgan, Colchester Global Investors. Correct as of 28th February 2021. Global Diversified (GD) version of each index used.
®
Please refer to the Important Notes section on pages 2-4. 8INTRODUCTION TO EMERGING MARKET DEBT
Hard Currency EM Debt has outperformed Local Currency historically, both
have outperformed IG corporate debt and Developed Market government debt:
Annualised Return Annualised Volatility
Global Equities 9.14% 15.11%
US High Yield debt 8.34% 9.14%
Hard Currency EM debt 8.17% 8.60%
Local Currency EM debt (USD unhedged) 6.72% 11.86%
US Corporate debt 5.65% 5.83%
Global Corporate Debt 5.27% 6.52%
Local Currency EM debt (USD hedged) 4.79% 4.26%
Global IG Government debt (USD hedged) 4.21% 2.96%
Global IG Government debt (USD unhedged) 4.18% 6.35%
US Treasuries 3.82% 4.25%
Source: Bloomberg, Colchester Global Investors. Returns in USD terms (unhedged unless stated otherwise) for period from 31/12/2002 to 31/12/2020.
Indices used: MSCI World Total Return USD Index, FTSE World Government Bond Index, FTSE US GBI, JP Morgan GBI-EM Global Diversified Index, ICE BofA Global Corporate Bond Index,
Bloomberg Barclays US Corporate Bond Index, JP Morgan EMBI Global Diversified Index, ICE BofA US High Yield Index.
®
Please refer to the Important Notes section on pages 2-4. 9INTRODUCTION TO EMERGING MARKET DEBT
Local currency debt typically higher rated:
Credit Rating Profile (Percent of index weight)
40
Local Currency
Index Weight (in Percentage)
30
Hard Currency
20
10
0
AA A BBB BB B CCC CC C
Source: JP Morgan, Bloomberg. As at 31/12/2020. Rating is highest of S&P, Moody’s and Fitch, where available. The local currency rating is used for the local currency index (JP Morgan GBI-EM GD)
and the foreign currency rating for the hard currency index (JP Morgan EMBI GD).
®
Please refer to the Important Notes section on pages 2-4. 10INTRODUCTION TO EMERGING MARKET DEBT
Debt levels and interest costs in EM under upward pressure due to Covid but
are manageable in most cases:
Debt and Interest Costs
140 3.0
Emerging Developed
Advanced Economies Interest Cost (rhs) Debt/GDP Debt/GDP
120
Interest Cost (% of GDP)
2.5
Debt/GDP (%)
100
80
2.0
60
Emerging Economies Interest Cost (rhs)
40
1.5
20
0 1.0
2007 2008 2009 2010 2011 2012 2013 2014 2015 2016 2017 2018 2019 2020
Source: IMF World Economic Outlook October 2020, IMF Fiscal Monitor October 2020.
®
Please refer to the Important Notes section on pages 2-4. 11INTRODUCTION TO EMERGING MARKET DEBT
Inflation has structurally declined:
20
Inflation Over the Last 20 Years
18
Average: 7.8%
16
Average: 5.9%
14
Average: 5.2%
Percent
12
Average: 3.5%
10
8
6
4
2
0
-2
2001 2002 2003 2004 2005 2006 2007 2008 2009 2010 2011 2012 2013 2014 2015 2016 2017 2018 2019 2020
Brazil Indonesia Mexico Russia Poland
Source: Official Sources, further information upon request.
®
Please refer to the Important Notes section on pages 2-4. 122. The role of EMD in a Diversified Portfolio
®
Please refer to the Important Notes section on pages 2-4. 13EMERGING MARKET DEBT
EM debt (Local and Hard Currency) positively correlated to equities, but not as
much as High Yield. Local Currency EMD offers somewhat better diversification
relative to other Fixed Income sectors compared to Hard Currency:
Historical Return Correlations of Fixed Income Sectors
Global Equities WGBI WGBI (USD hedged) US Treasuries LC EMD LC EMD (USD hedged) Global Corporates US Corporates EMBI US High Yield
Global Equities 1.00
WGBI 0.16 1.00
WGBI (USD hedged) -0.25 0.58 1.00
US Treasuries -0.41 0.56 0.87 1.00
LC EMD 0.64 0.57 0.06 -0.06 1.00
LC EMD (USD hedged) 0.37 0.56 0.44 0.34 0.81 1.00
Global Corporates 0.64 0.71 0.33 0.17 0.76 0.67 1.00
US Corporates 0.40 0.59 0.60 0.44 0.53 0.66 0.86 1.00
EMBI 0.63 0.49 0.23 0.03 0.80 0.73 0.84 0.76 1.00
US High Yield 0.81 0.28 -0.04 -0.25 0.68 0.49 0.78 0.66 0.81 1.00
Source: Bloomberg, Colchester Global Investors. Returns in USD terms (unhedged unless stated otherwise) for period from 31/12/2010 to 31/12/2020.
Indices used: MSCI World Total Return USD Index, FTSE World Government Bond Index, FTSE US GBI, JP Morgan GBI-EM Global Diversified Index, ICE BofA Global Corporate Bond Index,
Bloomberg Barclays US Corporate Bond Index, JP Morgan EMBI Global Diversified Index, ICE BofA US High Yield Index.
®
Please refer to the Important Notes section on pages 2-4. 14EMERGING MARKET DEBT
At equivalent Credit Ratings, Default Rates have been higher in Foreign
Currency Sovereign Debt than Local Currency:
Sovereign Cumulative 5yr Average Default Rates, 1975-2019 (%)
Foreign
Rating Local Currency*
Currency
AAA 0.00 0.00
AA 0.00 0.00
A 1.62 1.57
BBB 2.13 1.45
BB 4.25 2.9
B 14.34 5.87
CCC/CC 54.23 30.53
Source: S&P, 2019 Annual Sovereign Default and Rating Transition Study, May 2020.
*1993-2019 for Local Currency.
®
Please refer to the Important Notes section on pages 2-4. 153. Valuations – comparing Hard and Local Currency
®
Please refer to the Important Notes section on pages 2-4. 16VALUATIONS – LOCAL CURRENCY EMD
Real Yields equal 10 year market yield less Colchester inflation forecasts
February 2021
Developed
6
5.2 Emerging
5
4
3.4 3.4
Percent (%)
3 2.7
2.5 2.5
1.8
2 1.6
1.2 1.0 1.0 1.0
1 0.7 0.7
0.5
0.3 0.2
0.0
0
-0.0 -0.0 -0.1
-0.3 -0.3 -0.4
-1 -0.5
-0.7 -0.7
-0.9 -0.9 -1.0
-1.2
-2 -1.4 -1.4
-3
ZA ID BR RU CO MX PE MY CN PH TH RO SG KR NZ AU JP TR CL CA NO IL CZ US CH TW SE HU GB DK HK PL DE
AU Australia CO Colombia HU Hungary MY Malaysia RO Romania TW Taiwan
BR Brazil CZ Czech Republic ID Indonesia NO Norway RU Russia US United States
CA Canada DK Denmark IL Israel NZ New Zealand SE Sweden ZA South Africa
CH Switzerland DE Germany JP Japan PE Peru SG Singapore
CL Chile GB United Kingdom KR Korea PH Philippines TH Thailand
CN China HK Hong Kong MX Mexico PL Poland TR Turkey
Notes:
1. The prospective real yield for the 10 year sector is shown here for representational purposes. Colchester values up the 2, 5, 10 and 20 year sectors of the yield curve when valuing a country. The final portfolio
reflects the value on offer in these individual yield curve points.
2. The expected real yield for Euroland is calculated based on the 10 year German Bund yield and the Colchester forecast for inflation in the Eurozone.
3. Source: Colchester Global Investors, individual Central Bank CPI and PPI data, and Bloomberg
®
Please refer to the Important Notes section on pages 2-4. 17VALUATIONS – LOCAL CURRENCY EMD
®
Please refer to the Important Notes section on pages 2-4. 18VALUATIONS – LOCAL CURRENCY EMD
Index weighted EM Currency – US Dollar Real Exchange Rate
Percent Deviation from Fair Value
EM basket Overvalued
EM basket Undervalued
To end February 2021 Standard deviation from fair value
Source: Colchester Global Investors, individual Central Bank CPI and PPI data, Bloomberg, JP Morgan, WM Reuters.
Index weights are those of the JP Morgan GBI-EM Global Diversified Index.
®
Please refer to the Important Notes section on pages 2-4. 19VALUATIONS – LOCAL CURRENCY EMD
Real FX versus USD
February 2021
30
24 21
18
11 10
12
7
Percent (%)
6 3 2 1 0 0
0
-1
-6 -3 -3 -3
-5 -5 -6
-12 -8
-10 -11 -12 -13
-18 Developed -14 -14 -15
-17 -18
Emerging -19
-24 -22 -23 -24 -24
-30 -27 -27
-36
NZD AUD ILS THB CLP CHF CZK DKK USD IDR CNY HKD PHP PEN SGD EUR CAD RON TWD KRW HUF PLN ZAR GBP RUB SEK NOK MXN MYR COP JPY BRL TRY
AUD Australian Dollar COP Colombian Peso HUF Hungarian Forint MYR Malaysian Ringgit RON Romanian Leu TWD Taiwan Dollar
BRL Brazilian Real CZK Czech Koruna IDR Indonesian Rupiah NOK Norwegian Krone RUB Russian Ruble USD United States Dollar
CAD Canadian Dollar DKK Danish Krone ILS Israeli New Shekel NZD New Zealand Dollar SEK Swedish Krona ZAR South Africa Rand
CHF Swiss Franc EUR Euro JPY Japanese Yen PEN Peruvian Sol SGD Singapore Dollar
CLP Chilean Peso GBP Great British Pound KRW Korean Won PHP Philippine Peso THB Thai Baht
CNY Chinese Renminbi HKD Hong Kong Dollar MXN Mexican Peso PLN Polish Zloty TRY Turkish Lira
Source: Colchester Global Investors, individual Central Bank CPI and PPI data, Bloomberg, and WMReuters
®
Please refer to the Important Notes section on pages 2-4. 20VALUATIONS – LOCAL CURRENCY EMD
EM Currency valuations and fundamentals have improved since 2013:
Real Exchange Rate and Current Account
Real Exchange Rate Valuation (v’s USD)
40%
Currency overvalued
RUB
BRL
TRY CLP
30% PEN
THB COP
20%
IDR
MXN
ZAR THB
10% PLN MYR
CLP
CZK RON HUF
Currency undervalued
CNY
0%
IDR
PEN
RON
-10% HUF
PLN
RUB
ZAR
COP
-20%
MXN MYR
TRY BRL
-30%
-6% -4% -2% 0% 2% 4% 6%
Current Account plus net FDI (percent of GDP)
Source: IMF, World Bank, Colchester Global Investors as of May 2013 and February 2021.
®
Please refer to the Important Notes section on pages 2-4. 21VALUATIONS – HARD CURRENCY EMD
Index Spread around 60bps wider than average rating spread:
JP Morgan EMBIGD Index Yield Spread
1000
900 EMBIGD Spread
Yield Spread (Basis Points)
800
700
5yr moving average Credit
600 Rating Adjusted Spread
500
400
300
200
100
0
1999 2001 2003 2005 2007 2009 2011 2013 2015 2017 2019
January Years
Source: JP Morgan, Bloomberg, Colchester Global Investors. Data from December 1999 to February 2021. The “Spread” is over US Treasuries.
®
Please refer to the Important Notes section on pages 2-4. 22VALUATIONS – HARD CURRENCY EMD
Investment Grade spreads close to the tightest in past 10 years:
JP Morgan EMBI Investment Grade Spread
350
300
Basis Points
250
200
150
100
2011 2012 2013 2014 2015 2016 2017 2018 2019 2020 2021
January Years
Source: JP Morgan, Bloomberg. Data from 28/02/2011 to 28/02/2021. Grey line shows the average over the period.
®
Please refer to the Important Notes section on pages 2-4. 23VALUATIONS – HARD CURRENCY EMD
But Non-Investment Grade Spreads above 10yr average:
JP Morgan EMBI Non-Investment Grade Spread
1300
1100
900
Basis Points
700
500
300
100
2011 2012 2013 2014 2015 2016 2017 2018 2019 2020 2021
January Years
Source: JP Morgan, Bloomberg. Data from 28/02/2011 to 28/02/2021. Grey line shows the average over the period.
®
Please refer to the Important Notes section on pages 2-4. 24VALUATIONS – HARD CURRENCY EMD
Hard Currency Index contains more exposure to lower credits:
Credit Rating Profile (Percent of index weight)
40
Local Currency
Index Weight (in Percentage)
30
Hard Currency
20
10
0
AA A BBB BB B CCC CC C
Source: JP Morgan, Bloomberg. As at 31/12/2020. Rating is highest of S&P, Moody’s and Fitch, where available. The local currency rating is used for the local currency index (JP Morgan GBI-EM GD)
and the foreign currency rating for the hard currency index (JP Morgan EMBI GD).
®
Please refer to the Important Notes section on pages 2-4. 254. Conclusions
®
Please refer to the Important Notes section on pages 2-4. 26CONCLUSIONS
⚫ Local and hard currency EM sovereign debt need to be considered as
separate asset classes with different characteristics.
⚫ The local currency universe is larger and growing more rapidly than
the hard currency space, and offers a higher average credit quality.
⚫ Hard currency has historically generated higher returns than local
currency EM debt, but EM currencies currently undervalued relative
to the US dollar.
®
Please refer to the Important Notes section on pages 2-4. 27Please send your queries to
MarketingClientService@colchesterglobal.com
Thanks for joining us today.
®
Please refer to the Important Notes section on pages 2-4. 285. Appendix
®
Please refer to the Important Notes section on pages 2-4. 29PROSPECTIVE REAL YIELD
Currency - Benchmark PRY:
Weighted average prospective real yield (percent)
Benchmark Currency Valuation
Benchmark PRY
January Years
Currency is translated into an equivalent real yield by dividing portfolio or benchmark aggregate real exchange rate undervaluation (versus the USD) by 5. This assumes a 5 year reversion to fair value. An undervalued currency
has a positive value and an overvalued currency a negative - Data as at end February 2021.
Benchmark is the JP Morgan GBI-EM Global Diversified index.
®
30PROSPECTIVE REAL YIELD
Bonds - Benchmark PRY:
Benchmark Prospective Real Yield
Weighted average prospective real yield (percent)
Benchmark PRY
January Years
Notes: Prospective Real yield is the 10yr nominal yield in each market, minus Colchester’s forecast of inflation where available. Otherwise market index yield to maturity or (known) next 12 months’ consumer price
inflation is substituted - Data as at end February 2021.
Benchmark is the JP Morgan GBI-EM Global Diversified index.
®
31PROSPECTIVE REAL YIELD
Combined - Benchmark PRY:
Weighted average prospective real yield (percent)
Benchmark Combined PRY
Benchmark PRY
January Years
Combined of bond prospective real yield (10yr nominal yield in each market, minus Colchester’s forecast of inflation) and currency real yield (equivalent real yield by dividing portfolio or benchmark aggregate real exchange rate
undervaluation (versus the USD) by 5) - Data as at end February 2021.
Benchmark is the JP Morgan GBI-EM Global Diversified index.
®
32BIOGRAPHIES – Introducing and Guest Speakers
Cian O’Brien, MSc, CFA
Senior Investment Officer
Cian is a Senior Investment Officer at Colchester Global Investors and has been with the firm since 2013. Cian manages
both developed and emerging market bond portfolios and conducts sovereign balance sheet research at the firm. He began
his career in 2002 with the Central Bank of Ireland before moving into asset management with Bank of Ireland Asset
Management. In 2011 he joined State Street Global Advisors (SSgA) in London where he was a senior portfolio manager
on the active global fixed income team. Cian graduated from University College Cork with a degree in Commerce and
German, before obtaining a Masters in Investment and Treasury from Dublin City University. He is a CFA charterholder
and a member of the CFA Society of the UK.
Mark Capstick, BA (Hons)
Investment Officer
Mark is an Investment Officer at Colchester Global Investors and has been with the firm since June 2016. Mark started his
career in 1998 and has managed bonds and currencies since 2000. Prior to joining Colchester, Mark was an Emerging
Market Bond and Currency Investment Manager at Fischer, Francis, Trees & Watts (FFTW), starting in 2012. Before
FFTW, Mark was a Fund Manager at Rexiter Capital Management, a subsidiary of State Street Global Advisors (SSgA).
While there he was responsible for the analysis and management of Asian fixed income and currency investments for
Rexiter's emerging markets fixed income products. He joined Rexiter in November 2006 from SSgA where he worked as
an Investment Manager in SSgA's Global Fixed Income group, focusing on ‘developed world economies,’ most notably
those in the dollar bloc. In 2003 and 2004 Mark worked in Singapore and assisted in building the first local currency
denominated Asian bond fund. Mark earned a BA (Hons) in Financial Services from Manchester Metropolitan University.
Analia Giachino, BA, M.Fin.
Product Specialist
Analia is a Product Specialist within the Marketing and Client Services team, based in Montevideo, and joined the firm in
March 2020. Analia assists with the firm’s marketing and business development efforts in the Latin American and US
offshore markets. Analia has a background in Advisory and Investment Analysis having led the Advisory and Investment
Analysis team at PAM Global Investors for several years and more recently the Research team at Puente Corredor de
Bolsa in the Southern Cone. She also held sales roles at Commerzbank Spain, Man Investments in London and EFG and
BBVA banks in Uruguay. Analia lectures as Professor on Asset Pricing and Financial Analysis at the Universidad de
Montevideo and holds a BA in Economics from Universidad de la República and a Master in Financial Analysis from
Universidad Carlos III de Madrid.
®You can also read