EMPATH: A Neural Network that Categorizes Facial Expressions
←
→
Page content transcription
If your browser does not render page correctly, please read the page content below
EMPATH: A Neural Network that Categorizes
                                                   Facial Expressions

                                               Matthew N. Dailey1, Garrison W. Cottrell1, Curtis Padgett2,
                                                                  and Ralph Adolphs3

                                                                                                                                                                                    Downloaded from http://mitprc.silverchair.com/jocn/article-pdf/14/8/1158/1757681/089892902760807177.pdf by guest on 18 May 2021
                    Abstract
                    & There are two competing theories of facial expression                                      we show that a simple yet biologically plausible neural network
                    recognition. Some researchers have suggested that it is an                                   model, trained to classify facial expressions into six basic
                    example of ‘‘categorical perception.’’ In this view, expression                              emotions, predicts data used to support both of these
                    categories are considered to be discrete entities with sharp                                 theories. Without any parameter tuning, the model matches
                    boundaries, and discrimination of nearby pairs of expressive                                 a variety of psychological data on categorization, similarity,
                    faces is enhanced near those boundaries. Other researchers,                                  reaction times, discrimination, and recognition difficulty, both
                    however, suggest that facial expression perception is more                                   qualitatively and quantitatively. We thus explain many of the
                    graded and that facial expressions are best thought of as points                             seemingly complex psychological phenomena related to facial
                    in a continuous, low-dimensional space, where, for instance,                                 expression perception as natural consequences of the tasks’
                    ‘‘surprise’’ expressions lie between ‘‘happiness’’ and ‘‘fear’’                              implementations in the brain. &
                    expressions due to their perceptual similarity. In this article,

                    INTRODUCTION
                                                                                                                 proponent of the idea that emotions are discrete entities.
                    How do we see emotions in facial expressions? Are they                                       In a recent essay, he outlined his theory of basic emo-
                    perceived as discrete entities, like islands jutting out of                                  tions and their relationship with facial expressions
                    the sea, or are they more continuous, reflecting the                                         (Ekman, 1999). ‘‘Basic’’ emotions are distinct families of
                    structure beneath the surface? We believe that computa-                                      affective states characterized by different signals, physi-
                    tional models of the process can shed light on these                                         ology, appraisal mechanisms, and antecedent events.
                    questions. Automatic facial expression analysis is an                                        Ekman cites early evidence suggesting that each emotion
                    active area of computer vision research (Lien, Kanade,                                       is accompanied by distinctive physiological changes that
                    Cohn, & Li, 2000; Donato, Bartlett, Hager, Ekman, &                                          prepare an organism to respond appropriately. For in-
                    Sejnowski, 1999; Lyons, Budynek, & Akamatsu, 1999;                                           stance, blood flow to the hands increases during anger,
                    Rosenblum, Yacoob, & Davis, 1996). However, there has                                        possibly in preparation for a fight. In addition to physio-
                    only been limited work in applying computational mod-                                        logical changes, according to the theory, each basic
                    els to the understanding of human facial expression                                          emotion family is also accompanied by a fast appraisal
                    processing (Calder, Burton, Miller, Young, & Akamatsu,                                       mechanism that attends to relevant stimuli and a set of
                    2001; Lyons, Akamatsu, Kamachi, & Gyoba, 1998). In                                           universal antecedent events (e.g., physical or psycholog-
                    particular, the relationship between categorization and                                      ical harm normally leads to a state of fear, and loss of a
                    perception is controversial, and a computational model                                       significant other normally leads to a state of sadness).
                    may help elucidate the connection between them.                                              Finally, and most importantly, Ekman believes that emo-
                                                                                                                 tions evolved to ‘‘inform conspecifics, without choice or
                                                                                                                 consideration, about what is occurring: inside the per-
                    Basic Emotions and Discrete Facial Expression
                                                                                                                 son . . . , what most likely occurred . . . , and what is most
                    Categories
                                                                                                                 likely to occur next’’ (p. 47). Thus, every basic emotion
                    Although the details of his theory have evolved substan-                                     family is necessarily accompanied by one (or perhaps a
                    tially since the 1960s, Ekman remains the most vocal                                         few for some families) distinctive prototypical signals,
                                                                                                                 including a set of facial muscle movements and body
                    1
                     University of California, San Diego, 2Jet Propulsion Laboratory,                            movements (e.g., approach or withdrawal). The signals
                    3
                     University of Iowa                                                                          are not entirely automatic; they may be attenuated,
                    Note: EMPATH stands for ‘‘EMotion PATtern recognition using                                  masked, or faked in certain circumstances. Further-
                    Holons’’, the name for a system developed by Cottrell &                                      more, within emotion families, individual differences
                    Metcalfe (1991).                                                                             and situational context allow for small variations on

                    D 2002 Massachusetts Institute of Technology                                                      Journal of Cognitive Neuroscience 14:8, pp. 1158 – 1173

Downloaded from http://www.mitpressjournals.org/doi/pdf/10.1162/089892902760807177 by guest on 15 October 2021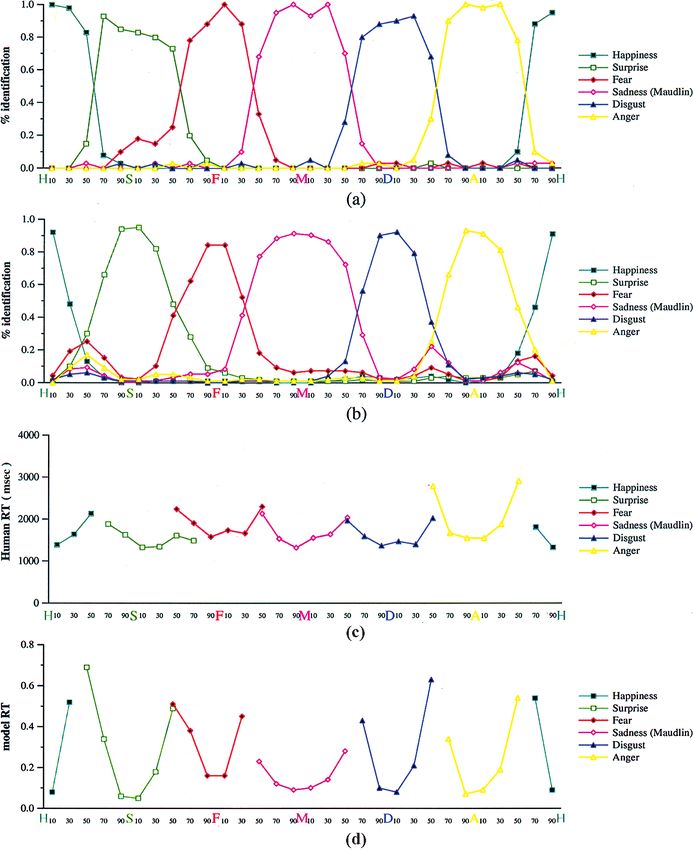
the emotion’s theme. But between families, the physi-                                     (ABX ) discrimination task in which stimulus ‘‘A’’ is
                ology, appraisal mechanisms, antecedents, and signals                                     shown, stimulus ‘‘B’’ is shown, then either ‘‘A’’ or ‘‘B’’
                differ in fundamental ways. Based on these criteria,                                      is shown and subjects are asked which of the first two
                Ekman proposes that there are 15 basic emotion fami-                                      stimuli the third matches. For categorically perceived
                lies: amusement, anger, contempt, contentment, dis-                                       stimuli, subjects show better discrimination when the
                gust, embarrassment, excitement, fear, guilt, pride in                                    two stimuli are near the category boundary defined by
                achievement, relief, sadness/distress, satisfaction, sen-                                 their labeling behavior, compared with two stimuli
                sory pleasure, and shame. The two crucial components                                      further from the boundary.
                of the theory, which distinguish it from other theorists’                                    In some cases, such as the color example, CP is

                                                                                                                                                                       Downloaded from http://mitprc.silverchair.com/jocn/article-pdf/14/8/1158/1757681/089892902760807177.pdf by guest on 18 May 2021
                approaches, are that emotions are fundamentally sepa-                                     thought to be an innate property of the perceptual
                rate from one another and that they evolved to help                                       system. But in other cases, perceptual discontinuities
                organisms deal with fundamental life tasks.                                               at category boundaries are clearly acquired through
                   On this view, since emotions are distinct, and each                                    learning. For instance, Beale and Keil (1995) created
                emotion family is accompanied by a small set of dis-                                      morph sequences between pairs of famous faces (e.g.,
                tinctive signals (facial expressions), we might expect                                    Clinton – Kennedy) and unfamiliar faces then had sub-
                subjects’ facial expression categorization behavior to                                    jects discriminate or categorize neighboring pairs of
                exhibit the characteristics of discrete, clear-cut deci-                                  faces along the morph sequence. They found that
                sions, not smooth, graded, fuzzy categorization. Evi-                                     famous face pairs exhibited category effects (increased
                dence that facial expressions are perceived as discrete                                   discrimination near the boundaries), but unfamiliar face
                entities, then, would be further evidence for the theory                                  pairs did not. Their result showed that CP can be
                of basic emotions and a deterministic expression/emo-                                     acquired through learning and is not limited to low-level
                tion mapping. Indeed, evidence of ‘‘categorical percep-                                   perceptual stimuli.
                tion’’ (CP) of facial expressions has recently emerged in                                    Etcoff and Magee (1992) were the first to raise the
                the literature.                                                                           question of whether the perceptual mechanisms respon-
                   In some domains, it appears that sensory systems                                       sible for facial expression recognition are actually tuned
                adapt to impose discontinuous category boundaries in                                      to emotion categories, or whether perception is contin-
                continuous stimulus spaces. For instance, in a rainbow,                                   uous, with category membership ‘‘assigned by higher
                we perceive bands of discrete colors even though the                                      conceptual and linguistic systems’’ ( p. 229). The authors
                light’s wavelength varies smoothly. In psychophysical                                     created caricatures (line drawings) of the Ekman and
                experiments, subjects have difficulty discriminating                                      Friesen (1976) photos and 10-step morphs between pairs
                between two shades of green differing by a small con-                                     of those caricatures. They included happy – sad, angry –
                stant wavelength distance, but find it easier to distin-                                  sad, and angry – afraid continua as easily discriminated
                guish between two stimuli the same distance apart but                                     category pairs. Surprised – afraid and angry – disgusted
                closer to the green / yellow boundary. This phenomenon                                    continua were included as less easily discriminated pairs.
                is called ‘‘categorical perception’’ (Harnad, 1987). It also                              Happy –neutral and sad – neutral continua were included
                occurs in auditory perception of phonemes. When we                                        to test for category boundaries along the dimension of
                listen to utterances varying continuously from a / ba/                                    presence or nonpresence of an emotion, and finally,
                sound to a /pa/ sound, we perceive a sudden shift from                                    happy – surprised continua were added to include a
                / ba / to /pa/, not a mixture of the two. As with colors, we                              transition between positive emotions. The authors found
                can also discriminate pairs of equidistant phonemes                                       that all expressions except surprise were perceived cat-
                better when they are closer to the perceived / ba / – / pa /                              egorically: In an ABX task, morph pairs straddling the
                boundary. In general, CP is assessed operationally in                                     50% category boundary were significantly better discri-
                terms of two behavioral measures, categorization judg-                                    minated than those closer to the prototypes, and in an
                ments and discrimination (same/different) judgments.                                      identification task, subjects placed sharp boundaries
                Categorization measures typically use a forced-choice                                     between categories, with significantly nonlinear category
                task, for example, selection of the / ba/ category or the                                 membership functions. Etcoff and Magee interpreted
                /pa/ category. The stimuli are randomly sampled from                                      these results as evidence for mandatory category assign-
                smoothly varying continua such as a step-by-step tran-                                    ment: ‘‘people cannot help but see the face as showing
                sition between / ba/ and /pa / prototypes. Even though                                    one or another kind of emotion’’ (p. 229). Their results
                subjects are not told that the data come from such                                        therefore pose a serious challenge for advocates of
                continua, they nevertheless label all stimuli on one side                                 a continuous space of emotions and rough emotion
                of some boundary as / ba/, and all stimuli on the other                                   expression correspondence.
                side as /pa /, suggesting a sharp category boundary. For                                     Etcoff and Magee’s (1992) provocative results led to
                the second behavioral measure of CP, discrimination,                                      further research exploring CP in facial expression rec-
                subjects are asked to make a ‘‘same/different’’ response                                  ognition. Some of the potential limitations of their
                to a pair of stimuli that are nearby on the continuum                                     study were that the stimuli were line drawings, not
                (simultaneous discrimination), or perform a sequential                                    image-quality faces, that each subject was only exposed

                                                                                                                                               Dailey et al.   1159

Downloaded from http://www.mitpressjournals.org/doi/pdf/10.1162/089892902760807177 by guest on 15 October 2021
to a single continuum, and that the discrimination egory learning, or (2) that subjects automatically label
results, being from a sequential (ABX ) task, might stimuli even when they are making a purely perceptual
reflect a short-term memory phenomenon rather than discrimination (Goldstone, 2000; Goldstone, Lippa, &
a perceptual phenomenon. In view of these limitations, Shiffrin, 2001; Pevtzow & Harnad, 1997; Tijsseling &
Calder, Young, Perrett, Etcoff, and Rowland (1996) Harnad, 1997 ). Findings of CP effects in facial expres-
extended and replicated the earlier experiments with sion stimuli raise the possibility that perception of facial
image-quality morphs. They produced several continua expressions is discrete in the same way that category
using the Ekman and Friesen (1976) photos (e.g., labeling is. Calder et al.’s experiments strengthened the
Ekman and Friesen prototypes and image-quality morph argument for CP of facial expressions, but the authors
Downloaded from http://mitprc.silverchair.com/jocn/article-pdf/14/8/1158/1757681/089892902760807177.pdf by guest on 18 May 2021
sequences produced in R. A.’s lab, see Figure 1). The shy away from Etcoff and Magee’s strong interpretation
authors first replicated Etcoff and Magee’s experiments that facial expression category assignment is man-
with new stimuli: image-quality happy – sad, angry –sad, datory. They propose instead that perhaps CP is
and angry – afraid sequences, each using a different ‘‘an emergent property of population coding in the
actor. A second experiment followed the same proce- nervous system’’ occurring whenever ‘‘populations of
dure except that each subject’s stimuli included morphs cells become tuned to distinct categories’’(p. 116). In
from four different actors. In a third experiment, they this article, we will show precisely how this can occur,
had subjects categorize stimuli from three different suggesting that Calder et al.’s hypothesis may indeed
expression continua employing a single actor (‘‘J. J.’’ be correct.
afraid – happy, happy –angry, and angry – afraid sequen-
ces). Finally, they had subjects perform a simultaneous
Continuous Emotion Space and Fuzzy Facial
discrimination (same/different) task. In the second
Expression Categories
experiment, for the happy – sad transitions, the authors
found that artifacts in morphing between a face with Other theorists hold that the relationship between
teeth and one without (a ‘‘graying’’ of the teeth as the emotions and facial expressions is not so categorical,
morph moves away from the happy prototype) helped discrete, or deterministic as the theory of basic emotions
subjects in the discrimination task. However, on the and the evidence for CP suggest. The notion that facial
whole, the results were consistent with CP: sharp expression perception is discrete is challenged by data
category boundaries and enhanced discrimination near showing that similarity judgments of these expressions
the boundaries, regardless of whether there was a single exhibit a graded, continuous structure.
or several continua present in the experiment and Schlosberg (1952), following up on the work of his
regardless of whether the sequential or simultaneous advisor ( Woodworth, 1938), found that emotion cate-
discrimination task was used. gory ratings and subjects’ ‘‘errors’’ (e.g., the likelihood of
In the psychological literature on categorization, CP their labeling a putatively disgusted expression as con-
effects are usually taken as evidence that (1) object tempt) could be predicted fairly accurately by arranging
representations are altered during the course of cat- the emotion categories around an ellipse whose major
Figure 1. (a) Example proto-
typical expressions of six basic
emotions and a neutral face for
actor ‘‘J. J.’’ in Ekman and
Friesen’s POFA (Ekman &
Friesen, 1976). ( b) Morphs
from fear to sadness and
happiness to disgust, generated
from the corresponding
prototypes.
1160 Journal of Cognitive Neuroscience Volume 14, Number 8
Downloaded from http://www.mitpressjournals.org/doi/pdf/10.1162/089892902760807177 by guest on 15 October 2021axis was pleasantness versus unpleasantness (exemplified categories. For instance, if the 2-D representation in
by happy and sad expressions) and whose minor axis Figure 9a adequately characterizes our perception of
was attention versus rejection (exemplified by surprise emotional facial expression stimuli, the midpoint of a
and disgust expressions). morph between happiness and fear should be perceived
More recently, Russell (1980) proposed a structural as a surprised expression. Categorical views of emo-
theory of emotion concepts with two dimensions, tional facial expressions, on the other hand, do not
pleasure and arousal. Russell and Bullock (1986) then necessarily predict confusion along morph transitions;
proposed that emotion categories are best thought of one would expect either sharp transitions between all
as fuzzy sets. A few facial expressions might have a pairs of categories or perhaps indeterminate regions
Downloaded from http://mitprc.silverchair.com/jocn/article-pdf/14/8/1158/1757681/089892902760807177.pdf by guest on 18 May 2021
membership of 1.0 (100%) in one particular category, between categories where no emotion is perceived.
and others might have intermediate degrees of mem- Furthermore, if the categorical view is correct, we might
bership in more than one category. On their view, the expect CP, in which subjects find it difficult to discrim-
facial expression confusion data supporting structural inate between members of the category and easy to
theories like Schlosberg’s (1952) reflected the overlap discriminate pairs of stimuli near category boundaries,
of these fuzzy categories. To test this concept, Russell as found in previous studies (Calder et al., 1996; Etcoff
and Bullock had subjects rate a variety of facial expres- & Magee, 1992). To test these contrasting predictions
sions for how well they exemplify categories like with an exhaustive set of expression transitions, Young
‘‘excited,’’ ‘‘happy,’’ ‘‘sleepy,’’ ‘‘mad,’’ and so forth. They et al. constructed image-quality morph sequences
found that the categories did indeed overlap, with peak between all pairs of the emotional expression proto-
levels of membership for Ekman’s basic emotion cate- types shown in Figure 1a. (Figure 1b shows example
gories occurring at Ekman’s prototypical expressions. A morph sequences produced in R. A.’s lab.)
similarity structure analysis (multidimensional scaling In Experiment 1, the authors had subjects identify the
[MDS]—see Figure 9 for an example) performed on emotion category in 10%, 30%, 50%, 70%, and 90%
the subjects’ ratings produced two dimensions highly morphs between all pairs of the six prototypical expres-
correlated with other subjects’ pleasure and arousal sions in Figure 1a. The stimuli were presented in
ratings. When asked to verify (yes or no) membership random order, and subjects were asked to perform a
of facial expression stimuli in various emotion concept six-way forced-choice identification. Experiment 2 was
categories, there was a high level of consensus for identical except that morphs between the emotional
prototypical expressions and less consensus for boun- expressions and the neutral prototype were added to
dary cases. Asking subjects to choose exemplars for a the pool, and ‘‘neutral’’ was one of the subjects’ choices
set of categories also revealed graded membership in a seven-way forced-choice procedure. The results of
functions for the categories. The data thus showed that Experiment 2 for 6 of the 21 possible transitions are
facial expression categories have systematically graded reprinted in Figure 2. In both experiments, along every
overlapping membership in various emotion categories. morph transition, subjects’ modal response to the stim-
On the basis of this evidence, Russell and Bullock uli abruptly shifted from one emotion to the other with
proposed that facial expression interpretation first no indeterminate regions or between. Consistent with
involves appraising the expression in terms of pleasure categorical theories of facial expressions, the subjects’
and arousal. Then the interpreter may optionally modal response was always one of the endpoints of the
choose a label for the expression. Following Schlosberg, morph sequence, never a nearby category. Subjects’
they proposed that finer, more confident judgments response times (RTs), however, were more consistent
require contextual information. with a multidimensional or weak category account of
This and additional recent research (Schiano, Ehrlich, facial expression perception: As distance from the pro-
Sheridan, & Beck, 2000; Katsikitis, 1997; Carroll & totypes increased, RTs increased significantly, presum-
Russell, 1996; Russell, 1980; Russell, Lewicka, & Niit, ably reflecting increased uncertainty about category
1989) suggests that there is a continuous, multidimen- membership near category boundaries.
sional perceptual space underlying facial expression In Experiment 3, Young et al. explored the extent to
perception in which some expression categories are which subjects could discriminate pairs of stimuli along
more similar to each other than others. the six transitions: happiness – surprise, surprise – fear,
fear – sadness, sadness – disgust, disgust– anger, anger –
happiness. They had subjects do both a sequential
Young et al.’s (1997) ‘‘Megamix’’ Experiments
discrimination task (ABX) and a simultaneous discrim-
Young et al. (1997) set out to further test the predic- ination task (same – different). Only the data from
tions of multidimensional and categorical accounts of the sequential experiments are now available, but the
facial expression perception and recognition. They authors report a very strong correlation between the two
pointed out that 2-D structural theories like Schlos- types of data (r = .82). The sequential data are reprinted
berg’s or Russell’s predict that some morph transitions in Figure 3. The main finding of the experiment was
between expression pairs should pass near other that subjects had significantly better discrimination
Dailey et al. 1161
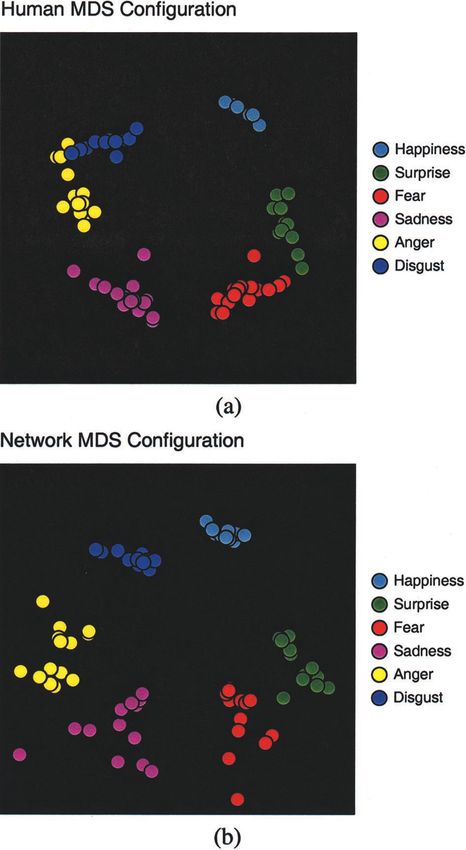
Downloaded from http://www.mitpressjournals.org/doi/pdf/10.1162/089892902760807177 by guest on 15 October 2021Figure 2. Selected results of
Young et al.’s (1997 ) Experi-
ment 2. (a) Human responses
(% identification in a seven-way
forced-choice task) to six
morph sequences: happy –
surprised, surprised – afraid,
afraid – sad, sad – disgusted,
disgusted – angry, and angry –
happy. Every transition exhib-
ited a sharp category boundary.
Downloaded from http://mitprc.silverchair.com/jocn/article-pdf/14/8/1158/1757681/089892902760807177.pdf by guest on 18 May 2021
(b) Modeling subjects’ choice as
a random variable distributed
according to the pattern of
activation at the network’s out-
put layer, which entails aver-
aging across the 13 networks’
outputs. The model has a cor-
relation (over all 15 transitions)
of r = .942 with the human
subjects. (c) RTs for the same
transitions in (a). RTs increased
significantly with distance from
the prototype. (M = sad; only 6
out of 21 possible transitions
are shown). (d) Predictions of
network ‘‘uncertainty’’ model
for the same morph transitions.
performance near the category boundaries than near the most apparent emotion, using a button box with a
expression prototypes, a necessary condition to claim button for each of the six emotion categories. After
CP. Experiment 3 therefore best supports the categorical correcting for intrinsic confusability of the emotion
view of facial expression perception. categories, the authors found that subjects were sig-
Finally, in Experiment 4, Young et al. set out to nificantly above chance at detecting the mixed-in emo-
determine whether subjects could determine what tion at the 30% level. As opposed to the identification
expression is ‘‘mixed-in’’ to a faint morph. Again, a and discrimination data from Experiments 1 – 3, this
strong categorical view of facial expressions would pre- result best supports continuous, dimensional accounts
dict that subjects should not be able to discern what of facial expression perception.
expression a given morph sequence is moving toward In summary, Young et al.’s experiments, rather than
until the sequence gets near the category boundary. settling the issue of categorical versus continuous the-
However, according to continuous theories, subjects ories of facial expression perception, found evidence
should be able to determine what prototype a sequence supporting both types of theory. The authors argue
is moving toward fairly early in the sequence. In the that a 2-D account of facial expression perception is
experiment, subjects were asked to decide, given a unable to account for all of the data, but they also
morph or prototype stimulus, the most apparent emo- argue that the strong mandatory categorization view is
tion, the second-most apparent emotion, and the third- likewise deficient.
1162 Journal of Cognitive Neuroscience Volume 14, Number 8
Downloaded from http://www.mitpressjournals.org/doi/pdf/10.1162/089892902760807177 by guest on 15 October 2021Until now, despite several years of research on auto- their Gabor wavelet-based representation of faces were
matic recognition of facial expressions, no computation- highly correlated with similarities obtained from the
al model has been shown to simultaneously explain all human data, and nonmetric multidimensional scaling
of these seemingly contradictory data. In the next sec- (MDS) revealed similar underlying 2-D configurations
tion, we review the recent progress in computational of the stimuli. The authors suggest in conclusion that
modeling of facial expression recognition, then intro- the high-level circumplex constructs proposed by
duce a new model that does succeed in explaining the authors like Schlosberg and Russell may in part reflect
available data. similarity at low levels in the visual system.
In a recent work, Calder et al. (2001) applied a
Downloaded from http://mitprc.silverchair.com/jocn/article-pdf/14/8/1158/1757681/089892902760807177.pdf by guest on 18 May 2021
different computational model to the task of under-
Computational Modeling of Facial Expression
standing human facial expression perception and rec-
Recognition
ognition. The idea of their system, originally proposed
Padgett and colleagues were the first to apply computa- by Craw and Cameron (1991), is to first encode the
tional models toward an understanding of facial expres- positions of facial features relative to the average face
sion perception (Cottrell, Dailey, Padgett, & Adolphs, then warp each face to the average shape (thus pre-
2000; Padgett, Cottrell, & Adolphs, 1996; Padgett & serving texture but removing between-subject face
Cottrell, 1998). Their system employed linear filtering shape variations). The shape information (the positions
of regions around the eyes and mouth followed by a of the facial features prior to warping) and the shape-
multilayer perception for classification into emotion free information (the pixel values after warping) can
categories. The system achieved good recognition per- each be submitted to a separate principal components
formance and was able to explain some of the results on analysis (PCA) for linear dimensionality reduction, pro-
CP of facial expressions with linear ‘‘dissolve’’ sequen- ducing separate low-dimensional descriptions of the
ces. However, the system was unable to account for the face’s shape and texture. Models based on this
sharp category boundaries humans place along image- approach have been successful in explaining psycholog-
quality morph transitions, because the linear filters’ ical effects in face recognition (Hancock, Burton, &
responses varied too quickly in the presence of the Bruce, 1996, 1998). However, warping the features in
nonlinear changes in morph transitions. It also would an expressive face to the average face shape would
have been incapable of predicting recently observed seem to destroy some of the information crucial to
evidence of holistic effects in facial expression recogni- recognition of that expression, so prior to Calder
tion (Calder, Young, Keane, & Dean, 2000). et al.’s work, it was an open question as to whether
Lyons et al. (1998) created a database of Japanese such a system could support effective classification of
female models portraying facial expressions of happi- facial expressions. The authors applied the Craw and
ness, surprise, fear, anger, sadness, and disgust. They Cameron PCA method to Ekman and Friesen’s (1976)
then had subjects rate the degree to which each face Pictures of Facial Affect (POFA) then used linear dis-
portrayed each basic emotion on a 1– 5 scale, and used criminant analysis to classify the faces into happy, sad,
Euclidean distance between the resulting ‘‘semantic afraid, angry, surprised, and disgusted categories. The
rating’’ vectors for each face pair as a measure of authors found that a representation incorporating both
dissimilarity. They then used a system inspired by the the shape information (feature location PCA) and the
Dynamic Link Architecture (Lades et al., 1993) to explain shape-free information (warped pixel PCA) best sup-
the human similarity matrix. Similarities obtained from ported facial expression classification (83% accuracy
Figure 3. Results of Young
et al.’s (1997 ) Experiment 3 for
the sequential (ABX ) discrimi-
nation task. Each point repre-
sents the percentage of time
subjects correctly discriminated
between two neighboring
morph stimuli. The x-axis labels
denote which pair of stimuli
were being compared (e.g.,
70/90 along the transition from
sadness to disgust denotes a
comparison of a 70% disgust /
30% sadness morph with a 90%
disgust /10% sadness morph).
Discrimination was significantly
better near the prototypes than
near the category boundaries.
Dailey et al. 1163
Downloaded from http://www.mitpressjournals.org/doi/pdf/10.1162/089892902760807177 by guest on 15 October 2021The Model
The system is a feed-forward network consisting of three
layers common to most object recognition models
(Riesenhuber & Poggio, 2000). Its input is a 240 by
292 manually aligned, grayscale face image from Ekman
and Friesen’s POFA (Ekman & Friesen, 1976). This data
set contains photos of 14 actors portraying expressions
that are reliably classified as happy, sad, afraid, angry,
surprised, or disgusted by naive observers (70% agree-
Downloaded from http://mitprc.silverchair.com/jocn/article-pdf/14/8/1158/1757681/089892902760807177.pdf by guest on 18 May 2021
ment was the threshold for inclusion in the data set,
and the overall agreement is 91.6%). The expressions
made by one of those actors, ‘‘J. J.,’’ are shown in
Figure 1a. The strong agreement across human sub-
Figure 4. Model schematic.
jects, together with the use of these photos in a wide
variety of psychological experiments exploring emo-
using leave-one-image-out classification for the Ekman tional expression perception, makes POFA an ideal
and Friesen database). The authors went on to compare training set for our model.
their system with human data from psychological exper- The first layer of the model is a set of neurons whose
iments. They found that their system behaved similarly response properties are similar to those of complex cells
to humans in a seven-way forced-choice task and that in the visual cortex. The so-called Gabor filter (Daug-
the principal component representation could be used man, 1985) is a standard way to model complex cells in
to predict human ratings of pleasure and arousal (the visual recognition systems (Lades et al., 1993). Figure 5
two dimensions of Russell’s circumplex). shows the spatial ‘‘receptive fields’’ of several filters. The
Taken together, results with the above three compu- units essentially perform nonlinear edge detection at
tational models of facial expression recognition begin to five scales and eight orientations. As a feature detector,
hint that subjects’ performance in psychological experi- the Gabor filter has the advantage of moderate trans-
ments can be explained as a simple consequence of lation invariance over pixel-based representations. This
category learning and the statistical properties of the means that features can ‘‘move’’ in the receptive field
stimuli themselves. Although Calder et al.’s system without dramatically affecting the detector’s response,
exhibits a surprising amount of similarity to human making the first layer of our model robust to small image
performance in a forced-choice experiment, it has changes. With a 29 by 35 grid and 40 filters at each grid
not been brought to bear in the debate on multi- location, we obtain 40,600 model neurons in this layer,
dimensional versus CP of facial expressions. In the which we term the ‘‘perceptual’’ layer.
present article, we show that a new, more biologically In order to extract a small set of informative features
plausible computational model not only exhibits more from this high-dimensional data, we use the equivalent
similarity to human forced-choice performance, but of an ‘‘image compression’’ network (Cottrell, Munro, &
also provides a detailed computational account of data Zipser, 1989). This is a back propagation network that is
supporting both categorical and multidimensional the- trained to simply reproduce its input on its output
ories of facial expression recognition and perception. through a narrow channel of hidden units. In order to
Our simulations consist of constructing and training a solve this problem, the hidden units must extract regu-
simple neural network model (Figure 4); the system larities from the data. Since they are fully connected to
uses the same stimuli employed in many psychological the inputs, they usually extract global representations
experiments, performs many of the same tasks, and we have termed ‘‘holons’’ in previous work (Cottrell &
can be measured in similar ways as human subjects. Metcalfe, 1991). We note that this is a biologically
The model consists of three levels of processing: plausible means of dimensionality reduction in the sense
perceptual analysis, object representation, and catego- that it is unsupervised and can be learned by simple
rization. The next section describes the model in networks employing Hebbian learning rules (Sanger,
some detail. 1989). As a shortcut, we compute this network’s weights
Figure 5. Example Gabor
filters. The real (cosine shaped)
component is shown relative to
the size of the face at all five
scales and five of the eight
orientations used.
1164 Journal of Cognitive Neuroscience Volume 14, Number 8
Downloaded from http://www.mitpressjournals.org/doi/pdf/10.1162/089892902760807177 by guest on 15 October 2021directly via the equivalent statistical technique of PCA. purposes; as we shall see, despite the simplifying
We chose 50 principal components (hidden units) for assumptions of the model, it nevertheless accounts
this layer based on previous experiments showing this for a wide variety of data available from controlled
leads to good generalization on POFA. It is important to behavioral experiments. This suggests that it is a good
note that the number of components (the only free first-order approximation of processing at the computa-
parameter in our system) was not tuned to human data. tional level in the visual system.
The resulting low-dimensional object-level representa- The next section reports on the results of several
tion is specific to the facial expression and identity experiments comparing the model’s predictions to
variations in its input, as is the population of so-called human data from identical tasks, with special emphasis
Downloaded from http://mitprc.silverchair.com/jocn/article-pdf/14/8/1158/1757681/089892902760807177.pdf by guest on 18 May 2021
face cells in the inferior temporal cortex (Perrett, Hieta- on Young et al.’s landmark study of categorical effects in
nen, Oram, & Benson, 1992). We term this layer of facial expression perception (Young et al., 1997). We
processing the ‘‘gestalt’’ level. find (1) that the model and humans find the same
Although PCA is one of the simplest and most expressions difficult or easy to interpret; (2) that when
efficient methods for coding a set of stimuli, other presented with morphs between pairs of expressions,
methods would probably also work. For the current the model and humans place similar sharp category
model, it is only important that (1) the code be boundaries between the prototypes; (3) that pairwise
sensitive to the dimensions of variance in faces, to similarity ratings derived from the model’s gestalt-level
facilitate learning of expressions, and that (2) the code representations predict human discrimination ability; (4)
be low dimensional, to facilitate generalization to novel that the model and humans are similarly sensitive to
faces. In a more general object recognition system, a mixed-in expressions in morph stimuli; and (5) that MDS
single PCA for all kinds of objects would probably not analysis produces a similar emotional similarity structure
be appropriate, because the resulting code would not from the model and human data.
be sparse (a single image normally activates a large
number of holistic ‘‘units’’ in a PCA representation, but
object-sensitive cells in the visual system appear to RESULTS
respond much more selectively; Logothetis & Shein-
berg, 1996). To obtain a good code for a large number Comparison of Model and Human Performance
of different objects, then, nonnegative matrix factoriza- The connections in the model’s final layer were trained
tion (Lee & Seung, 1999) or an independent compo- to classify images of facial expressions from Ekman and
nent mixture model (Lee, Lewicki, & Sejnowski, 2000) Friesen’s POFA database (see Figure 1a) (Ekman &
might be more appropriate. For the current problem, Friesen, 1976), the standard data set used in the vast
though, PCA suffices. majority of psychological research on facial expression
The outputs of the gestalt layer are finally categorized (see Methods for details). The training signal contained
into the six ‘‘basic’’ emotions by a simple perceptron no information aside from the expression most agreed
with six outputs, one for each emotion. The network is upon by human observers—that is, even if 90% of
set up so that its outputs can be interpreted as proba- human observers labeled a particular face ‘‘happy’’
bilities (they are all positive and sum to 1). However, the and 10% labeled it ‘‘surprised,’’ the network was trained
system is trained with an ‘‘all-or-none’’ teaching signal. as if 100% had said ‘‘happy.’’ Again, there is no infor-
That is, even though only 92% (say) of the human mation in the training signal concerning the similarity of
subjects used to vet the POFA database may have different expression categories. The first measurement
responded ‘‘happy’’ to a particular face, the network’s we made was the model’s ability to generalize in classi-
teaching signal is 1 for the ‘‘happy’’ unit, and 0 for the fying the expressions of previously unseen subjects from
other five. Thus, the network does not have available the same database. The model’s mean generalization
to it the confusions that subjects make on the data. performance was 90.0%, which is not significantly differ-
We term this layer the ‘‘category’’ level. ent from human performance on the same stimuli
While this categorization layer is an extremely simplis- (91.6%; t = .587, df = 190, p = .279) (Table 1). More-
tic model of human category learning and decision- over, the rank-order correlation between the model’s
making processes, we argue that the particular form of average accuracy on each category (happiness, surprise,
classifier is unimportant; so long as it is sufficiently fear, etc.), and the level of human agreement on the
powerful and reliable to place the gestalt-level represen- same categories was .667 (two-tailed Kendall’s tau,
tations into emotion categories, we claim that similar p = .044; cf. Table 1). For example, both the model
results will obtain with any nonlinear classifier. and humans found happy faces easy and fear faces the
We should also point out that the system abstracts most difficult to categorize correctly.1 Since the network
away many important aspects of visual processing in had about as much experience with one category as
the brain, such as eye movements, facial expression another, and was not trained on the human response
dynamics, size, and viewpoint invariance. These com- accuracies, this correlation between the relative difficul-
plicating factors turn out to be irrelevant for our ties of each category is an ‘‘emergent’’ property of the
Dailey et al. 1165
Downloaded from http://www.mitpressjournals.org/doi/pdf/10.1162/089892902760807177 by guest on 15 October 2021Table 1. Error Rates for Networks and Level of Agreement
smaller contribution of parted lips. The anger unit
for Humans
apparently requires a display in which the eyebrows
Network Percentage Human Percentage are not raised. Clearly, the classifier has determined
Expression Correct Correct which feature configurations reliably distinguish each
Happiness 100.0 98.7 expression from the others.
Surprise 100.0 92.4
Comparison on CP Data
Disgust 100.0 92.3
Anger 89.1 88.9 Several studies have reported CP of facial expressions
Downloaded from http://mitprc.silverchair.com/jocn/article-pdf/14/8/1158/1757681/089892902760807177.pdf by guest on 18 May 2021
using morphs between portrayals of the six basic emo-
Sadness 83.3 89.2 tions by POFA actor ‘‘J. J.,’’ whose images have been
Fear 67.2 87.7 chosen because his expressions are among the easiest to
recognize in the database (Young et al., 1997; Calder
Average 90.0 91.6
et al., 1996). Since our model also finds J. J. ‘‘easy’’
Network generalization to unseen faces, compared with human (it achieves 100% generalization accuracy on J. J.’s pro-
agreement on the same faces (six-way forced choice). Human data totypical expressions), we replicated these studies with
are provided with the POFA database (Ekman & Friesen, 1976).
13 networks that had not been trained on J. J.2
We first compared the model’s performance with
model. Studies of expression recognition consistently human data from a six-way forced-choice experiment
find that fear is one of the most difficult expressions to (Young et al., 1997), on 10%, 30%,50%, 70%, and 90%
recognize (Katsikitis, 1997; Matsumoto, 1992; Ekman & morphs we constructed (see Methods) between all
Friesen, 1976). Our model suggests that this is simply pairs of J. J.’s prototypical expressions (see Figure 1b
because the fear expression is ‘‘inherently’’ difficult to for two such morph sequences). We modeled the
distinguish from the other five expressions. subjects’ identification choices by letting the outputs
How does the network perform the expression rec- of the networks represent the probability mass function
ognition task? An examination of the trained network’s for the human subjects’ responses. This means that we
representation provides some insight. We projected averaged each of the six outputs of the 13 networks for
each unit’s weight vector back into image space in order each face and compared these numbers to the human
to visualize the ‘‘ideal’’ stimulus for each unit in the subjects’ response probabilities. Figure 2 compares the
network (see Methods for details). The results are networks’ forced-choice identification performance
shown in Figure 6, with and without addition of the with that of humans on the same stimuli. Quantita-
average face. In each of the images, each pixel value is tively, the model’s responses were highly correlated
the result of applying a regression formula predicting with the human data (r = .942, p < .001), and
the value of the pixel at that location as a linear function qualitatively, the model maintained the essential fea-
of the 50-element weight vector for the given network tures of the human data: abrupt shifts in classification
output unit. Dark and bright spots indicate the features at emotion category boundaries, and few intrusions
that excite or inhibit a given output unit depending on (identifications of unrelated expressions) along the
the relative gray values in the region of that feature. transitions. Using the same criteria for an intrusion
Each unit appears to combine evidence for an emotion that Young et al. (1997) used, the model predicted 4
based upon the presence or absence of a few local intrusions in the 15 morph sequences, compared to 2
features. For instance, for fear, the salient criteria appear out of 15 in the human data. Every one of the
to be the eyebrow raise and the eyelid raise, with a intrusions predicted by the model involved fear, which
Figure 6. Network representa-
tion of each facial expression.
(Top row) Approximation of
the optimal input-level stimulus
for each facial expression
category. (Bottom row) The
same approximations with the
average face subtracted—dark
and bright pixels indicate
salient features.
1166 Journal of Cognitive Neuroscience Volume 14, Number 8
Downloaded from http://www.mitpressjournals.org/doi/pdf/10.1162/089892902760807177 by guest on 15 October 2021is the least reliably classified expression in the POFA faces at the pixel level (correlation between the raw
database, for humans and networks (Table 1). images), the perceptual level (correlation between the
We also compared subjects’ RTs to those of the net- Gabor filter responses), the gestalt level (correlation
work, in which we model RT as being proportional to between the principal components), or the categoriza-
uncertainty at the category level. That is, if the network tion level (correlation between the six outputs). We
outputs a probability of .9 for happiness, we assume it is compared our measure of discriminability with human
more certain and therefore faster than when it outputs a performance in Young et al.’s (1997) ABX experiment
probability of .6 for happiness. We thus use the differ- (see Methods for details). We found the following
ence between 1 (the maximum possible output) and the correlations at each processing level. Pixel: r = .35,
Downloaded from http://mitprc.silverchair.com/jocn/article-pdf/14/8/1158/1757681/089892902760807177.pdf by guest on 18 May 2021
largest actual output as our model of the reaction time. p = .06; perceptual: r = .52, p = .003; gestalt: r = .65,
As explained earlier, subjects’ RTs exhibit a characteristic p < .001 (shown in Figure 7b); category: r = .41, p = .02.
scalloped shape, with slower RTs near category bounda- Crucially, when the gestalt layer and the categorization
ries. The model also exhibits this pattern, as shown in layer were combined in a multiple regression, the cate-
Figure 2. The reason should be obvious: As a sequence gorization layer’s contribution was insignificant ( p = .3),
of stimuli approaches a category boundary, the net- showing that the explanatory power of the model rests
work’s output for one category necessarily decreases with the gestalt layer. According to our model, then,
as the other increases. This results in a longer model RT. human subjects’ improved discrimination near category
The model showed good correlation with human RTs boundaries in this task is best explained as an effect at
(see Methods) (r = .677, p < .001). the level of gestalt-based representations, which were
The model also provides insight into human discrim- derived in an unsupervised way from Gabor represen-
ination behavior. How can a model that processes one tations via PCA. This is in sharp contrast to the stand-
face at a time discriminate faces? The idea is to imagine ard explanation of this increased sensitivity, which is
that the model is shown one face at a time and stores its that categorization influences perception (Goldstone
representation of each face for comparison. We use the et al., 2001; Pevtzow & Harnad, 1997). This suggests
correlation (Pearson’s r) between representations as a that the facial expression morph sequences have natu-
measure of similarity, and then use 1 minus this number ral boundaries, possibly because the endpoints are
as a measure of discriminability. An interesting aspect of extremes of certain coordinated muscle group move-
our model is that it has several independent levels of ments. In other domains, such as familiar face classi-
processing (see Figure 4), allowing us to determine fication (Beale & Keil, 1995), the boundaries must arise
which level best accounts for a particular phenomenon. through learning. In such domains, we expect that
In this case, we compute the similarity between two discrimination would be best explained in a learned
Figure 7. Discrimination of
morph stimuli. (a) Percent cor-
rect discrimination of pairs of
stimuli in an ABX task (Young
et al., 1997 ). Each point repre-
sents the percentage of time
subjects correctly discriminated
between two neighboring
morph stimuli. The x-axis labels
to the left and right of each
point show which two stimuli
were being compared; (e.g.,
70/90 along the transition from
sadness to disgust denotes a
comparison of a 70% disgust /
30% sadness morph with a 90%
disgust / 10% sadness morph).
Note that better performance
occurs near category bound-
aries than near prototypes
( highlighted by the vertical
lines). ( b) The model’s discri-
mination performance at the
gestalt representation level.
The model discrimination
scores are highly correlated
with the human subjects’ scores
(r = .65, p < .001).
Dailey et al. 1167
Downloaded from http://www.mitpressjournals.org/doi/pdf/10.1162/089892902760807177 by guest on 15 October 2021cessing shown in Figure 4. At the pixel level, we found
that the structure present in the MDS configuration
was based mainly on identity, and as we moved toward
the categorization level, the identity-based structure
began to break down, and expression-related clusters
began to emerge. Unsurprisingly, at the network’s cat-
egorization layer, the configuration was clearly organ-
ized by emotion category (Figure 9). Of more interest,
however, is that the ‘‘ordering’’ of facial expressions
Downloaded from http://mitprc.silverchair.com/jocn/article-pdf/14/8/1158/1757681/089892902760807177.pdf by guest on 18 May 2021
around the human and network MDS configurations
is the same, a result unlikely to have arisen by chance
Figure 8. Ability to detect mixed-in expression in morph sequences,
for humans and the model. In the human data (dashed lines), subjects
chose the far prototype (the faint second expression in the morph)
significantly more often than unrelated expressions when that
expression’s mix ratio was 30% or greater, even though they
consistently identified the 70% expression in forced-choice experi-
ments. The model is almost identical to the humans in its ability to
detect the secondary expression in a morph image.
feature layer, as in other models (Goldstone, 2000;
Tijsseling & Harnad, 1997).
The data above show that the model naturally
accounts for categorical behavior of humans making
forced-choice responses to facial expression morph
stimuli. In another experiment, Young et al. (1997)
found that subjects could reliably detect the expres-
sion mixed into a morph even at the 30% level. Can
the model also account for this decidedly noncategor-
ical behavior? In the experiment, subjects were asked
to decide, given a morph or prototype stimulus, the
most apparent emotion, the second-most apparent
emotion, and the third-most apparent emotion (the
scores on prototypes were used to normalize for inher-
ent expression similarity). To compare the human
responses with the model, we used the top three out-
puts of the 13 networks, and used the same analysis as
Young et al. to determine the extent to which the
network could detect the mixed-in expression in the
morph images (see Methods for details). Figure 8 shows
that the model’s average sensitivity to the mixed-in
expression is almost identical to that of human subjects,
even though its behavior seems categorical in forced-
choice experiments.
Comparison of Similarity Structures
We next investigated the similarity structure of the
representations that the model produced. As before, Figure 9. Multidimensional scaling of human and network responses
we calculated the similarity between pairs of faces at reveals similar dimensions of emotion. Each point represents one of
each level of the network by computing the correlation the 96 expressive faces in POFA. (a) 2-D similarity space induced by
between their representations. In order to evaluate the MDS from the average six-way forced-choice responses of human
similarity structure qualitatively, we performed MDS subjects (Ekman & Friesen, 1976) (stress = 0.218). ( b) 2-D similarity
space induced by MDS from the average training set responses of
both on the human forced-choice responses published networks at their output layers (stress = 0.201). The arrangement of
by Ekman and Friesen (1976) and on the network’s emotions around the circle is the same in both cases. Stress at the pixel
responses to the same stimuli, at each level of pro- level was 0.222, the perceptual level 0.245, and the gestalt level 0.286.
1168 Journal of Cognitive Neuroscience Volume 14, Number 8
Downloaded from http://www.mitpressjournals.org/doi/pdf/10.1162/089892902760807177 by guest on 15 October 2021( p = 1/60 = .017 ). Given that the network was never humans to classify? Could it be that true displays of
given any similarity information, this is a remarkable fear are uncommon in our society? Or that portrayals of
result. It suggests that the human similarity structure fear in the popular culture misguide us as to what
is a simple result of the inherent confusability of the fearful people really look like? Or simply that fear
categories, not necessarily the result of locality in some expressions are perceptually similar to other expres-
underlying psychological emotion space, as dimen- sions? Our results suggest that the latter is the case—
sional theories (e.g., Russell, 1980; Russell et al., culture probably has very little to do with the difficulty
1989) might predict. of fear expressions. We have shown that perceptual
To measure the similarity between the human and similarity alone is sufficient to account for the relative
Downloaded from http://mitprc.silverchair.com/jocn/article-pdf/14/8/1158/1757681/089892902760807177.pdf by guest on 18 May 2021
network category structures quantitatively, we com- difficulty of facial expressions.
pared the human and model confusion matrices directly. The agreement between human and network similar-
For each pair of expressions, we computed the proba- ity structure analyses (MDS) is also somewhat surprising.
bility pij that humans or networks respond with emotion As pointed out earlier, Russell and colleagues have found
i when the intended emotion is j for all i 6¼ j, that is, the that affective adjectives and affective facial expressions
probability of confusion between two categories. The seem to share a common similarity structure. One might
correlation between networks and humans on the net- postulate that the underlying psychological space
works’ test sets (the stimuli the networks had never reflects the physiological similarity of emotional states,
seen before) was .661 ( p < .001).3 Thus, there is a close and that when we are asked to classify facial expressions,
correspondence between human confusion rates and we are likely to classify a given face as any of the
response distributions at the model’s categorization emotions close by in that psychophysiological space.
level. The system is never instructed to confuse the However, we have shown that an emotionless machine,
categories in a way similar to humans; nevertheless, this without any underlying physiology, exhibits a similarity
property emerges naturally from the data. structure very much like that of the humans. This is even
more remarkable when one considers that the network
was not given any indication of the similarity structure in
DISCUSSION
the training signal, which was always all-or-none, rather
In this article, we have introduced a computational than, for example, human subject responses, which
model that mimics some of the important functions of would reflect subjects’ confusions. Since we nevertheless
the visual system. The model is simply a pattern classifier match the human similarity structure, we have shown
incorporating a biologically plausible representation of that the perceptual similarity of the categories corre-
visual stimuli. We first engineered the system to provide sponds to the psychological similarity structure of facial
good classification performance on a small database of expressions. Why would this be? We suggest that evolu-
reliably recognizable facial expressions. The free param- tion did not randomly associate facial expressions with
eters of the model, such as the number of principal emotional states, but that the expression-to-emotion
components used in dimensionality reduction, were mapping evolved in tandem with the need to communi-
optimized to maximize the classifier’s generalization cate emotional states effectively.
performance. In contrast to most models in mathemat- The final question we set out to explore with this
ical psychology, which seek to fit a low number of free work is whether facial expressions are represented
parameters to maximize a model’s agreement with continuously or as discrete entities. As explained in
human data, our model is compared to human data the Introduction, the best evidence for discrete repre-
directly without any tuning. sentations is that subjects appear to place sharp boun-
The results of our comparison of the model’s per- daries between facial expression categories and are
formance with human data were nevertheless remark- better able to discriminate pairs of expressions near
able. We first found that the relative levels of difficulty category boundaries, suggesting that our perception of
for six basic facial expressions of emotion were highly the faces is influenced by the existence of the catego-
correlated with the levels at which humans agree on ries. As has been found in other modalities (cf. Ellison
those same emotions. For example, humans are best at & Massaro, 1997), we find that it is unnecessary to
classifying happy expressions because the smile makes posit discrete representations to account for the sharp
the task easy. The network model likewise finds it boundaries and high discrimination scores. The net-
extremely easy to detect smiles because they are work model places boundaries between categories, as
obvious visual features that discriminate happy expres- it must to obtain good classification accuracy, but the
sions from the rest of the faces in its training set. On categories are actually fuzzy and overlapping. The
the other hand, humans usually find that fear expres- model can be thought of as a biologically plausible,
sions are very difficult to classify. Fear expressions are working implementation of Russell and Bullock’s
often classified as surprise, for instance. The network (1986) theory of emotional facial expression categories
model likewise sometimes classifies fear expressions as as fuzzy concepts. Despite the network’s fuzzy, over-
surprise. Why are fear expressions so difficult for lapping category concepts, the categories appear
Dailey et al. 1169
Downloaded from http://www.mitpressjournals.org/doi/pdf/10.1162/089892902760807177 by guest on 15 October 2021You can also read