Empire Knight Screening Level Risk Assessment Package
←
→
Page content transcription
If your browser does not render page correctly, please read the page content below
Office of National Marine Sanctuaries
Office of Response and Restoration

       Screening Level Risk Assessment Package
                                        Empire Knight

                                                        March 2013
National Oceanic and
Atmospheric Administration

Office of National Marine Sanctuaries
Daniel J. Basta, Director
Lisa Symons
John Wagner

Office of Response and Restoration
Dave Westerholm, Director
Debbie Payton
Doug Helton

Photo: Photograph of Empire Knight
Source: http://www.wreckhunter.net/images/EmpireKnight-Clancy2.jpg
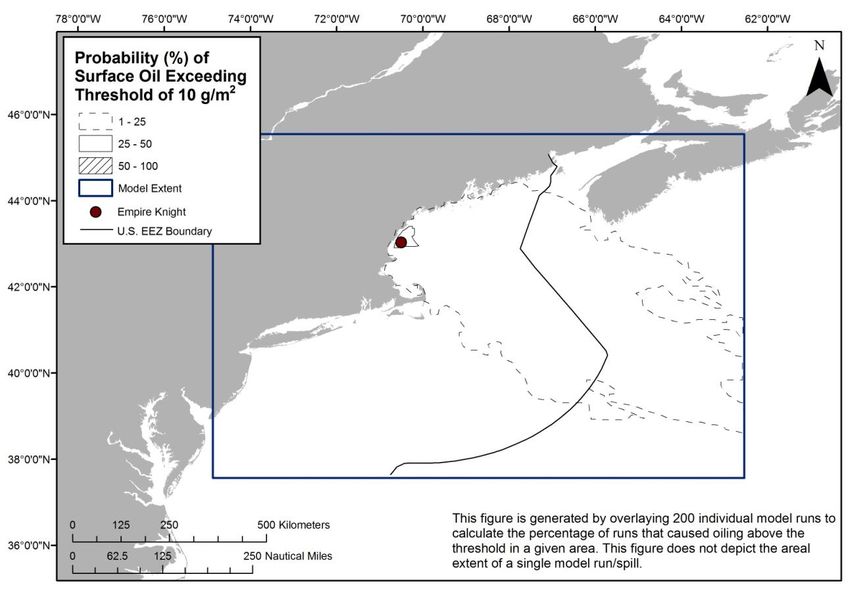
Table of Contents
Project Background .......................................................................................................................................ii

Executive Summary ......................................................................................................................................1

Section 1: Vessel Background Information: Remediation of Underwater Legacy
        Environmental Threats (RULET).....................................................................................................2
  Vessel Particulars .........................................................................................................................................2
  Casualty Information.....................................................................................................................................3
  Wreck Location .............................................................................................................................................4
  Casualty Narrative ........................................................................................................................................4
  General Notes ..............................................................................................................................................4
  Wreck Condition/Salvage History ................................................................................................................5
  Archaeological Assessment .........................................................................................................................5
  Assessment ..................................................................................................................................................5
  Background Information References ............................................................................................................7
  Vessel Risk Factors ......................................................................................................................................7

Section 2: Environmental Impact Modeling ...............................................................................................14
  Release Scenarios Used in the Modeling ...................................................................................................14
  Oil Type for Release ...................................................................................................................................15
  Oil Thickness Thresholds ............................................................................................................................15
  Potential Impacts to the Water Column .......................................................................................................16
  Potential Water Surface Slick ......................................................................................................................17
  Potential Shoreline Impacts.........................................................................................................................20

Section 3: Ecological Resources At Risk ..................................................................................................23
  Ecological Risk Factors ...............................................................................................................................24

Section 4: Socio-Economic Resources At Risk ........................................................................................30
 Socio-Economic Risk Factors .....................................................................................................................33

Section 5: Overall Risk Assessment and Recommendations for Assessment,
           Monitoring, or Remediation.......................................................................................................38

                                                                                      i
Project Background
The past century of commerce and warfare has left a legacy of thousands of sunken vessels along the U.S.
coast. Many of these wrecks pose environmental threats because of the hazardous nature of their cargoes,
presence of munitions, or bunker fuel oils left onboard. As these wrecks corrode and decay, they may
release oil or hazardous materials. Although a few vessels, such as USS Arizona in Hawaii, are well-
publicized environmental threats, most wrecks, unless they pose an immediate pollution threat or impede
navigation, are left alone and are largely forgotten until they begin to leak.

In order to narrow down the potential sites for inclusion into regional and area contingency plans, in
2010, Congress appropriated $1 million to identify the most ecologically and economically significant
potentially polluting wrecks in U.S. waters. This project supports the U.S. Coast Guard and the Regional
Response Teams as well as NOAA in prioritizing threats to coastal resources while at the same time
assessing the historical and cultural significance of these nonrenewable cultural resources.

The potential polluting shipwrecks were identified through searching a broad variety of historical sources.
NOAA then worked with Research Planning, Inc., RPS ASA, and Environmental Research Consulting to
conduct the modeling forecasts, and the ecological and environmental resources at risk assessments.

Initial evaluations of shipwrecks located within American waters found that approximately 600-1,000
wrecks could pose a substantial pollution threat based on their age, type and size. This includes vessels
sunk after 1891 (when vessels began being converted to use oil as fuel), vessels built of steel or other
durable material (wooden vessels have likely deteriorated), cargo vessels over 1,000 gross tons (smaller
vessels would have limited cargo or bunker capacity), and any tank vessel.

Additional ongoing research has revealed that 87 wrecks pose a potential pollution threat due to the
violent nature in which some ships sank and the structural reduction and demolition of those that were
navigational hazards. To further screen and prioritize these vessels, risk factors and scores have been
applied to elements such as the amount of oil that could be on board and the potential ecological or
environmental impact.

                                                     ii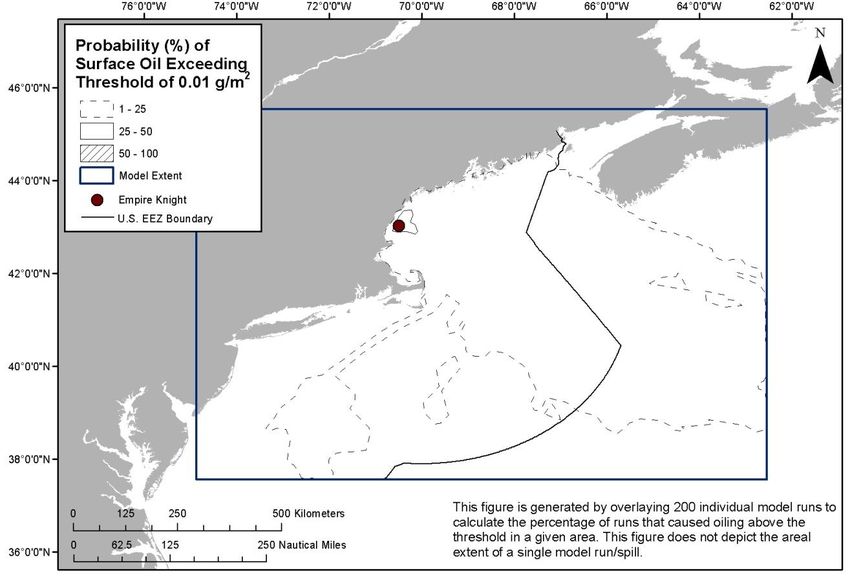
Executive Summary: Empire Knight
The freighter Empire Knight, grounded
and sunk in 1944 off the coast of Maine
in 1944, was identified as a potential
pollution threat, thus a screening-level
risk assessment was conducted. The
different sections of this document
summarize what is known about the
Empire Knight, the results of
environmental impact modeling
composed of different release
scenarios, the ecological and socio-
economic resources that would be at
risk in the event of releases, the
screening-level risk scoring results and
overall risk assessment, and
recommendations for assessment, monitoring, or remediation.

                                                                        Vessel Risk Factors                           Risk Score
 Based on this screening-level assessment, each
                                                                            A1: Oil Volume (total bbl)
vessel was assigned a summary score calculated
                                                                            A2: Oil Type
using the seven risk criteria described in this
                                                                            B: Wreck Clearance
report. For the Worst Case Discharge, Empire              Pollution
                                                          Potential         C1: Burning of the Ship                      Med
Knight scores Low with 11 points; for the Most            Factors
                                                                            C2: Oil on Water
Probable Discharge (10% of the Worse Case                                   D1: Nature of Casualty
volume), Empire Knight also scores Low with 10                              D2: Structural Breakup
points. Given the low scores for both Worst Case          Archaeological
                                                                            Archaeological Assessment                 Not Scored
Discharge and a Most Probable Discharge for the           Assessment
                                                                            Wreck Orientation
Empire Knight, and the higher level of data
                                                                            Depth
certainty about the vessel, NOAA recommends
                                                                            Confirmation of Site Condition
that this site be noted in the Area Contingency           Operational
                                                                            Other Hazardous Materials                 Not Scored
Plans as necessary to answer future questions             Factors
                                                                            Munitions Onboard
about the pollution risks associated with this
                                                                            Gravesite (Civilian/Military)
particular vessel, and that if a mystery spill is
                                                                            Historical Protection Eligibility
reported in the general area, this vessel could be
                                                                                                                WCD       MP (10%)
investigated as a source. Should additional
                                                                            3A: Water Column Resources          Med            Med
information become available that would suggest a         Ecological
                                                                            3B: Water Surface Resources         Med            Low
greater level of concern, then an active monitoring       Resources
                                                                            3C: Shore Resources                 Low            Low
program could be implemented or an assessment
                                                                            4A: Water Column Resources          Low            Low
undertaken. Outreach efforts with commercial and          Socio-
                                                          Economic          4B: Water Surface Resources         Med            Med
recreational fishermen who pass by the area would         Resources
                                                                            4C: Shore Resources                 Low            Low
be helpful to gain awareness of any significant
                                                          Summary Risk Scores                                    11            10
changes or further deterioration of the site.
                                                      The determination of each risk factor is explained in the document.
                                                      This summary table is found on page 39.

                                                      1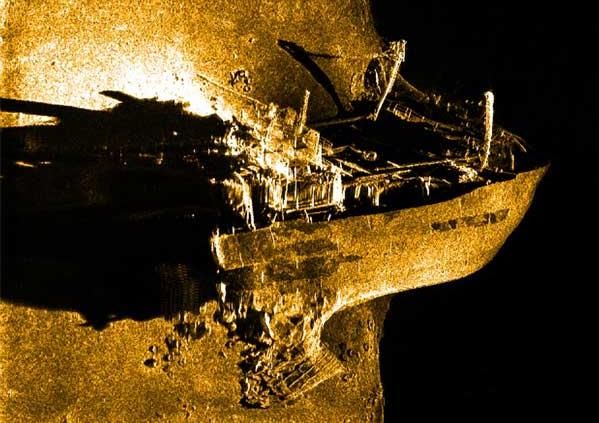
Section 1: Vessel Background Information: Remediation of Underwater Legacy Environmental Threats (RULET)

  SECTION 1: VESSEL BACKGROUND INFORMATION: REMEDIATION OF
         UNDERWATER LEGACY ENVIRONMENTAL THREATS (RULET)

Vessel Particulars

Official Name: Empire Knight

Official Number: 169017

Vessel Type: Freighter

Vessel Class: British Liberty Ship

Former Names: N/A

Year Built: 1942

Builder: William Doxford & Sons, Ltd., Sunderland

Builder’s Hull Number: Unknown

Flag: British

Owner at Loss: Ministry of War Transport (Buries Markes, Ld. Managers)

Controlled by: Unknown                                                            Chartered to: Unknown

Operated by: Unknown

Homeport: Sunderland

Length: 428 feet                              Beam: 56 feet                                  Depth: 35 feet

Gross Tonnage: 7,244                                                                   Net Tonnage: 5,099

Hull Material: Steel                    Hull Fastenings: Riveted                  Powered by: Oil engines

Bunker Type: Marine Diesel                                              Bunker Capacity (bbl): Unknown

Average Bunker Consumption (bbl) per 24 hours: Unknown

Liquid Cargo Capacity (bbl): Unknown                                      Dry Cargo Capacity: Unknown

Tank or Hold Description: Unknown

                                                     2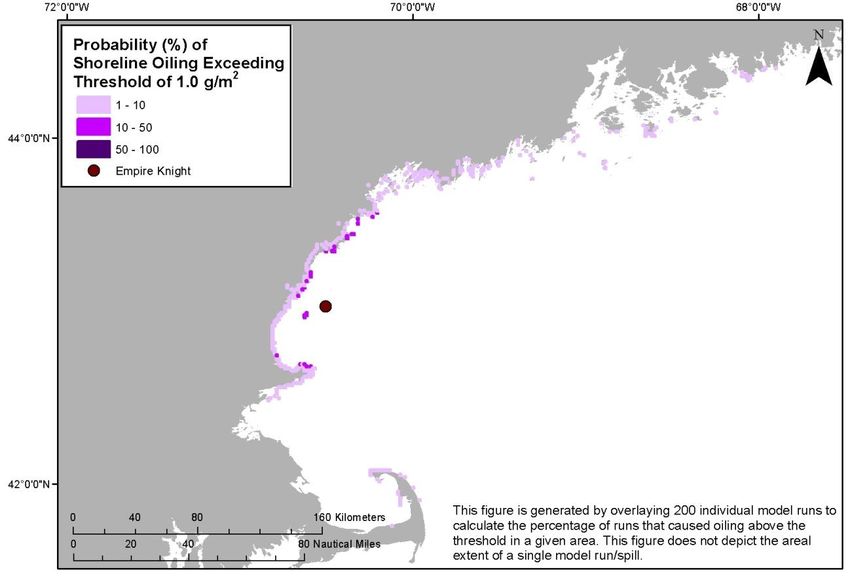
Section 1: Vessel Background Information: Remediation of Underwater Legacy Environmental Threats (RULET)

Casualty Information

Port Departed: St. John, New Brunswick, Canada                                Destination Port: New York

Date Departed: Unknown                                                       Date Lost: February 11, 1944

Number of Days Sailing: Unknown                                              Cause of Sinking: Grounding

Latitude (DD): 43.0287                                                         Longitude (DD): -70.50449

Nautical Miles to Shore: 6.5                                                   Nautical Miles to NMS: 21

Nautical Miles to MPA: 0                                           Nautical Miles to Fisheries: Unknown

Approximate Water Depth (Ft): 210                                                      Bottom Type: Sand

Is There a Wreck at This Location? The exact accuracy of the listed coordinates is not know, but the
wreck site is well known

Wreck Orientation: Broken in two pieces, the stern section is listing to starboard

Vessel Armament: Unknown

Cargo Carried when Lost: General Cargo and War Supplies, 221 flasks mercury

Cargo Oil Carried (bbl): 0                                                           Cargo Oil Type: N/A

Probable Fuel Oil Remaining (bbl): Likely ≤10,000 based on gross tonnage Fuel Type: Marine Diesel

Total Oil Carried (bbl): ≤10,000                         Dangerous Cargo or Munitions: Yes (Mercury)

Munitions Carried: Unknown

Demolished after Sinking: No                                                       Salvaged: Yes, partially

Cargo Lost: Yes, partially                                                        Reportedly Leaking: No

Historically Significant: Unknown                                                           Gravesite: Yes

Salvage Owner: Not known if any

                                                     3
Section 1: Vessel Background Information: Remediation of Underwater Legacy Environmental Threats (RULET)

Wreck Location

                                                                                    Chart Number: 13003

Casualty Narrative
In February 1944 the M/V Empire Knight, a 428-foot British freighter ran aground on Boon Island Ledge,
Maine and later broke into two sections. The stern section which included the ship’s cargo holds sank in
approximately 260 feet of water, one and one half miles from Boon Island Ledge.

General Notes
NOAA Automated Wreck and Obstruction Information System (AWOIS) Data:
 HISTORY

 DESCRIPTION-
   NO.204; CARGO, 7244 GT,SUNK 2/11/44 BY MARINE CASUALTY; POS.
   ACCURACYWITHIN 1 MILE; COVERED 150 FT IN 210 FT; REPORTED THROUGH
   EASTERN SEA FRONTIER 5/19/44; POS. LAT. 43-01-43N, LONG. 70-30-18W.

    27 NO.804; FTR., 7244 GT; SUNK 2/11/44 IN 210 FT.; PART OF HULL ONLY,COVERED
    APPROX. 150 FT. 17 NO.1296; 7244 GT, FTR. SUNK 2/11/44 IN LAT. 43-07-00N, LONG. 70-25-
    39W, IN DEPTHS OVER 200 FT.FTR., 7244 GT; SUNK 2/11/44 IN 156 FT; PART OF WRECK IN
    LAT. 43-07-00N,LONG. 70-25-42W. AND OTHER PART IN LAT. 43-01-42N, LONG. 70-30-
    18W.

                                                     4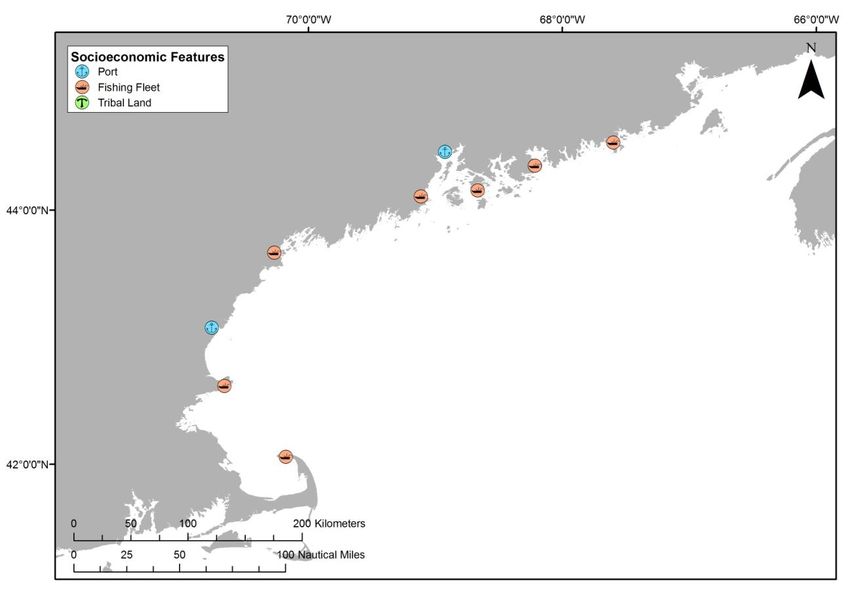
Section 1: Vessel Background Information: Remediation of Underwater Legacy Environmental Threats (RULET)

Wreck Condition/Salvage History
“The stern section is located at a water depth of 260', at 43-06-19 N / 070-27-09 W, approximately 2
miles south of Boon Island. Due to the presence of large amounts of hazardous mercury cargo, the U. S.
Coast Guard has declared a Permanent Safety Zone around this wreck site. Dredging, diving, salvaging,
anchoring and fishing are prohibited in this area.”
-http://www.wreckhunter.net/DataPages/empireknight-dat.htm

Information about the safety zone is published in the Federal Register Vol. 60, No. 218, p. 56968 on 13
November 1995.

Archaeological Assessment
The archaeological assessment provides additional primary source based documentation about the sinking
of vessels. It also provides condition-based archaeological assessment of the wrecks when possible. It
does not provide a risk-based score or definitively assess the pollution risk or lack thereof from these
vessels, but includes additional information that could not be condensed into database form.

Where the current condition of a shipwreck is not known, data from other archaeological studies of
similar types of shipwrecks provide the means for brief explanations of what the shipwreck might look
like and specifically, whether it is thought there is sufficient structural integrity to retain oil. This is more
subjective than the Pollution Potential Tree and computer-generated resource at risk models, and as such
provides an additional viewpoint to examine risk assessments and assess the threat posed by these
shipwrecks. It also addresses questions of historical significance and the relevant historic preservation
laws and regulations that will govern on-site assessments.

In some cases where little additional historic information has been uncovered about the loss of a vessel,
archaeological assessments cannot be made with any degree of certainty and were not prepared. For
vessels with full archaeological assessments, NOAA archaeologists and contracted archivists have taken
photographs of primary source documents from the National Archives that can be made available for
future research or on-site activities.

Assessment
The loss of Empire Knight was caused by grounding and not as a result of war, which means that NOAA
archaeologists have not located many historic sinking reports that would enable archaeologists to provide
additional assessment about the shipwreck on top of the casualty narrative included in this packet. Some
additional analysis can be made, however, based on additional documents that NOAA has been able to
locate.

From a Lloyd’s Register of Shipping survey report that we obtained from the National Maritime Museum
in Greenwich, we have learned that Empire Knight carried diesel oil for its engines in double bottom
tanks nos. 2, 3, 5, 6, and 7. Although we do not know the capacities of just these tanks, we do know that
the combined length of the vessel’s double bottom was 356.2 feet and that the combined capacity of all
double bottom tanks was 1,182 tons (approximately 8,628 bbl). We have also ascertained that the ship
was equipped with two donkey boilers used to power steam-operated machinery onboard the ship. These

                                                        5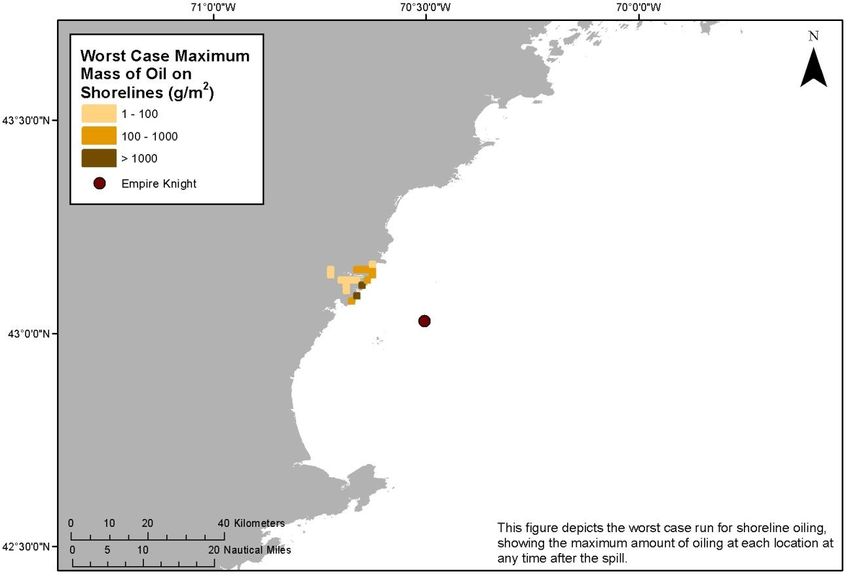
Section 1: Vessel Background Information: Remediation of Underwater Legacy Environmental Threats (RULET)

boilers utilized a heavy fuel oil with a flash point over 150 degrees Fahrenheit, but we do not know what
tanks this oil was stored in and in what quantities.

Since the vessel ran aground, split in half, and sonar images of the wreck (Figure 1-1) show large sections
of the bottom of the hull peeled back, it is likely that large amounts of the diesel oil was lost during the
sinking process, but the amount of oil that could remain on the site cannot be estimated with any degree
of accuracy. Because the site is restricted due to the mercury that is still onboard, there are no recreational
diving reports available for the site. Since the U.S. Coast Guard has surveyed the shipwreck multiple
times, however, and U.S. Coast Guard contract divers have salvaged some of the cargo of mercury, it is
possible that the local U.S. Coast Guard District or Sector also has additional information about the
shipwreck that NOAA archaeologists have been unable to locate.

Figure 1-1: Side scan sonar images of Empire Knight from Klein Associates (Source: http://www.l-
        3klein.com/?page_id=17).

Should the vessel be assessed, it should be noted that this vessel is of historic significance and will require
appropriate actions be taken under the National Historic Preservation Act (NHPA) and the possibly the
Sunken Military Craft Act (SMCA) prior to any actions that could impact the integrity of the vessel. This
vessel may be eligible for listing on the National Register of Historic Places and is considered a gravesite
and appropriate actions should be undertaken to minimize disturbance to the site.

                                                        6
Section 1: Vessel Background Information: Remediation of Underwater Legacy Environmental Threats (RULET)
Background Information References
Vessel Image Sources: http://www.wreckhunter.net/images/EmpireKnight-Clancy2.jpg;
http://www.l-3klein.com/?page_id=17
Construction Diagrams or Plans in RULET Database? No
Text References:
-AWOIS database
-http://www.federalregister.gov/articles/1995/11/13/95-27866/safety-zone-sunken-vessel-mv-empire-
knight-boon-island-me
-http://www.wreckhunter.net/DataPages/empireknight-dat.htm
Vessel Risk Factors
In this section, the risk factors that are associated with the vessel are defined and then applied to the
Empire Knight based on the information available. These factors are reflected in the pollution potential
risk assessment development by the U.S. Coast Guard Salvage Engineering Response Team (SERT) as a
means to apply a salvage engineer’s perspective to the historical information gathered by NOAA. This
analysis reflected in Figure 1-2 is simple and straightforward and, in combination with the accompanying
archaeological assessment, provides a picture of the wreck that is as complete as possible based on
current knowledge and best professional judgment. This assessment does not take into consideration
operational constraints such as depth or unknown location, but rather attempts to provide a replicable and
objective screening of the historical date for each vessel. SERT reviewed the general historical
information available for the database as a whole and provided a stepwise analysis for an initial indication
of Low/Medium/High values for each vessel.
In some instances, nuances from the archaeological assessment may provide additional input that will
amend the score for Section 1. Where available, additional information that may have bearing on
operational considerations for any assessment or remediation activities is provided.
Each risk factor is characterized as High, Medium, or Low Risk or a category-appropriate equivalent such
as No, Unknown, Yes, or Yes Partially. The risk categories correlate to the decision points reflected in
Figure 1-2.
Each of the risk factors also has a “data quality modifier” that reflects the completeness and reliability of
the information on which the risk ranks were assigned. The quality of the information is evaluated with
respect to the factors required for a reasonable preliminary risk assessment. The data quality modifier
scale is:
High Data Quality: All or most pertinent information on wreck available to allow for thorough
risk assessment and evaluation. The data quality is high and confirmed.
Medium Data Quality: Much information on wreck available, but some key factor data are
missing or the data quality is questionable or not verified. Some additional research needed.
7Section 1: Vessel Background Information: Remediation of Underwater Legacy Environmental Threats (RULET)
Low Data Quality: Significant issues exist with missing data on wreck that precludes making
preliminary risk assessment, and/or the data quality is suspect. Significant additional research
needed.
Pollution Potential Tree
Was there oil
onboard? No
(Excel)
Yes or ?
Was the wreck
demolished? Yes Low Pollution Risk
(Excel)
No or ?
Yes
Was significant cargo
Yes Likely all cargo lost?
lost during casualty?
(Research)
(Research)
No or ? No or ?
Is cargo area
Yes Medium Pollution Risk
damaged?
(Research)
No or ?
High Pollution Risk
Figure 1-2: U.S. Coast Guard Salvage Engineering Response Team (SERT) developed the above Pollution Potential
Decision Tree.
In the following sections, the definition of low, medium, and high for each risk factor is provided. Also,
the classification for the Empire Knight is provided, both as text and as shading of the applicable degree
of risk bullet.
8Section 1: Vessel Background Information: Remediation of Underwater Legacy Environmental Threats (RULET)
Pollution Potential Factors
Risk Factor A1: Total Oil Volume
The oil volume classifications correspond to the U.S. Coast Guard spill classifications:
Low Volume: Minor Spill 35.0]
Group III - Specific gravity between 0.85 and less than .95 [API° ≤35.0 and >17.5]
Group IV - Specific gravity between 0.95 to and including 1.0 [API° ≤17.5 and >10.0]
9Section 1: Vessel Background Information: Remediation of Underwater Legacy Environmental Threats (RULET)
Low Risk: The wreck was reported to have been entirely destroyed after the casualty
Medium Risk: The wreck was reported to have been partially cleared or demolished after the
casualty
High Risk: The wreck was not reported to have been cleared or demolished after the casualty
Unknown: It is not known whether or not the wreck was cleared or demolished at the time of or
after the casualty
The Empire Knight is classified as High Risk because there are no known historic accounts of the wreck
being demolished as a hazard to navigation. Data quality is high.
Was significant cargo or bunker lost during casualty?
Risk Factor C1: Burning of the Ship
This risk factor addresses any burning that is known to have occurred at the time of the vessel casualty
and may have resulted in oil products being consumed or breaks in the hull or tanks that would have
increased the potential for oil to escape from the shipwreck. The risk categories are:
Low Risk: Burned for multiple days
Medium Risk: Burned for several hours
High Risk: No burning reported at the time of the vessel casualty
Unknown: It is not known whether or not the vessel burned at the time of the casualty
The Empire Knight is classified as High Risk because there was no known report of fire at the time of
casualty. Data quality is high.
Risk Factor C2: Reported Oil on the Water
This risk factor addresses reports of oil on the water at the time of the vessel casualty. The amount is
relative and based on the number of available reports of the casualty. Seldom are the reports from trained
observers so this is very subjective information. The risk categories are defined as:
Low Risk: Large amounts of oil reported on the water by multiple sources
Medium Risk: Moderate to little oil reported on the water during or after the sinking event
High Risk: No oil reported on the water
Unknown: It is not known whether or not there was oil on the water at the time of the casualty
The Empire Knight is classified as High Risk because no reports examined during this study report oil
spreading across the water as the vessel went down. Data quality is medium.
Is the cargo area damaged?
Risk Factor D1: Nature of the Casualty
This risk factor addresses the means by which the vessel sank. The risk associated with each type of
casualty is determined by the how violent the sinking event was and the factors that would contribute to
increased initial damage or destruction of the vessel (which would lower the risk of oil, other cargo, or
munitions remaining on board). The risk categories are:
10Section 1: Vessel Background Information: Remediation of Underwater Legacy Environmental Threats (RULET)
Low Risk: Multiple torpedo detonations, multiple mines, severe explosion
Medium Risk: Single torpedo, shellfire, single mine, rupture of hull, breaking in half, grounding
on rocky shoreline
High Risk: Foul weather, grounding on soft bottom, collision
Unknown: The cause of the loss of the vessel is not known
The Empire Knight is classified as Medium Risk because it struck a rocky ledge and is broken into two
sections. Data quality is high.
Risk Factor D2: Structural Breakup
This risk factor takes into account how many pieces the vessel broke into during the sinking event or
since sinking. This factor addresses how likely it is that multiple components of a ship were broken apart
including tanks, valves, and pipes. Experience has shown that even vessels broken in three large sections
can still have significant pollutants on board if the sections still have some structural integrity. The risk
categories are:
Low Risk: The vessel is broken into more than three pieces
Medium Risk: The vessel is broken into two-three pieces
High Risk: The vessel is not broken and remains as one contiguous piece
Unknown: It is currently not known whether or not the vessel broke apart at the time of loss or
after sinking
The Empire Knight is classified as Medium Risk because it is broken into two pieces. Data quality is
high.
Factors That May Impact Potential Operations
Orientation (degrees)
This factor addresses what may be known about the current orientation of the intact pieces of the wreck
(with emphasis on those pieces where tanks are located) on the seafloor. For example, if the vessel turtled,
not only may it have avoided demolition as a hazard to navigation, but it has a higher likelihood of
retaining an oil cargo in the non-vented and more structurally robust bottom of the hull.
The stern section of the Empire Knight is listing approximately 40 degrees to starboard. Data quality is
high.
Depth
Depth information is provided where known. In many instances, depth will be an approximation based on
charted depths at the last known locations.
The stern of the Empire Knight is 210 feet deep. Data quality is high.
Visual or Remote Sensing Confirmation of Site Condition
This factor takes into account what the physical status of wreck site as confirmed by remote sensing or
other means such as ROV or diver observations and assesses its capability to retain a liquid cargo. This
11Section 1: Vessel Background Information: Remediation of Underwater Legacy Environmental Threats (RULET)
assesses whether or not the vessel was confirmed as entirely demolished as a hazard to navigation, or
severely compromised by other means such as depth charges, aerial bombs, or structural collapse.
The location of the bow and stern of the Empire Knight is known. The stern is protected by an exclusion
zone. Data quality is high.
Other Hazardous (Non-Oil) Cargo on Board
This factor addresses hazardous cargo other than oil that may be on board the vessel and could potentially
be released, causing impacts to ecological and socio-economic resources at risk.
The Empire Knight carried mercury as part of the cargo. Data quality is high.
Munitions on Board
This factor addresses hazardous cargo other than oil that may be on board the vessel and could potentially
be released or detonated causing impacts to ecological and socio-economic resources at risk.
It is not currently known if the Empire Knight had munitions for onboard weapons, or if the cargo of war
goods also included munitions. Data quality is low.
Vessel Pollution Potential Summary
Table 1-1 summarizes the risk factor scores for the pollution potential and mitigating factors that would
reduce the pollution potential for the Empire Knight. Operational factors are listed but do not have a risk
score.
12Section 1: Vessel Background Information: Remediation of Underwater Legacy Environmental Threats (RULET)
Table 1-1: Summary matrix for the vessel risk factors for the Empire Knight color-coded as red (high risk), yellow
(medium risk), and green (low risk).
Data
Risk
Vessel Risk Factors Quality Comments
Score
Score
A1: Oil Volume (total bbl) Low Maximum of 10,000 bbl, not reported to be leaking
Bunker oil is marine diesel, may have small
A2: Oil Type High
amount of Bunker C oil for steam donkey boilers
B: Wreck Clearance High Vessel not reported as cleared
Pollution
C1: Burning of the Ship High No fire was reported Med
Potential Factors
No reports of oil on water in the reports located
C2: Oil on Water Medium
during this study
D1: Nature of Casualty High Struck a ledge and broke in half
D2: Structural Breakup High Vessel is broken in half
The best analysis of the sinking and wreckage
probably still comes from information the U.S.
Archaeological Archaeological Not
Medium Coast Guard has access to, but the analysis of
Assessment Assessment Scored
where oil was stored and the capacities is believed
to be very accurate
Wreck Orientation High Stern is listing 40 degrees to starboard
Depth High Stern is 210 feet deep
Visual or Remote Sensing
Confirmation of Site High Stern has been surveyed and partially salvaged
Condition
Operational Not
Other Hazardous Materials
Factors High Vessel carried mercury as part of the cargo Scored
Onboard
Munitions Onboard Low Unknown
Gravesite (Civilian/Military) High Yes
Historical Protection
High NHPA and possibly SMCA
Eligibility (NHPA/SMCA)
13Section 2: Environmental Impact Modeling
SECTION 2: ENVIRONMENTAL IMPACT MODELING
To help evaluate the potential transport and fates of releases from sunken wrecks, NOAA worked with
RPS ASA to run a series of generalized computer model simulations of potential oil releases. The results
are used to assess potential impacts to ecological and socio-economic resources, as described in Sections
3 and 4. The modeling results are useful for this screening-level risk assessment; however, it should be
noted that detailed site/vessel/and seasonally specific modeling would need to be conducted prior to any
intervention on a specific wreck.
Release Scenarios Used in the Modeling
The potential volume of leakage at any point in time will tend to follow a probability distribution. Most
discharges are likely to be relatively small, though there could be multiple such discharges. There is a
lower probability of larger discharges, though these scenarios would cause the greatest damage. A Worst
Case Discharge (WCD) would involve the release of all of the cargo oil and bunkers present on the
vessel. In the case of the Empire Knight this would be 10,000 bbl based on current estimates of the
maximum amount of oil remaining onboard the wreck.
The likeliest scenario of oil release from most sunken wrecks, including the Empire Knight, is a small,
episodic release that may be precipitated by disturbance of the vessel in storms. Each of these episodic
releases may cause impacts and require a response. Episodic releases are modeled using 1% of the WCD.
Another scenario is a very low chronic release, i.e., a relatively regular release of small amounts of oil
that causes continuous oiling and impacts over the course of a long period of time. This type of release
would likely be precipitated by corrosion of piping that allows oil to flow or bubble out at a slow, steady
rate. Chronic releases are modeled using 0.1% of the WCD.
The Most Probable scenario is premised on the release of all the oil from one tank. In the absence of
information on the number and condition of the cargo or fuel tanks for all the wrecks being assessed, this
scenario is modeled using 10% of the WCD. The Large scenario is loss of 50% of the WCD. The five
major types of releases are summarized in Table 2-1. The actual type of release that occurs will depend on
the condition of the vessel, time factors, and disturbances to the wreck. Note that, the episodic and
chronic release scenarios represent a small release that is repeated many times, potentially repeating the
same magnitude and type of impact(s) with each release. The actual impacts would depend on the
environmental factors such as real-time and forecast winds and currents during each release and the
types/quantities of ecological and socio-economic resources present.
The model results here are based on running the RPS ASA Spill Impact Model Application Package
(SIMAP) two hundred times for each of the five spill volumes shown in Table 2-1. The model randomly
selects the date of the release, and corresponding environmental, wind, and ocean current information
from a long-term wind and current database.
When a spill occurs, the trajectory, fate, and effects of the oil will depend on environmental variables,
such as the wind and current directions over the course of the oil release, as well as seasonal effects. The
14Section 2: Environmental Impact Modeling
magnitude and nature of potential impacts to resources will also generally have a strong seasonal
component (e.g., timing of bird migrations, turtle nesting periods, fishing seasons, and tourism seasons).
Table 2-1: Potential oil release scenario types for the Empire Knight.
Release per Relative
Scenario Type Time Period Release Rate Response Tier
Episode Likelihood
Chronic Fairly regular 100 bbl over
10 bbl More likely Tier 1
(0.1% of WCD) intervals or constant several days
Episodic Over several
100 bbl Irregular intervals Most Probable Tier 1-2
(1% of WCD) hours or days
Most Probable Over several
1,000 bbl One-time release Most Probable Tier 2
(10% of WCD) hours or days
Large Over several
5,000 bbl One-time release Less likely Tier 2-3
(50% of WCD) hours or days
Over several
Worst Case 10,000 bbl One-time release Least likely Tier 3
hours or days
The modeling results represent 200 simulations for each spill volume with variations in spill trajectory
based on winds and currents. The spectrum of the simulations gives a perspective on the variations in
likely impact scenarios. Some resources will be impacted in nearly all cases; some resources may not be
impacted unless the spill trajectory happens to go in that direction based on winds and currents at the time
of the release and in its aftermath.
For the large and WCD scenarios, the duration of the release was assumed to be 12 hours, envisioning a
storm scenario where the wreck is damaged or broken up, and the model simulations were run for a
period of 30 days. The releases were assumed to be from a depth between 2-3 meters above the sea floor,
using the information known about the wreck location and depth. It is important to acknowledge that
these scenarios are only for this screening-level assessment. Detailed site/vessel/and seasonally specific
modeling would need to be conducted prior to any intervention on a specific wreck.
Oil Type for Release
The Empire Knight contained a maximum of 10,000 bbl of marine diesel as the fuel oil (a Group II oil).
Thus, the oil spill model was run using light fuel oil.
Oil Thickness Thresholds
The model results are reported for different oil thickness thresholds, based on the amount of oil on the
water surface or shoreline and the resources potentially at risk. Table 2-2 shows the terminology and
thicknesses used in this report, for both oil thickness on water and the shoreline. For oil on the water
surface, a thickness of 0.01 g/m2, which would appear as a barely visible sheen, was used as the threshold
for socio-economic impacts because often fishing is prohibited in areas with any visible oil, to prevent
contamination of fishing gear and catch. A thickness of 10 g/m2 was used as the threshold for ecological
impacts, primarily due to impacts to birds, because that amount of oil has been observed to be enough to
mortally impact birds and other wildlife. In reality, it is very unlikely that oil would be evenly distributed
on the water surface. Spilled oil is always distributed patchily on the water surface in bands or tarballs
with clean water in between. So, Table 2-2a shows the number of tarballs per acre on the water surface
for these oil thickness thresholds, assuming that each tarball was a sphere that was 1 inch in diameter.
15Section 2: Environmental Impact Modeling
For oil stranded onshore, a thickness of 1 g/m2 was used as the threshold for socio-economic impacts
because that amount of oil would conservatively trigger the need for shoreline cleanup on amenity
beaches. A thickness of 100 g/m2 was used as the threshold for ecological impacts based on a synthesis of
the literature showing that shoreline life has been affected by this degree of oiling.2 Because oil often
strands onshore as tarballs, Table 2-2b shows the number of tarballs per m2 on the shoreline for these oil
thickness thresholds, assuming that each tarball was a sphere that was 1 inch in diameter.
Table 2-2a: Oil thickness thresholds used in calculating area of water impacted. Refer to Sections 3 and 4 for
explanations of the thresholds for ecological and socio-economic resource impacts.
Sheen Approximate Sheen No. of 1 inch
Oil Description Threshold/Risk Factor
Appearance Thickness Tarballs
Socio-economic Impacts
0.01 ~5-6 tarballs
Oil Sheen Barely Visible 0.00001 mm to Water Surface/Risk
g/m2 per acre
Factor 4B-1 and 2
Ecological Impacts to
~5,000-6,000
Heavy Oil Sheen Dark Colors 0.01 mm 10 g/m2 Water Surface/ Risk
tarballs per acre
Factor 3B-1 and 2
Table 2-2b: Oil thickness thresholds used in calculating miles of shoreline impacted. Refer to Sections 3 and 4 for
explanations of the thresholds for ecological and socio-economic resource impacts.
Oil Approximate Sheen No. of 1 inch
Oil Description Threshold/Risk Factor
Appearance Thickness Tarballs
Socio-economic Impacts
~0.12-0.14
Oil Sheen/Tarballs Dull Colors 0.001 mm 1 g/m2 to Shoreline Users/Risk
tarballs/m2
Factor 4C-1 and 2
Ecological Impacts to
Oil Slick/Tarballs Brown to Black 0.1 mm 100 g/m2 ~12-14 tarballs/m2 Shoreline Habitats/Risk
Factor 3C-1 and 2
Potential Impacts to the Water Column
Impacts to the water column from an oil release from the Empire Knight will be determined by the
volume of leakage. Because oil from sunken vessels will be released at low pressures, the droplet sizes
will be large enough for the oil to float to the surface. Therefore, impacts to water column resources will
result from the natural dispersion of the floating oil slicks on the surface, which is limited to about the top
33 feet. The metric used for ranking impacts to the water column is the area of water surface in mi 2 that
has been contaminated by 1 part per billion (ppb) oil to a depth of 33 feet. At 1 ppb, there are likely to be
impacts to sensitive organisms in the water column and potential tainting of seafood, so this concentration
is used as a screening threshold for both the ecological and socio-economic risk factors for water column
resource impacts. To assist planners in understanding the scale of potential impacts for different leakage
volumes, a regression curve was generated for the water column volume oiled using the five volume
scenarios, which is shown in Figure 2-1. Using this figure, the water column impacts can be estimated for
any spill volume. Note that the water column impact decreases for the worst case discharge spill volume,
2 French, D., M. Reed, K. Jayko, S. Feng, H. Rines, S. Pavignano, T. Isaji, S. Puckett, A. Keller, F. W. French III, D. Gifford, J.
McCue, G. Brown, E. MacDonald, J. Quirk, S. Natzke, R. Bishop, M. Welsh, M. Phillips and B.S. Ingram, 1996. The CERCLA
type A natural resource damage assessment model for coastal and marine environments (NRDAM/CME), Technical
Documentation, Vol. I - V. Office of Environmental Policy and Compliance, U.S. Dept. of the Interior, Washington, DC.
16Section 2: Environmental Impact Modeling
because a significant amount of oil is removed from the water column due to sedimentation in the
modeling results. Increased sedimentation will increase impacts to benthic habitats.
Water Column Impact
250
Area (sq. mi.) of the Upper 33 Feet of Water
200
150
100
50
0
0 2,000 4,000 6,000 8,000 10,000 12,000
Spill Volume (bbl)
Figure 2-1: Regression curve for estimating the volume of water column impacted at or above the threshold of 1 ppb
aromatics as a function of spill volume for the Empire Knight.
Potential Water Surface Slick
The slick size from an oil release from the Empire Knight is a function of the quantity released. The
estimated water surface coverage by a fresh slick (the total water surface area “swept” by oil over time)
for the various scenarios is shown in Table 2-3, as the mean result of the 200 model runs. Note that this is
an estimate of total water surface affected over a 30-day period. The slick will not be continuous but
rather be broken and patchy due to the subsurface release of the oil. Surface expression is likely to be in
the form of sheens, tarballs, and streamers.
Table 2-3: Estimated slick area swept on water for oil release scenarios from the Empire Knight.
Estimated Slick Area Swept
Scenario Type Oil Volume (bbl) Mean of All Models
0.01 g/m2 10 g/m2
Chronic 10 130 mi2 13 mi2
Episodic 100 630 mi2 50 mi2
Most Probable 1,000 2,000 mi2 200 mi2
Large 5,000 4,700 mi2 560 mi2
Worst Case Discharge 10,000 6,800 mi2 900 mi2
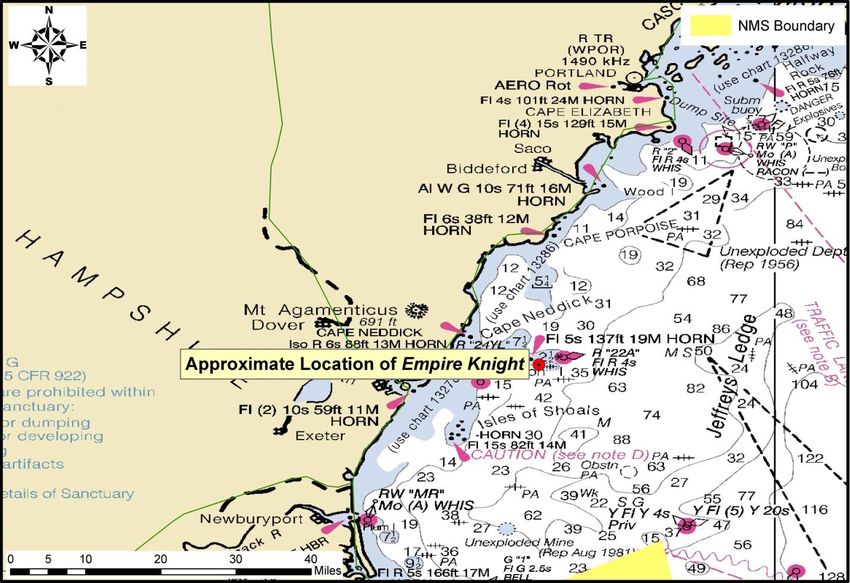
The location, size, shape, and spread of the oil slick(s) from an oil release will depend on environmental
conditions, including winds and currents, at the time of release and in its aftermath. The areas potentially
affected by oil slicks, given that we cannot predict when the spill might occur and the range of possible
wind and current conditions that might prevail after a release, are shown in Figure 2-2 and Figure 2-3
using the Most Probable volume and the socio-economic and ecological thresholds.
17Section 2: Environmental Impact Modeling
Figure 2-2: Probability of surface oil (exceeding 0.01 g/m2) from the Most Probable spill of 1,000 bbl of light fuel oil
from the Empire Knight at the threshold for socio-economic resources at risk.
Figure 2-3: Probability of surface oil (exceeding 10 g/m2) from the Most Probable spill of 1,000 bbl of light fuel oil
from the Empire Knight at the threshold for ecological resources at risk.
18Section 2: Environmental Impact Modeling
The maximum potential cumulative area swept by oil slicks at some time after a Most Probable Discharge
is shown in Figure 2-4 as the timing of oil movements.
Figure 2-4: Water surface oiling from the Most Probable spill of 1,000 bbl of light fuel oil from the Empire Knight
shown as the area over which the oil spreads at different time intervals.
The actual area affected by a release will be determined by the volume of leakage, whether it is from one
or more tanks at a time. To assist planners in understanding the scale of potential impacts for different
leakage volumes, a regression curve was generated for the water surface area oiled using the five volume
scenarios, which is shown in Figure 2-5. Using this figure, the area of water surface with a barely visible
sheen can be estimated for any spill volume.
19Section 2: Environmental Impact Modeling
Water Surface Area Oiled
8,000
0.01 g/m2 Threshold
7,000 10 g/m2 Threshold
6,000
Area (sq. mi.)
5,000
4,000
3,000
2,000
1,000
0
0 2,000 4,000 6,000 8,000 10,000 12,000
Spill Volume (bbl)
Figure 2-5: Regression curve for estimating the amount of water surface oiling as a function of spill volume for the
Empire Knight, showing both the ecological threshold of 10 g/m2 and socio-economic threshold of 0.01 g/m2.
Potential Shoreline Impacts
Based on these modeling results, shorelines from east of Acadia National Park, to as far south as Cape
Cod, Massachusetts, are at risk. Figure 2-6 shows the probability of oil stranding on the shoreline at
concentrations that exceed the threshold of 1 g/m2, for the Most Probable release of 1,000 bbl. However,
the specific areas that would be oiled will depend on the currents and winds at the time of the oil
release(s), as well as on the amount of oil released. Figure 2-7 shows the single oil spill scenario that
resulted in the maximum extent of shoreline oiling for the Most Probable volume. Estimated miles of
shoreline oiling above the threshold of 1 g/m2 by scenario type are shown in Table 2-4.
Table 2-4a: Estimated shoreline oiling from leakage from the Empire Knight (U.S. and Canada).
Estimated Miles of Shoreline Oiling Above 1 g/m2
Scenario Type Volume (bbl)
Rock/Gravel/Artificial Sand Wetland/Mudflat Total
Chronic 10 2 0 0 2
Episodic 100 3 0 0 3
Most Probable 1,000 1 0 0 1
Large 5,000 1 0 1 2
Worst Case Discharge 10,000 1 1 1 3
Table 2-4b: Estimated shoreline oiling from leakage from the Empire Knight (U.S. only).
Estimated Miles of Shoreline Oiling Above 1 g/m2
Scenario Type Volume (bbl)
Rock/Gravel/Artificial Sand Wetland/Mudflat Total
Chronic 10 2 0 0 2
Episodic 100 3 0 0 3
Most Probable 1,000 1 0 0 1
Large 5,000 1 0 1 2
Worst Case Discharge 10,000 1 1 1 3
20Section 2: Environmental Impact Modeling
Figure 2-6: Probability of shoreline oiling (exceeding 1.0 g/m2) from the Most Probable Discharge of 1,000 bbl of light
fuel oil from the Empire Knight.
Figure 2-7: The extent and degree of shoreline oiling from the single model run of the Most Probable Discharge of
1,000 bbl of light fuel oil from the Empire Knight that resulted in the greatest shoreline oiling.
21Section 2: Environmental Impact Modeling
The actual shore length affected by a release will be determined by the volume of leakage and
environmental conditions during an actual release. To assist planners in scaling the potential impact for
different leakage volumes, a regression curve was generated for the total shoreline length oiled using the
five volume scenarios, which is shown in Figure 2-8. Using this figure, the shore length oiled can be
estimated for any spill volume.
Shoreline Oiling
4
1 g/m2 Threshold
4 100 g/m2 Threshold
3
Length (mi.)
3
2
2
1
1
0
0 2,000 4,000 6,000 8,000 10,000 12,000
Spill Volume (bbl)
Figure 2-8: Regression curve for estimating the amount of shoreline oiling at different thresholds as a function of spill
volume for the Empire Knight.
The worst case scenario for shoreline exposure along the potentially impacted area for the WCD volume
(Table 2-5) and the Most Probable volume (Table 2-6) consists primarily of sand beaches and rocky
shores. Salt marshes and tidal flats near tidal inlets are also at risk.
Table 2-5: Worst case scenario shoreline impact by habitat type and oil thickness for a leakage of 10,000 bbl from
the Empire Knight.
Lighter Oiling Heavier Oiling
Shoreline/Habitat Type Oil Thickness 1 mm
Oil Thickness >1 g/m2 Oil Thickness >100 g/m2
Rocky and artificial shores/Gravel beaches 2 miles 2 miles
Sand beaches 4 miles 4 miles
Salt marshes and tidal flats 7 miles 2 miles
Table 2-6: Worst case scenario shoreline impact by habitat type and oil thickness for a leakage of 1,000 bbl from the
Empire Knight.
Lighter Oiling Heavier Oiling
Shoreline/Habitat Type Oil Thickness 1 mm
Oil Thickness >1 g/m2 Oil Thickness >100 g/m2
Rocky and artificial shores/Gravel beaches 2 miles 2 miles
Sand beaches 0 miles 0 miles
Salt marshes and tidal flats 1 mile 0 miles
22Section 3: Ecological Resources at Risk
SECTION 3: ECOLOGICAL RESOURCES AT RISK
Ecological resources at risk from a catastrophic release of oil from the Empire Knight (Table 3-1) include
numerous guilds of birds that use shorelines and coastal waters. The islands of coastal Maine support an
incredible diversity and abundance of nesting seabirds, migrating shorebirds and passerines, and
overwintering waterfowl. Shorelines in this region are important haul-out and pupping sites for seals.
Coastal waters are summer foraging habitat for several species of large whales. Nearshore regions also
support productive commercial fisheries for fish and invertebrate species.
Table 3-1: Ecological resources at risk from a release of oil from the Empire Knight.
(*FT = Federal threatened; FE = Federal endangered; ST = State threatened; SE = State endangered; SSC = Species
of special concern).
Species Group Species Subgroup and Geography Seasonal Presence
Birds Important areas Nesting:
Coastal Maine is important breeding habitat for arctic terns (ST) Arctic tern nests May-
Over 365 of Maine’s coastal islands have recent records of seabird nesting Jun
Shoreline from Casco Bay south is critical to least tern (FE, SE) and piping
plover (FT, SE) nesting Least tern, roseate tern,
High concentrations of migratory shorebirds and songbirds in Hampton common tern, piping
Harbor and at Isles of Shoals, NH plover nesting
May-Aug
Maine nesting sites (numbers are in pairs)
Jenny Island (in Casco Bay): common tern (753), small numbers of roseate Double-crested
and arctic terns, common eiders cormorant nests Apr-Jul
Stratton Island (in Saco Bay): northern limit of wading bird nesting (glossy
ibis, little blue heron, great egret, tri-colored heron, American oystercatcher, Generally, seabird
least tern), southern limit of Arctic bird nesting (common eider, black nesting season Apr-Aug
guillemot, arctic tern)
96% of Maine’s population of roseate terns (FE) nest at Eastern Egg Rock Migrating:
and Stratton Island Shorebird migration
Aug
Massachusetts nesting sites
Most summer residents
Manchester/Gloucester area: double-crested cormorant, gulls, little blue
leave by Sep
heron, great egret, snowy egret, black-crowned night-heron, glossy ibis,
Canada goose, mallard
Fall waterfowl migration
Rockport and offshore islands: cormorant, herring and great black-backed
Sep-Oct
gull, glossy ibis, black-crowned night heron
New Hampshire
Isles of Shoals: common tern (ST, 1,000s), roseate tern (FE, SE; 100), arctic
tern (1-7), common eider (50-60), black guillemot (sporadic nesters), herring
gull, great black-backed gull, double-crested cormorant (50-100)
Pinnipeds Harbor seals and gray seals are common. Harp seals and hooded seals are Harp seals present Jan-
transitory. Additional Arctic species have been sighted but are not common. May
Concentrations: Harbor seals pup May-
30-40,000 harbor seals in coastal Maine and Isle of Shoals population Jun
Harbor seal rookeries at the rocks offshore of Beckman’s Point (20-70) and
Plaice Cove (10-45), Seal Rocks (10-20), Square Rock (200-600) Gray seals pup Dec-
Gray seals present on Square Rock Feb
Cetaceans Common to Gulf of Maine: North Atlantic right whale (FE), fin whale (FE), minke Right, humpback, fin
23Section 3: Ecological Resources at Risk
Species Group Species Subgroup and Geography Seasonal Presence
whale, humpback whale (FE), Atlantic white-sided dolphin, harbor porpoise present in summer
Also present: blue whale (FE), sei whale, pygmy sperm whale, sperm whale (FE), Atlantic white-sided
northern bottlenose whale, beaked whale, beluga, killer whale, long-finned pilot dolphin calves Jun-Jul;
whale, white-beaked dolphin, bottlenose dolphin, common dolphin, striped dolphin Harbor porpoise calves
May-Jun
Fish Coastal streams/estuaries American shad spawn
Atlantic sturgeon (FT) spawn in Kennebec and Penobscot Rivers May-Nov
Alewife and American shad spawn in all streams
Juvenile anadromous fish use nearshore waters as nursery habitat Alewife common
High concentration of smelt and striped bass in Rye Harbor offshore in fall, spawn
High concentration of winter flounder in Hampton Harbor Mar-May
Marine
Nearshore waters support high concentrations of anadromous fish
Offshore ledges and banks support highly productive fisheries, including
Atlantic halibut, Atlantic cod, winter flounder, witch flounder, American plaice,
hake, monkfish
Invertebrates Atlantic surf clam, softshell clam, bay scallop, northern quahog, and blue mussels Northern shrimp spawn
are all present in bays and nearshore environments. American lobster, rock crabs, Nov-May
northern shrimp and sea scallop beds all found in nearshore areas. Areas of high
concentration areas are listed below: Mussels spawn in
Blue mussels around Manomet Point spring
Softshell clam beds common in bays of Maine
American lobsters migrate inshore in the summer; rocky intertidal areas may
be important nursery habitat
Benthic Habitats Submerged aquatic vegetation (mostly eelgrass) is critical to numerous species and Year round
occurs inside of bays and sounds throughout the region; Casco Bay has large beds
Rockweed can be found along rocky shores from Maine north and is important
habitat for juvenile fish, invertebrates and birds
The Environmental Sensitivity Index (ESI) atlases for the potentially impacted coastal areas from a leak
from the Empire Knight are generally available at each U.S. Coast Guard Sector. They can also be
downloaded at: http://response.restoration.noaa.gov/esi. These maps show detailed spatial information on
the distribution of sensitive shoreline habitats, biological resources, and human-use resources. The tables
on the back of the maps provide more detailed life-history information for each species and location. The
ESI atlases should be consulted to assess the potential environmental resources at risk for specific spill
scenarios. In addition, the Geographic Response Plans within the Area Contingency Plans prepared by the
Area Committee for each U.S. Coast Guard Sector have detailed information on the nearshore and
shoreline ecological resources at risk and should be consulted.
Ecological Risk Factors
Risk Factor 3: Impacts to Ecological Resources at Risk (EcoRAR)
Ecological resources include plants and animals (e.g., fish, birds, invertebrates, and mammals), as well as
the habitats in which they live. All impact factors are based on a Worst Case and the Most Probable
Discharge oil release from the wreck. Risk factors for ecological resources at risk (EcoRAR) are divided
into three categories:
24Section 3: Ecological Resources at Risk
Impacts to the water column and resources in the water column;
Impacts to the water surface and resources on the water surface; and
Impacts to the shoreline and resources on the shoreline.
The impacts from an oil release from the wreck would depend greatly on the direction in which the oil
slick moves, which would, in turn, depend on wind direction and currents at the time of and after the oil
release. Impacts are characterized in the risk analysis based on the likelihood of any measurable impact,
as well as the degree of impact that would be expected if there is an impact. The measure of the degree of
impact is based on the median case for which there is at least some impact. The median case is the
“middle case” – half of the cases with significant impacts have less impact than this case, and half have
more.
For each of the three ecological resources at risk categories, risk is defined as:
The probability of oiling over a certain threshold (i.e., the likelihood that there will be an impact
to ecological resources over a certain minimal amount); and
The degree of oiling (the magnitude or amount of that impact).
As a reminder, the ecological impact thresholds are: 1 ppb aromatics for water column impacts; 10 g/m2
for water surface impacts; and 100 g/m2 for shoreline impacts.
In the following sections, the definition of low, medium, and high for each ecological risk factor is
provided. Also, the classification for the Empire Knight is provided, both as text and as shading of the
applicable degree of risk bullet, for the WCD release of 10,000 bbl and a border around the Most
Probable Discharge of 1,000 bbl.
Risk Factor 3A: Water Column Impacts to EcoRAR
Water column impacts occur beneath the water surface. The ecological resources at risk for water column
impacts are fish, marine mammals, and invertebrates (e.g., shellfish, and small organisms that are food for
larger organisms in the food chain). These organisms can be affected by toxic components in the oil. The
threshold for water column impact to ecological resources at risk is a dissolved aromatic hydrocarbons
concentration of 1 ppb (i.e., 1 part total dissolved aromatics per one billion parts water). Dissolved
aromatic hydrocarbons are the most toxic part of the oil. At this concentration and above, one would
expect impacts to organisms in the water column.
Risk Factor 3A-1: Water Column Probability of Oiling of EcoRAR
This risk factor reflects the probability that at least 0.2 mi2 of the upper 33 feet of the water column would
be contaminated with a high enough concentration of oil to cause ecological impacts. The three risk
scores for water column oiling probability are:
Low Oiling Probability: Probability = 50%
25You can also read