Empirical Evaluation of the Impact of Resilience and Sustainability on Firms' Performance - MDPI
←
→
Page content transcription
If your browser does not render page correctly, please read the page content below
sustainability

Article
Empirical Evaluation of the Impact of Resilience and
Sustainability on Firms’ Performance
Elia Balugani 1 , Maria Angela Butturi 1, * , Delroy Chevers 2 , David Parker 3 and
Bianca Rimini 1
 1    Department of Sciences and Methods for Engineering, University of Modena and Reggio Emilia, Via
      Amendola 2–Padiglione Morselli, Reggio Emilia, 42100 Modena, Italy; elia.balugani@unimore.it (E.B.);
      bianca.rimini@unimore.it (B.R.)
 2    Mona School of Business and Management, The University of the West Indies, Mona 876, Jamaica;
      delroy.chevers@uwimona.edu.jm
 3    UQ Business School, The University of Queensland, Brisbane, QLD 4072, Australia;
      d.parker@business.uq.edu.au
 *    Correspondence: mariaangela.butturi@unimore.it

 Received: 31 January 2020; Accepted: 24 February 2020; Published: 26 February 2020

 Abstract: The concepts of resilience and sustainability appear multi-dimensional and correlated,
 depending on the context. Operational sustainability practices can enhance the resilience of a firm,
 and support its growth. This study aims at analyzing the impact of a sustainability strategy, measured
 by means of a sustainability maturity index (SMI), on the financial performance of a company. Since
 the SMI is strictly correlated to resilience capabilities, the performed analysis represents a first level
 integration of the sustainability and resilience indicators in a common framework. A data sample
 from 53 organizations was collected through structured interviews and analyzed to identify possible
 relationships between the SMI and the financial performance indexes. The analysis does not support
 commonly reported arguments: we show that profitability does not show a significant relationship
 with sustainable strategic intent. Interestingly, firm country of origin, size of the organization, and
 market focus, likewise, do not have a significant relationship with SMI. Arguably, multi-dimensional
 company performance, including both financial and non-financial measures, should be considered to
 assess the impact of sustainability practices. Moreover, further investigations are needed to capture
 firms’ nonfinancial indicators of performance that are related to sustainability and resilience, for
 building up a unified framework enabling trade-off analysis.

 Keywords: sustainability maturity index; resilience; sustainable operations; sustainability modeling;
 sustainability and financial performance

1. Introduction
      Resilience and sustainability are multifaceted paradigms that are defined depending on the field
of application [1,2]. As a general concept, sustainability deals with reducing negative impacts on
environment—both business and natural—resilience captures adaptation and recovery from imposed
change. Drawing from the literature, the two concepts are related, sharing similar goals and some
common approaches, even if the range of the relationship extends to considering them as synonyms, to
regarding them as distinct notions [3]. At a small scale there are trade-offs between sustainability and
resilience [4] that should be analyzed building up a common framework [5]. In the fields of business
management and supply chain management, sustainability is considered a component of resilience,
that is, increasing sustainability of the system makes the system more resilient.

Sustainability 2020, 12, 1742; doi:10.3390/su12051742                       www.mdpi.com/journal/sustainability
Sustainability 2020, 12, 1742 2 of 18
We argue that the principles of operational sustainability, should embrace economic, environmental
and social impacts of a company’s operations, can improve the resilience of the company, supporting
its growth and survival.
This research identifies the sustainable maturity index (SMI), derived from populating
an operations sustainability maturity model (OSMM), using data from different industry sectors
and countries. The SMI measures the company sustainability intent and progress along a maturity
trajectory. Our sustainability model includes a set of common resilience indicators, supporting
the hypothesis that sustainability practices result in improved resilience performance [6].
The aim of the paper is twofold: it addresses a gap in the literature, and explores the notion
that any company that has a strategy to improve its SMI may not necessarily financially benefit from
improved resources utilization, such as operating income, return on assets (ROA), return on equity
(ROE), and earnings before tax (EBT); although, as frequently proffered, these should be consequences
of sustainable [7]. It also represents a first-level integration of the sustainability and resilience indicators
in a common framework, to investigate the relationship between resilience capabilities and firms’
financial performance.
The paper begins by overviewing the relationship among resilience, sustainability practices and
firms’ performance in Section 2; then, Section 3 describes the research methodology, Section 4 presents
the research results and Section 5 discusses the results.
2. Resilience, Sustainability, and Firms’ Performance Relationship: An Overview
The concepts of resilience and sustainability are considered strictly correlated [7]. However,
the multidimensionality of the two concepts, the different definitions and fields of applicability bring
about a complex relationship that can vary depending on the context [8].
Essentially, resilience can be defined as the capacity of a system to absorb disturbances while
retaining its structure and function [9]. However, its definition strongly depends on the domain of
application [10,11] and there is not a common view on how resilience can be measured [12] since it is
a complex multidimensional socio-technical phenomenon [13]. Moreover, many definitions overlap
with other concepts such as, among others, robustness, fault-tolerance, flexibility, survivability, and
agility [2]. Engineering resilience draws attention to the ability of a resilient system to return to its
pre-disturbance state as quickly as possible [14], implying a focus on efficiency of function [15]. It
contributes to organizational resilience, which focus on the adaptive capacity of the organizations and
is a dynamic process that implies the ability of developing capabilities to face new situations [13].
Hollnagel [16] considers resilience as a functional characteristic of a system, referring to a system’s
resilient performance rather than a system’s resilience; in this perspective resilience magnitude cannot
be measured in a simply way. Conversely, companies willing to invest to become more resilient need
to evaluate progress [17].
The complexity of defining a metric for analyzing and measuring the resilience of organizations
or engineering systems is mainly due to the diversity of domains and objectives [10,15]. There is
not a widely accepted methodology for organizational or engineering resilience assessment [18,19]:
different approaches can be found in the literature. Hosseini et al. [2] provide a classification of
the qualitative and quantitative metrics, focusing on engineering systems: qualitative assessment
approaches include the definition of a conceptual framework and the aggregation of expert opinion
along multiple dimensions into an index; quantitative assessment can involve the comparison of
the system’s performance before and after the disrupting event or the analysis through the definition
of structural models. Similarly, organizational resilience is assessed in the literature by developing
models or by identifying, quantifying, and ranking proper indicators [20].
A challenge in defining resilience-related metrics is to ensure that these metrics are relevant to
the main goals and objectives of the organization [15].
For companies with a strong approach to sustainability, the pursued goals are consistent
with resilience goals, so sustainability indicators can be used as guiding indicators accountingSustainability 2020, 12, 1742 3 of 18
for the resilience of the organization [6]. In the fields of business management and supply chain
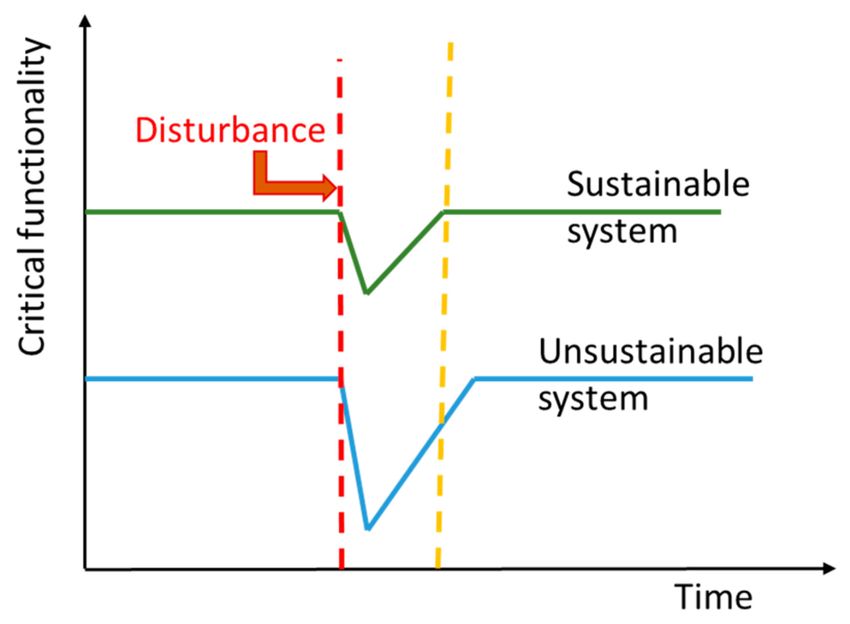
management, sustainability is commonly considered a contributing factor to resilience, as illustrated in
Figure 1. This means that sustainable-enhanced systems recover quicker in response to disturbances.
In this context, the resilience can be viewed as the capacity of maintaining some primary goals or
functionalities (e.g., profit, safety, performance) during and after disturbances [8].
Figure 1. Sustainability as a component of resilience (adapted from [8]).
Sustainability measures can identify in management practices, an intrinsic approach to
resilience [21].
Moreover, the development of business continuity strategies can be built on a continuous
management set of responsibilities, structures and activities [9,22], such as operational sustainability.
A wide debate is ongoing with regard to sustainability’s definition in the field of operations
management [23]. We define the operational sustainability as a state of operational maintenance
and viability that demonstrates the inclusion of a corporation’s economic, social, and environmental
performance which then reflects the value created from the optimal use of resources, the responsibility
upheld towards the community’s well-being, and the conservation efforts from responsible
decision-making [2]. The concept considers simultaneously economic, environmental and social
impacts of a company’s operations, in a triple bottom line approach, as well as the interactions with
stakeholders. The principles of operational sustainability are key factors to provide a prompt and
dynamic response to frequent and unpredictable changes, and provide support to firms’ growth and
survival contributing to organizations’ resilience [19].
According to Lee et al. [13], metrics for measuring and evaluating organizational resilience
should contribute to, among others, the need to link improvements in organizational resilience with
competitiveness. Prayag et al. [24] demonstrate that the adaptive component of organizational resilience
is a significant predictor of financial performance for tourism firms, while Gunasekaran et al. [25]
observe how the capacity of generating capital influence the resilience of SMEs. On the other hand,
the impact analysis of a strategy based on operational sustainability practices can be measured through
financial performance [23,26].
A growing interest in investigating the relationship between corporate sustainable practices and
financial performance has developed over the last two decades, and a number of recent literature reviews
try to summarize the research results on this issue, to draw consistent conclusions. Contradictory
results are reported by review papers, highlighting a lack of consensus among research studies [27].
Alshehhi et al. [28] found that 78% of analyzed publications report a positive relationship between
corporate sustainability and financial performance. The authors argued that results can be influenced
by the sustainability definition, if the environmental or the social dimension is emphasized, by research
methodology and the considered variables. In addition, the industry sector, firm size or the examined
market seem to impact on the results. A meta-analysis of the correlations between sustainable
operations practices (SOP) and firms’ performance has been performed by D’Agostini et al. [14]. InSustainability 2020, 12, 1742 4 of 18
the study, after a systematic literature review, 15 selected SOP are compared with environmental,
economic, operational and organizational performance. On an aggregated basis, a positive relationship
has been identified, even if moderating factors influence 12 of the relationships.
Firms’ financial performance is measured both through accounting-based and market-based
indexes. Accounting-based measures are considered less noisy than market-based indicators that can
be influenced by market perceptions or speculations [29]. The most used accounting-based variables
are return on assets (ROA) and return on equity (ROE) [30]. Financial performance is also correlated
to innovation, a capability supporting firms’ resilience since it enables organizations to renew over
time, foresee changes and proactively learn [31,32]. A wide selection of quantitative methodologies is
adopted in the literature to investigate the relationship between sustainable practices and financial
performance, such as partial least square, structural equation modeling, correlation and regression
analysis, and analysis of variance [33]. The methodology approach varies widely among studies; most
of the articles use regression analysis [28].
Some studies demonstrate how sustainable practices are linked in complex ways to financial
performance [34], since they produce also other performance outcomes such as corporate reputation,
customer satisfaction, long-term shareholders, and stakeholders’ value. Thus, a multi-dimensional
company performance should be considered [31], including both financial and non-financial measures.
Moreover, research suggests that sustainability and resilience indicators should be combined into
a unified framework to provide a more comprehensive understanding of the relevant capabilities [3]
and to align the objectives of sustainability and resilience to gather the benefits of both the practices [35].
3. Methodology
The research methodology comprises a literature review on sustainability goals and practices within
companies to develop a conceptual framework (the operations sustainability maturity model—OSMM),
structured interviews and statistical analysis.
3.1. Operations Sustainability Maturity Model and SMI Definition
An operations sustainability maturity model was developed [22]. It allowed measurement of
the corporate sustainability intent and progress along a maturity trajectory through the definition
of a sustainability maturity index (SMI), described in detail in [22] and [26]. The initial testing
of the methodology, generalizability and rigor of the OSMM was conducted in financial services
organizations, located in developed and developing countries [22]. The introduced SMI accounts for
the multi-dimensionality of the operational sustainability in companies. Five domains were considered:
• Corporate sustainability (CS). Reflecting the extent of the economic, social and environmental value
being created from the optimal use of resources, the responsibility upheld towards the community’s
well-being and the conservation efforts from responsible decision-making.
• Economic capital (EC). An illustration of the organization’s efforts in instigating value-creating
strategies, resource optimization and creating value-adding activities.
• Societal capital (SC). An accumulation of the corporation’s public networks and social relations
in the community in which it operates. It can be acquired through the corporation’s efforts to
address societal concerns and the maximizing of social benefits to the community.
• Human capital (HC). An accumulation of knowledgeable, skillful, and competent individuals in
the corporation. Human capital can be acquired through the corporation’s efforts to encourage
internal and external learning, and the building of internal loyalty.
• Natural capital (NC). An illustration of its conservation efforts aimed to reduce environmental
impacts and initiation of responsible decision-making to promote or maintain the well-being of
the planet.
Each domain was numerically assessed against a scale of 1 to 5 to indicate relative progression
towards to an optimum maturity and the aggregated metric indicated the SMI.Sustainability 2020, 12, 1742 5 of 18
3.2. Questionnaire Design
To evaluate the SMI within companies, a questionnaire was designed following the procedure
described in [22]. It included 95 items, split into five sections each of one aimed at measuring one
domain of operations sustainability: corporate sustainability (34 items), the economic capital (19 items)
domain, societal capital (12 items), human capital (22 items) and natural capital (8 items). An additive
score was calculated for each sustainability domain and for the SMI.
3.3. Interview Structure
Interviews were conducted during a three-years period, from February 2017 to September 2019, at
53 companies’ headquarters. The questionnaires were also submitted to executives and managers, as
they play a prominent role in developing of sustainability. Each company agreed in writing to be part of
this research if their anonymity could be guaranteed. In addition to the surveys, qualitative information
was also recorded for each organization, since during the panel interviews, often taking several hours,
the topic of operational sustainability generated a wide range of discussion. The 53 companies’ span
seven SIC sector classification and are located in Australia, Italy, Jamaica, the UK, Marshall Islands,
the Republic of Kiribati, and Tuvalu. Table A1 in Appendix A shows their profiles. As Table A1
illustrates, the companies differ by capital size, market focus and financial performance. Moreover,
they belong to different geographic regions, allowing meta-analysis by country, SIC, and development.
The current data set represents early development of the research; with selection of organizations and
country of origin being arbitrary, and accessible.
3.4. OSMM as a Resilience Driver
As the literature review identified, sustainability and resilience both focus on system survivability,
sharing common goals and research methodologies [8]. Our OSMM framework includes items directly
related to resilience indicators and capabilities, as reported in the literature. Table 1 lists the items and
the source of the corresponding resilience indicators.
Table 1. Operation sustainability maturity model items related to resilience capabilities.
Operations Sustainability OSSM Items
References
Domain Related to Resilience Indicators and Capabilities
Corporate sustainability Network perspective [13]
Effective planning [13]
Staff engagement/sense of teamwork [10,13,36]
Economic capital Long-term perspective [34]
Innovation and creativity [31,32,36]
Flexibility/adaptability [10]
Information and knowledge [13]
Societal capital Organizational connectivity and relationships [10,13]
Stakeholders involvement [13]
Human capital Communications and relationship [37]
Information and knowledge [13]
Natural capital –
We assume that the sustainable operations defined in our model impacts positively on the resilience
of the investigated companies. Thus, the potential impact of sustainable practices on financial
performance should be compatible, on first approximation, with an impact of resilience capabilities
on competitiveness.
3.5. Statistical Analysis
The data were analyzed to identify possible relationships between the SMI and the financial
indexes. The main techniques used were:Sustainability 2020, 12, 1742 6 of 18
• Principal component analysis (PCA).
• Simple linear regression.
• Simple robust linear regression.
• Simple linear regression’s Cook’s distance.
• Simple linear regression’s t-test.
• Simple robust linear regression’s t-test.
4. Results
4.1. Data Structure
Structured interviews and questionnaires resulted in five sustainability indices and eight features:
• SIC classification.
• Country.
• Employees.
• Operating income.
• Net margin.
• EBT.
• Return on assets.
• Return on equity.
Table A2 in Appendix A shows the five sustainability indices and the aggregate the SMI index.
4.2. Sustainability Indices PCA
Each sustainability index was divided by the maximum score it could achieve, based on its relative
number of items, and analyzed via PCA. Figure 2 shows that 85% of the variability could be attributed
to a single principal component, Figure 3 shows how the standardized maturity index, divided by
the maximum score it could achieve, correlated with the principal component. The maturity index
could be used for all the calculations, avoiding a choice between the single correlated indices.
Figure 2. Principal component analysis (PCA) on the standardized sustainability indices.Sustainability 2020, 12, 1742 7 of 18
Figure 3. Standardized sustainability principal component and standardized maturity index.
The PCA assessed that most of the total sustainability indices variance could be explained by
a single principal component, a linear combination of those indices. The principal component was then
compared with the SMI to verify that such an index could be used instead. Given a feature, instead
of individual linear regressions for each sustainability index a linear regression was developed for
the whole SMI.
4.3. Outlier Analysis
Simple linear regressions were fitted using the SMI index as the independent variable and in turn
some of the eight features as dependent variables. A visual inspection of the regressions scatter plots
revealed many potential outliers.
Figure 4a–f plots the standardized maturity index against economic features and the number of
employees respectively. In Figure 4a the companies having negative operating income were removed
and the feature was log-transformed to manage the high scale difference between data points, in
Figure 4f the employees were log-transformed as well. Figure 4b–e present potential outliers that could
tip the scale of a regression analysis.Sustainability 2020, 12, 1742 8 of 18
Figure 4. Standardized maturity index vs. respectively, (a) operating income; (b) net margin; (c) EBT;
(d) return on assets; (e) return on equity; (f) employees.
Not all the points furthest from the regression line are outliers and not all the outliers are influential
enough to significantly affect the regression line. The Cook’s distance was computed for each point and
each regression, it identified which points were influential enough to significantly affect the regression
line if deleted. Most of the regressions presented multiple influential points.
Figure 5a–d depicts the Cook’s distance of the maturity index regression against net margin,
EBT, return on equity and return on assets respectively. Figures 6 and 7 depict the Cook’s distanceSustainability 2020, 12, 1742 9 of 18
of the maturity index regression against log-transformed operating income and log-transformed
employees. The solid lines refer to the n4 threshold, with n = 53, usually applied for such visual
inspections. Figures 5–7 identify most of the potential outliers detected in Figure 4b–e as influential,
Figures 6 and 7 identify influential point for the log-transformed data. Table 2 lists those influential
points for each feature.
Figure 5. (a) Net margin Cook’s distance; (b) EBT Cook’s distance; (c) return on assets Cook’s distance;
(d) return on equity Cook’s distance.Sustainability 2020, 12, 1742 10 of 18
Figure 6. Log-transformed operating income Cook’s distance.
Figure 7. Log-transformed employees Cook’s distance.Sustainability 2020, 12, 1742 11 of 18
Table 2. The influential points for each feature according to Cook’s distance.
Feature Influential Points
Log(operating income) 1, 2, 3
Net margin 24, 28
EBT 24, 28
Return on assets 24, 28, 29, 31
Return on equity 24, 28
Log(Employees) 1, 2, 3
If in Table 2 the influential point was removed and the regression lines were refitted, the Cook’s
distance threshold criterion would identify other influential points. In the following section the same
regression models were applied both to the original dataset and to ones with the influential points
removed, to gauge how such an operation impacts on the results.
4.4. Regression
Given multiple influential points and a difficulty in assessing which ones were actual outliers,
different scenarios were run:
• Simple linear regressions on the original database.
• Simple linear regressions of the database without the influential points.
• Simple robust linear regression on the original database.
Table 3 presents the linear regression results for the original dataset, Table 4 for the dataset without
the influential points. In both cases the slopes were never significantly different from 0 and, while
the t-test normality assumptions are violated, it suggested lack of dependence between standardized
maturity index, and economic performance and employees respectively. Table 5 proposes alternative
robust regressions results, bisquare-weighting function, and they too suggested no dependence.
Table 3. Linear regression results for the original database.
Feature Parameter Estimate Squared Error t-Statistic p-Value
Intercept 2.90 1.38 2.10 0.04
Log(Operating income)
Slope −0.34 1.97 −0.17 0.86
Intercept 1.11 9.54 0.12 0.91
Net margin
Slope 18.92 13.74 1.38 0.17
Intercept 3.90 10.07 0.39 0.70
EBT
Slope 18.03 14.50 1.24 0.22
Intercept −8.88 10.81 −0.82 0.42
Return on assets
Slope 26.42 15.56 1.70 0.10
Intercept −7.49 9.97 −0.75 0.46
Return on equity
Slope 24.61 14.35 1.71 0.09
Intercept 4.67 1.04 4.50 0.00
Log(Employees)
Slope 1.23 1.50 0.82 0.41Sustainability 2020, 12, 1742 12 of 18
Table 4. Linear regression results for the database without the influential points.
Feature Parameter Estimate Squared Error t-Statistic p-Value
Intercept 3.65 1.12 3.27 0.00
Log(Operating income)
Slope −2.09 1.62 −1.29 0.20
Intercept 10.36 6.25 1.66 0.10
Net margin
Slope 5.28 8.99 0.59 0.56
Intercept 13.64 6.75 2.02 0.05
EBT
Slope 3.81 9.71 0.39 0.70
Intercept 5.16 3.57 1.44 0.16
Return on assets
Slope −0.21 5.19 −0.04 0.97
Intercept 3.04 5.82 0.52 0.60
Return on equity
Slope 9.36 8.37 1.12 0.27
Intercept 5.27 0.81 6.51 0.00
Log(Employees)
Slope −0.17 1.18 −0.14 0.89
Table 5. Robust linear regression results for the original database.
Feature Parameter Estimate Squared Error t-Statistic p-Value
Intercept 3.02 1.36 2.22 0.03
Log(Operating income)
Slope −0.93 1.93 −0.48 0.63
Intercept 9.90 6.37 1.55 0.13
Net margin
Slope 4.72 9.17 0.52 0.61
Intercept 12.38 7.45 1.66 0.10
EBT
Slope 4.91 10.73 0.46 0.65
Intercept 5.24 4.04 1.30 0.20
Return on assets
Slope −0.71 5.81 −0.12 0.90
Intercept 3.37 4.48 0.75 0.46
Return on equity
Slope 8.45 6.45 1.31 0.20
Intercept 4.79 0.96 4.97 0.00
Log(Employees)
Slope 0.80 1.39 0.58 0.57
The regression on the original database is proposed as an optimistic scenario, where all the potential
outliers are kept, potentially leading to spurious correlations. The regression on the original database
without influential points is proposed as a pessimistic scenario, where all the potential outliers are
removed, and the regression slope is less evident. The robust linear regression is proposed as an
intermediate scenario, the robust construction automatically weighted the potential outliers. A t-test
was run for each scenario and regression to identify which regression slopes were significantly different
from zero. The results suggested against the linear models hypothesis.
5. Discussion
The research undertaken, aimed at measuring the impact of specific sustainability strategies,
as underlying components of resilience, on financial performance of the companies. It can be
considered a first level joint assessment of the impact of sustainability practices and resilience
capabilities on companies’ financial performance. It can be placed within a research context where
some inconsistencies are still found: many of the studies on sustainability assessment issues concern
the manufacturing industry, while the service sector, despite its growing impact on global economy, is
still under-investigated [27]; moreover, the analyses mainly refer to developed countries [29], while
only few papers analyze the relationship between sustainability practices and firms’ performance in
the developing countries [22]. Our studied sample includes a wide variety of companies, allowing
a broad range analysis even if the current data-set represents early development of the research
The performed analysis shows that our aggregate sustainability index SMI, incorporating five
main sustainability domains, correlated to operational resilience capabilities, can be appropriately and
effectively used to analyze the correlation between sustainability practices and the range of financialSustainability 2020, 12, 1742 13 of 18
indexes. The regression results suggest that there is no dependence between SMI and economic
performance of the companies. Accordingly, we cannot prove any relationship between sustainability
practices, resilience and economic performance.
While much of the literature proffers a sustainable strategic imperative results in financial benefits,
our empirical research on 53 organizations does not support this view: profitability does not show
a significant relationship with sustainability. Interestingly, country of origin, size of the organization,
and market focus, likewise, do not have a significant relationship with our sustainability metric.
However, arguably, there might be additional business imperatives to bolster sustainable
operations, such as recognizing market sentiment in favor of a socially responsible organization;
that may result in increased market share. Sustainability-oriented organizations consider as positive
performances both performing the set of sustainable actions and the return of image among their
stakeholders [38]. Berns et al. [39] survey of 1500 global executives and managers concerning their
perspectives on the intersection of sustainability and business strategy identifies two tangible benefits
of sustainable developments including cost savings and new sources of revenue. They also list six
benefits as follows:
1. Improved brand image.
2. Employees’ satisfaction, morale and retention.
3. Product, service and market innovation.
4. Business process and model innovation.
5. Effective risk management.
6. Enhanced stakeholder relations.
Moreover, according to Hillman and Keim [40], sustainable strategies can increase demand for
products and services, attract more socially responsible consumers and reduce prices. The need for
identifying nonfinancial indicators of performance connected to sustainability practices is stressed by
some authors [41,42].
6. Conclusions
This empirical research is based on a data set under-development including, by now,
53 organizations differing by capital size, market focus, financial performance and geographic
regions, the selection of organizations and country of origin being arbitrary, and accessible. It identifies
a sustainable maturity index, derived from populating an operations sustainability maturity model.
The initial testing of the methodology, generalizability and rigor of the OSMM was conducted in
financial services organizations, located in developed and developing countries [22].
The performed data analysis does not support commonly reported arguments: we show that
profitability does not show a significant relationship with sustainable strategic intent. Accordingly,
as we showed that our model is consistent with resilience goals, we cannot suppose that resilience
capabilities impact on firms’ competitiveness.
The main limit of this study is related to the limited data sample size, representing early
development of the research. The long-term goal of the research is to allow a meta-comparative
analysis of SMI and its relationship with financial performance in various organizations and countries.
The research will continue collecting data in as many countries as possible. The granularity of analysis,
by country and industry sector, will test several hypotheses: for example, do particular countries or
Industry sectors have better SMIs and improved financial performance?
We also made an attempt of validating a relationship between organizational resilience and firms’
performance. The explored hypothesis will be further investigated for building up a framework
unifying sustainability and resilience indicators to be applied to different countries, and sectors, facing
different threats.
Lastly, further investigations will explore firms’ nonfinancial indicators of performance that are
connected to sustainability practices and which support firms’ resilience.Sustainability 2020, 12, 1742 14 of 18
Author Contributions: In the development and completion of this research paper, that covered the model
development and validation, data collection, evaluation of hypotheses testing, and drafting and writing of
the paper, the contribution made by each of the contributing authors is as follows: Conceptualization phase
(E.B., M.A.B., D.C., D.P., B.R.), Methodology (E.B., M.A.B., D.P., B.R.), Software application analytics (E.B., D.P.),
Validation (E.B., D.P.), Formal analysis (E.B., D.P.), Investigation (E.B., M.A.B., D.C., D.P., B.R.), Resources (D.P.,
B.R.), Data Curation (E.B., D.C., D.P., B.R.), Writing—Original Draft preparation (E.B., M.A.B., D.C., D.P., B.R.),
Writing—Review and Editing (E.B., M.A.B., D.C., D.P., B.R.), Visualization (E.B., M.A.B., D.P., B.R.), Supervision
(D.P., B.R.), and Project Administration (D.P., B.R.). All authors have read and agreed to the published version of
the manuscript.
Funding: This research received no external funding.
Conflicts of Interest: The authors declare no conflict of interest.
Appendix A
The Appendix A contains the companies’ profiles (Table A1) and the calculated sustainability
indexes (Table A2).
Table A1. The profiles of the 53 companies included in this study.
Co. Company Employees Operating Net Margin EBT ROA ROE
Country 1
No. SIC Code (No.) Income (AUS $) (%) (%) (%) (%)
1 6162 AUS 41,849 7955 23.30 33.37 0.67 12.87
2 6162 GBR 24,600 2443 23.80 35.41 0.52 11.66
3 6162 GBR 264,000 29,706 22.60 25.04 0.52 7.35
4 6311 AUS 963 220 11.70 17.28 8.97 12.79
5 6282 AUS 1200 443 32.21 35.03 9.58 18.92
6 6035 AUS 503 350 7.86 43.04 2.11 4.99
7 6311 AUS 1600 173 20.50 34.63 6.44 15.45
8 6321 AUS 47 38 20.06 29.73 3.95 3.97
9 6189 AUS 54 16 26.00 23.00 9.45 15.75
10 6022 JAM 2600 524.00 20.00 26.78 2.40 14.45
11 6162 JAM 1600 32. 21.67 20.48 1.51 2.76
12 2711 JAM 600 −2.71 −7.30 −7.30 −16.80 −32.80
13 2000 JAM 1940 58.67 5.10 6.90 3.90 10.00
14 2080 JAM 340 29.37 18.00 23.00 22.00 24.00
15 2851 JAM 126 1.41 6.00 7.00 12.00 20.00
16 2033 JAM 60 9.83 7.00 8.00 10.00 8.00
17 6199 JAM 2292 139.73 19.00 24.00 3.30 20.00
18 6162 JAM 650 50.09 19.40 17.00 1.23 9.91
19 6199 JAM 300 26.31 11.90 13.50 1.00 10.10
20 3540 GBR 238 38.20 17.85 0.10 −0.45 −0.54
21 3600 GBR 1500 51.00 0.32 43.00 0.54 0.87
22 3679 GBR 190 7.12 8.79 7.69 11.31 17.21
23 3490 GBR 78 7.01 15.31 16.12 13.47 16.14
24 3679 GBR 225 −0.25 −66.89 −70.02 −47.53 −85.90
25 3640 GBR 343 −1.64 −0.14 −0.34 −0.22 −1.03
26 1540 MHL 576 4.25 21 21 10.00 20.00
27 6022 MHL 136 10.8 40.6 44.3 3.40 11.80
28 8700 MHL 90 31.9 86.8 88.9 86.80 85.80
29 6022 MHL 20 0.255 9.6 14 89.00 13.30
30 2711 MHL 20 0.446 15 14 11.00 16.00
31 1540 MHL 120 4.34 55 10 90.00 60.00
32 5140 MHL 110 16.59 35 30 8.00 9.00
33 3490 ITA 32 5.216 3.4 4.83 3.00 1.54
34 7380 KIR 5 0.0842 2.8 2.8 1.80 1.80
35 8741 KIR 35 6.6 2.90 3.2 1.60 1.80
36 0900 KIR 280 15.44 15.00 27.50 4.00 6.50
37 5141 TUV 45 0.4 5 8 10.00 7.00
38 5080 TUV 20 0.42 7 10 8 6
39 5080 TUV 5 0.32 6 9 9 8Sustainability 2020, 12, 1742 15 of 18
Table A1. Cont.
Co. Company Employees Operating Net Margin EBT ROA ROE
Country 1
No. SIC Code (No.) Income (AUS $) (%) (%) (%) (%)
40 3640 GBR 195 8.01 9.2 7.5 13.2 18.4
41 3640 GBR 1355 48.5 1.1 37.2 1.2 0.9
42 6199 GBR 1233 372.3 28.1 27.3 7.6 12.3
43 6199 GBR 65 5.2 13.2 14.7 12.9 15.7
44 2870 ITA 23 0.20652 3 2 1.8 2.5
45 3560 AUS 1100 2.93 25.1 22.5 3.2 9.4
46 4941 AUS 122 4.2 35.1 10.4 27.2 16.7
47 6500 AUS 162 4.8 2.2 −0.4 −8.4 −0.23
48 3620 AUS 42 4.7 11.7 4.8 4.1 5.3
49 6199 AUS 116 4.8 2.6 3.7 2.8 1.6
50 6199 AUS 204 67 2.2 4.4 1.4 2
51 3640 AUS 167 3.2 1.9 6.9 1.5 1.8
52 3640 AUS 87 2.7 3 3.6 0.2 1.5
53 6199 AUS 52 1.9 1.1 0.2 0.3 0.6
1 The country code is assigned according to the ISO 3166-1 (alpha-3 codes).
Table A2. Calculated data for the five operation sustainability domains and SMI.
Company No. Total CS Total EC Total SC Total HC Total NC SMI Total
1 156 77 55 98 38 424
2 159 90 57 103 36 445
3 113 72 41 73 26 325
4 74 54 23 54 14 219
5 94 57 28 69 20 268
6 72 54 21 68 13 228
7 120 73 37 80 22 332
8 48 32 15 49 8 152
9 46 32 17 46 11 152
10 159 92 56 104 35 446
11 150 91 58 103 27 429
12 115 66 47 79 28 335
13 156 91 60 109 33 449
14 161 94 58 106 40 459
15 135 77 41 81 35 369
16 141 81 51 87 37 397
17 139 85 51 76 20 371
18 120 88 54 94 15 371
19 156 88 57 92 32 425
20 53 59 25 63 13 213
21 71 47 20 68 13 219
22 77 40 18 63 19 217
23 72 41 24 77 11 225
24 70 49 22 66 17 224
25 69 43 25 61 14 212
26 142 90 56 103 35 426
27 133 77 57 99 34 400
28 134 73 53 89 39 388
29 150 94 58 106 40 448
30 136 85 48 90 30 389
31 119 72 47 81 31 350
32 100 43 39 40 18 240
33 70 45 18 53 12 198
34 136 87 43 93 34 393Sustainability 2020, 12, 1742 16 of 18
Table A2. Cont.
Company No. Total CS Total EC Total SC Total HC Total NC SMI Total
35 156 90 55 94 38 433
36 162 83 58 108 39 450
37 138 73 53 98 36 398
38 139 75 45 101 33 393
39 113 76 50 89 35 363
40 70 40 21 62 21 214
41 82 53 24 71 22 252
42 87 45 31 70 18 251
43 81 37 31 81 13 243
44 135 90 31 92 30 378
45 104 45 35 49 25 258
46 88 57 32 67 25 269
47 84 51 31 65 26 257
48 83 54 31 53 22 243
49 96 47 29 61 30 263
50 101 23 33 60 34 251
51 98 32 45 52 22 249
52 67 36 42 87 18 250
53 78 40 39 78 22 257
References
1. Feil, A.A.; Schreiber, D.; Haetinger, C.; Strasburg, V.J.; Barkert, C.L. Sustainability Indicators for Industrial
Organizations: Systematic Review of Literature. Sustainability 2019, 11, 854. [CrossRef]
2. Hosseini, S.; Barker, K.; Ramirez-Marquez, J.E. A review of definitions and measures of system resilience.
Reliab. Eng. Syst. Saf. 2016, 145, 47–61. [CrossRef]
3. Roostaie, S.; Nawari, N.; Kibert, C.J. Integrated sustainability and resilience assessment framework: From
theory to practice. J. Clean. Prod. 2019, 232, 1158–1166. [CrossRef]
4. Faber, M.H. On sustainability and resilience of engineered systems. In Routledge Handbook of Sustainable and
Resilient Infrastructure; Routledge: Abingdon, UK, 2019; pp. 28–49.
5. Fahimnia, B.; Jabbarzadeh, A. Marrying supply chain sustainability and resilience: A match made in heaven.
Transp. Res. Part E Logist. Transp. Rev. 2016, 91, 306–324. [CrossRef]
6. Milman, A.; Short, A. Incorporating resilience into sustainability indicators: An example for the urban water
sector. Glob. Environ. Chang. 2008, 18, 758–767. [CrossRef]
7. Redman, C.L. Should sustainability and resilience be combined or remain distinct pursuits? Ecol. Soc. 2014,
19, 37. [CrossRef]
8. Marchese, D.; Reynolds, E.; Bates, M.E.; Morgan, H.; Clark, S.S.; Linkov, I. Resilience and sustainability:
Similarities and differences in environmental management applications. Sci. Total Environ. 2018, 613,
1275–1283. [CrossRef]
9. Herbane, B. A Business Continuity Perspective on Organisational Resilience. In IRGC Resource Guide on
Resilience; Florin, M.-V., Linkov, I., Eds.; EPFL International Risk Governance Center (IRGC): Lausanne,
Switzerland, 2016; Volume 1.
10. Francis, R.; Bekera, B. A metric and frameworks for resilience analysis of engineered and infrastructure
systems. Reliab. Eng. Syst. Saf. 2014, 121, 90–103. [CrossRef]
11. Annarelli, A.; Nonino, F. Strategic and operational management of organizational resilience: Current state of
research and future directions. Omega 2016, 62, 1–18. [CrossRef]
12. Bhamra, R.; Dani, S.; Burnard, K. Resilience: The concept, a literature review and future directions. Int. J.
Prod. Res. 2011, 49, 5375–5393. [CrossRef]
13. Lee, A.V.; Vargo, J.; Seville, E. Developing a tool to measure and compare organizations’ resilience. Nat. Hazards
Rev. 2013, 14, 29–41. [CrossRef]Sustainability 2020, 12, 1742 17 of 18
14. D’Agostini, M.; Tondolo, R.D.R.P.; Camargo, M.E.; Dullius, A.I.D.S.; Tondolo, R.D.R.P.; Russo, S.L.
Relationship between sustainable operations practices and performance: A meta-analysis. Int. J. Prod.
Perform. Manag. 2017, 66, 1020–1042. [CrossRef]
15. Dalziell, E.P.; Mcmanus, S.T. Resilience, vulnerability, and adaptive capacity: Implications for system
performance. Int. Forum Eng. Decis. Mak. 2004, 17. Available online: https://ir.canterbury.ac.nz/handle/
10092/2809 (accessed on 25 February 2020).
16. Hollnagel, E. Introduction to the Resilience Analysis Grid (RAG); 2015, pp. 1–16. Available online: https:
//erikhollnagel.com/onewebmedia/RAG%20Outline%20V2.pdf (accessed on 25 February 2020).
17. Li, X.; Wu, Q.; Holsapple, C.W.; Goldsby, T. An empirical examination of firm financial performance along
dimensions of supply chain resilience. Manag. Res. Rev. 2017, 40, 254–269. [CrossRef]
18. Yarveisy, R.; Gao, C.; Khan, F. A simple yet robust resilience assessment metrics. Reliab. Eng. Syst. Saf. 2020,
197, 106810. [CrossRef]
19. De Mandojana, N.O.M.; Bansal, P. The long-term benefits of organizational resilience through sustainable
business practices. Strateg. Manag. J. 2015, 37, 1615–1631. [CrossRef]
20. Macuzić, I.; Tadic, D.; Aleksic, A.; Stefanovic, M. A two step fuzzy model for the assessment and ranking
of organizational resilience factors in the process industry. J. Loss Prev. Process. Ind. 2016, 40, 122–130.
[CrossRef]
21. Fiksel, J. Sustainability and resilience: Toward a systems approach. IEEE Eng. Manag. Rev. 2007, 35, 5.
[CrossRef]
22. Parker, D.W.; Loh, A.; Chevers, D.; Minto-Coy, I.; Zeppetella, L. Operations sustainability maturity model:
Preliminary findings of financial services in developing and developed countries. Meas. Bus. Excel. 2017, 21,
309–336. [CrossRef]
23. Magon, R.B.; Thomé, A.M.T.; Ferrer, A.L.C.; Scavarda, L.F. Sustainability and performance in operations
management research. J. Clean. Prod. 2018, 190, 104–117. [CrossRef]
24. Prayag, G.; Chowdhury, M.; Spector, S.; Orchiston, C. Organizational resilience and financial performance.
Ann. Tour. Res. 2018, 73, 193–196. [CrossRef]
25. Gunasekaran, A.; Rai, B.K.; Griffin, M. Resilience and competitiveness of small and medium size enterprises:
An empirical research. Int. J. Prod. Res. 2011, 49, 5489–5509. [CrossRef]
26. Loh, A.; Parker, D. Corporate Sustainability Maturity Model: The Development of a Framework and Standardised
Assessment Instrument; Working Paper Series; The University of Queensland: Brisbane, QLD, Australia, 2016.
27. Goyal, P.; Rahman, Z.; Kazmi, A.A. Corporate sustainability performance and firm performance research:
Literature review and future research agenda. Manag. Decis. 2013, 51, 361–379. [CrossRef]
28. Alshehhi, A.; Nobanee, H.; Khare, N. The Impact of Sustainability Practices on Corporate Financial
Performance: Literature Trends and Future Research Potential. Sustainability 2018, 10, 494. [CrossRef]
29. Aggarwal, P. Impact of Sustainability Performance of Company on its Financial Performance: A Study of
Listed Indian Companies. Glob. J. Manag. Bus. Res. Financ. 2013, 13, 61–70.
30. Lassala, C.; Apetrei, A.; Sapena, J. Sustainability matter and financial performance of companies. Sustainability
2017, 9, 498. [CrossRef]
31. De Carvalho, A.O.; Ribeiro, I.; Cirani, C.B.S.; Cintra, R.F. Organizational resilience: A comparative study
between innovative and non-innovative companies based on the financial performance analysis. Int. J. Innov.
2016, 4, 58–69. [CrossRef]
32. Springer Nature Switzerland AG. Revisiting Supply Chain Risk; Zsidisin, G.A., Henke, M., Eds.; Springer:
Cham, Switzerland, 2019; Volume 7.
33. Prashar, A.; Sunder M, V. A bibliometric and content analysis of sustainable development in small and
medium-sized enterprises. J. Clean. Prod. 2020, 245, 118665. [CrossRef]
34. Avery, G.C.; Bergsteiner, H. Sustainable leadership practices for enhancing business resilience and
performance. Strateg. Leadersh. 2011, 39, 5–15. [CrossRef]
35. Rajesh, R. On sustainability, resilience, and the sustainable–resilient supply networks. Sustain. Prod. Consum.
2018, 15, 74–88. [CrossRef]
36. Sabahi, S.; Parast, M.M. Firm innovation and supply chain resilience: A dynamic capability perspective.
Int. J. Logist. Res. Appl. 2019, 1–16. [CrossRef]
37. Golicic, S.L.; Flint, D.J.; Signori, P. Building business sustainability through resilience in the wine industry.
Int. J. Wine Bus. Res. 2017, 29, 74–97. [CrossRef]Sustainability 2020, 12, 1742 18 of 18
38. Carmeli, A.; Dothan, A.; Boojihawon, D.K. Resilience of sustainability-oriented and financially-driven
organizations. Bus. Strateg. Environ. 2019, 29, 154–169. [CrossRef]
39. Berns, M.; Townend, A.; Khayat, Z.; Balagopal, B.; Reeves, M.; Hopkins, M.S.; Kruschwitz, N. The Business
of Sustainability: What it Means to Managers Now. MIT Sloan Management Review 2009, 51, 20–26.
40. Hillman, A.J.; Keim, G.D. Shareholder value, stakeholder management, and social issues: what’s the bottom
line? Strateg. Manag. J. 2001, 22, 125–139. [CrossRef]
41. Porter, M.E.; Kramer, M.R. The Big idea Creating Shared Value how to reinvent capitalism-and unleash
a wave of innovation and growth. Harvard Business Review, January–February 2011; 1–17. Available online:
https://hbr.org/2011/01/the-big-idea-creating-shared-value (accessed on 25 February 2020).
42. Sroufe, R.; Gopalakrishna-Remani, V. Management, Social Sustainability, Reputation, and Financial
Performance Relationships: An Empirical Examination of U.S. Firms. Organ. Environ. 2018, 32, 331–362.
[CrossRef]
© 2020 by the authors. Licensee MDPI, Basel, Switzerland. This article is an open access
article distributed under the terms and conditions of the Creative Commons Attribution
(CC BY) license (http://creativecommons.org/licenses/by/4.0/).You can also read