Endesa 2020-22 Strategic Plan Update - November 27, 2019

Page created by Milton Ortega
 
CONTINUE READING
Endesa 2020-22 Strategic Plan Update - November 27, 2019
Endesa 2020-22
Strategic Plan Update
November 27, 2019
Endesa 2020-22 Strategic Plan Update - November 27, 2019
Agenda

                      Our Positioning
         José Bogas
            CEO
                      Our vision

                                        Strategic plan
         Luca Passa   Strategic Plan
            CFO       Update: 2020-22
                                        Key Financial Indicators

         José Bogas   Closing Remarks

                                                                   2
Endesa 2020-22 Strategic Plan Update - November 27, 2019
Endesa 2020-22
Strategic Plan Update

Our positioning
Endesa 2020-22 Strategic Plan Update - November 27, 2019
A portfolio of strategic assets(1)
Our positioning

                            1st network                                                                     Infrastructures & Networks

                             operator(2)
                                                                                                        117 TWh distributed (3)
                                                                                                        ~12 mn Smart meters(4)

                                                                                                                   Generation

                            1st player in
                            generation                                                                     61.4 TWh output
                                                                                                            ~58% CO2 free

                                                                                                                    Customers
                        Largest retail
                       customer base                                                                     ~99 TWh power sales
                                                                                                          12.3 mn Customers

                                                    First integrated player leading energy transition in Iberia
                      (1)   2019E                       (3)   Net distributed energy
                      (2)   By distributed energy       (4)   Includes LV and HV full deployment                                         4
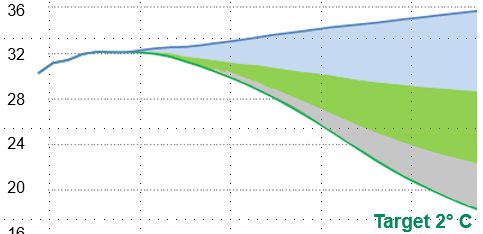
Endesa 2020-22 Strategic Plan Update - November 27, 2019
Our positioning

                    Delivery on 2019-21 Strategic Plan: operating
                    targets                                    Target
                                                                                                                               2019-21
                                                                                                      2018       2019E         Old plan

                          Renewables focus (% of total capacity)                                     29%          31%           38%
                                                                                                                                          Decarbonisation
                                                                                                                           ✔
                          CO2 Footprint (% CO2 emission free generation)                             ~50%         58%           ~56%

                          Power Integrated Margin (€/MWh)                                            25.7          26            ~27

                         Sales (TWh liberalized(1))                                                   ~82          83              90     Customer value

                          Endesa X (mn e-home clients)                                                2.1          2.2             2.5

                          Digitalisation (€mn Digital Capex)                                          0.3         0.7(2)        1.3(3)     Digitalisation

                             ✔ Ahead of target

                                                                                         Sound progress on all strategic pillars
                  (1)   Excluding international sales and Small Consumer Voluntary Price (SCVP)
                  (2)   Cumulated figure 2018-2019E                                                                                                         5
                  (3)   Cumulated figure 2018-2021
Endesa 2020-22 Strategic Plan Update - November 27, 2019
Our positioning

                     Delivery on 2019-21 Strategic Plan: financial
                     targets
                                                                                                                                       ✔               CAGR
                                                                                             2014                       2019E                         2014-19E                                                               TSR, %
                                                                                                                                         Above target
                                                                                                                                         2019: €1.8 bn

                  CAPEX (€bn)                                                                 0.8                          1.9                         +19%
                                                                                                                                                                                                                 (2)
                                                                                                                                                                                                          148
                                                                                                                                                                                                 140

                                                                                                                                                                                                                       (2)
                                                                                                                                                                                                 120

                  EBITDA (€bn)                                                                3.1                           3.7                         +4%                                      100

                                                                                                                                                                                                  80

                  Net ordinary income (€bn)                                                   0.9                           1.5                        +11%                                       60

                                                                                                                                                                                                  40

                  Gross DPS (€/sh)                                                           0.76                         ~1.4                         +13%                                13.5€(1)
                                                                                                                                                                                                  20
                                                                                                                                                                                                                                     57
                                                                                                                                                                                                   -
                                                                                                                                                                                                                                               11
                                                                                                                                                                                                       ENDESA                 EuroStoxx
                                                                                                                                                                                                                             EUROSTOXX         IBEX
                                                                                                                                                                                                                                              Ibex 35
                  Net ordinary income / EBITDA                                               29%                          41%                                                                                                   UTIL.
                                                                                                                                                                                                                                 Util.

                                                                                                                                                                                                           11.2%                SRI Investors(3)
                              ✔ In line with targets

                                       Improved economic results driven by repositioning through a sustainable strategy
                   (1)   Preferential subscription share price on November 20th, 2014 (latest IPO)                                                       (3) Socially Responsible Investors over total Capital as of December 2018
                   (2)   Includes dividends assumed to be re-invested (2019 share price as of Nov 25th: 24.62 €/sh). Calculated with Bloomberg data                                                                                                     6
Endesa 2020-22 Strategic Plan Update - November 27, 2019
Our positioning

                  Repositioning capital allocation on renewables

                              Generation capex: 2014 vs 2019E                                       Mainland installed capacity, GW

                               13%
                                                                                                                                 19.0
                                                                                                       17.1
                                                     33%
                                                                                                        4.7                       7.4
                        2014
                                                             2019E
                       0.3 €bn
                                                             1.2 €bn
                                                                             67%                        12.4                     11.6
                       87%

                                                                                                       2014                      2019E

                    20x capex increase in decarbonizing our generation mix                                     RES on mainland
                                                                                                  28%                               ~40%
                                                                                                                  capacity

                                                                    Renewables     Conventional Generation

                                         Reshape of our business model focusing on decarbonisation
                                                                                                                                           7
Endesa 2020-22 Strategic Plan Update - November 27, 2019
Our positioning

                        Enabling platforms for the Energy Transition

                                               Infrastructure & Networks                                                                                        Retail (Power)

                                                                                                                                                                       2014      2019E
                                                                     +25%
                                                                                                                                        Free clients
                                                                                                                                                                       4.5        5.9
                                       1

                     Net Capex                                                                                                          (mn)
                     (€bn)
                                       1

                                       0
                                                                                         0.5
                                                      0.4                                                                               Unitary integrated margin(2)
                                                                                                                                                                        19        26
                                       0

                                       0
                                                                                                                                        (€/MWh)
                                       0

                                       -

                                                     2014                               2019E
                                                                                                                                                                  Endesa X
                  Smart meters
                  (mn)
                                                        5                               ~12 (1)
                                                                                                                                                                       2014      2019E
                  Net distributed energy                                                                                                E-Home clients
                  (TWh)
                                                      111                                117                                                                           1.3        2.2
                                                                                                                                        (mn)

              Unitary Opex                                                                                                              Charging points(3)
              (€/end user)
                                                       59                                 43                                                                            -          5
                                                                                                                                        (k#)

                                                          Established a leading position in infrastructures and new services
                                 (1)       Includes LV and HV full deployment                     (3)   Public (1k) and private (4k) charging points
                                 (2)       Includes Generation margin + Supply margin
                                                                                                                                                                                         8
Endesa 2020-22 Strategic Plan Update - November 27, 2019
Endesa 2020-22
Strategic Plan Update

Our vision
Endesa 2020-22 Strategic Plan Update - November 27, 2019
Our vision

             Sector trends shaping our capital allocation

                     Decarbonisation
                                          Enabling      Ecosystems
                                       Infrastructure   & Platforms

                     Electrification

                                                                      10
Our vision

             New opportunities arising from decarbonisation

                     CO2 emissions and actions needed to achieve Paris’ goals

             GtCO2
                                                       Current trajectory                       Revolution of the energy paradigm towards
                                                                                                non-fossil sources. Electricity is the key
                                                                            Energy efficiency   element:

                                                                                                •   Increases efficiency in final energy
                                                                            Renewables
                                                                                                    consumption
                                                                            Other solutions
                                                                                                •   Clean energy: zero CO2 and other
                                                                                                    emissions

                                                                                                •   Allows to increase renewable energy
                 2010                2020       2030              2040
              1. IEA WEO 2018 SDS Scenario

                                             Electrification as key element to achieve the Paris’ goals

                                                                                                                                             11
Our vision

               Integrated National Energy and Climate Plans
               2021-30
                                                                GHG emissions                                                 Energy
                                                                                              Renewables                                  Interconnection
                                                                  reduction                                                  efficiency

                                                                                              >32% on final                  32.5%(1)          15%
             2030 EU targets                                   40% vs. 1990 level           energy consumption

                                                                                    Energy and Climate Integrated National Plan (PNIEC)
                      Spain                                                                   42% on final
                                                                   21% vs. 1990                 energy use
                                                                  (48% vs. 2005)                                             39.6%(1)          15%
               Energy and                                                                     74% on power
                                                                                                generation
                 Climate
                strategic                                                           Draft on Climate Change and Energy Transition Law
               framework
                                                                                                  Fair Transition Strategy

                                         236 €bn investments’ opportunities from the Energy Transition in Spain
                (1)   Savings in primary energy consumption vs. reference level
                                                                                                                                                            12
Our vision

             Accelerated coal phase out over the plan period
             and beyond
                                                     Business Plan 2020-22

              Coal capacity
                                      5.3    5.1               0.2           99%   0.2        -
                  (GW)        30. 0

                                      26.3
                              25. 0

                              20. 0

             Coal production
                  (TWh)       15. 0

                                                                                          COAL PHASE
                                                                                             OUT
                              10. 0

                                             8.1
                               5.0

                                                                             99%
                                                               0.1                 0.1
                               0.0

                                      2015   2019E             2022                2024      0.0
                                                                                             2030

                                             Mainland coal phase out by 2022
                                                                                                       13
Our vision

                   Progressing towards total decarbonisation in 2050

                                                 Total mainland capacity, GW                                   Total mainland output, TWh

             +0.9 GW
              in 2019                19.0               2.8                                                                           -6.0          52.1
                                                                       -4.5          17.3              49.5            8.4
                Rnws                                                                                    9.4
                                      7.4                                                                                                           17.8

               Nuke                                                                  10.2
                                      3.3                                                              26.3
                                                                                                                                                    26.5(1)
               Thermal                4.5        Coal
                                                                                     3.3
                                                                                                        6.6     Coal
                                      3.8        CCGT                         CCGT   3.8
                                                                                                        7.2     CCGT                         CCGT   7.8
                                    2019E        Renewables            Coal          2022              2019E      Renewables         Thermal        2022

                                    ~40%                Renewable capacity           ~60%               ~72%            CO2 emissions free           ~85%

                                                                              Generation mix fully reshaped

                   (1)   Load factors increase
                                                                                                                                                              14
Our vision

                  Renewable generation 2019-22: our main growth
                  platform
                                              Installed capacity, GW                             Output by technology, TWh

                                                       +38%                                                 ~2x
                                                                        10.2
     +0.3 GW Solar                                                                                                             17.8
     +0.6 GW Wind                                             0.9
        in 2019E                                                         2.2                                            1.6
                                    7.4        1.9                                                                             3.3
             Solar                                                                                             3.6
                                    0.3
                                                                         3.2             9.4
             Wind                   2.3                                                           3.2                          7.6
                                                                                         0.1
                                                                                         4.0
             Hydro(1)               4.8                                  4.8
                                                                                         5.3                                   6.9

                                  2019E        Solar          Wind       2022           2019E     Solar        Wind    Hydro   2022

                                                       ~40% increase of renewable installed capacity in 2022
                  (1)   Includes mini-hydro
                                                                                                                                      15
Our vision

                          Strategy in Renewables

                                  Renewables pipeline(1) (GW)                         Pipeline by technology     Indicative hedging strategy

             100 .0

              90. 0

              80. 0
                          16.1                                                             12%
              70. 0
                                                                                                                33%                       Long term
              60. 0
                                                                  Total 4.1 GW                                                            customers
                                                                                                                               33%
              50. 0

                                                                                            4.1 GW                                        Long term PPAs
              40. 0

                                             12.0
              30. 0

              20. 0
                                                                                                                                          Rest of portfolio
              10. 0

                                                                  2.9                             88%                 33%
               0.0
                                                                            1.2
                      Gross Pipeline Early stage               COD         COD
                                                              2020-22   Beyond 2022       Solar      Wind

                                  4.6 GW(2) with awarded connecting
                                                                                                                IRR-WACC spread >200bps
                                                 points

                                                        Leveraging on our customer base to accelerate renewables development
                            (1)   As of October 2019
                            (2)   Incudes 0.5 GW in early stage
                                                                                                                                                       16
Our vision

             Progressing towards total decarbonisation in 2050
                                                                                CO2 specific emissions(1), g CO2/kWh

                                                                         -18%
                                                                   538
                                                                                               ~ -70%
                                                                                 439

                        Scope 1(1)
Our vision

                  Enabling Infrastructure

                                                                           Energy system evolution

                                                                       Pivotal role in the Energy Transition

                              DSO/TSO                          Grid Edge Transformation enabling platformization of
                                                                                  the sector
             Microgrids                   Aggregator

                                                                 Innovation and resilience required in a changing
                                                                                  environment

                                                                 Engagement of customers for a more active role

                          Infrastructures to enable integration of new renewables and electric vehicle
                                                                                                                      18
Our vision

                    Enabling Infrastructure
                    Continuous focus on operational efficiency

                               Net distributed energy, TWh                       OPEX, €/end user

                                                      +3%                              -9%
                                                                                                                  Resiliency and flexibility

                                                                                                                Service quality improvement
                                       117                  121
                                                                                 43
                                                                                              39
                                                                                                               Deployment of smart meters and
                                                                                                                       smart grids
                                          1                  2

                                     2019E                  2022               2019E         2022

             Losses(1) (%)              9.5                 9.2

        Minutes of
                                         64                  52
      interruption(2)

                                              Better service quality reducing interruptions, losses and improving efficiency
                    (1)   System Operator (S.O) criteria
                    (2)   Own + Programmed + Transport                                                                                          19
Our vision

             Ecosystems and platforms

                   Share of power on total energy consumption(1),%                             Endesa X: Acceleration of electrification

                                                                                               Charging points(2) (th.)       e-Home clients (mn)
                                             23%
                                                                           29%
                                                                                                       +7x                            +27%
                                 2018                               2030

                                                                                          40

                                                                                                               36         3
                                                                                                                                             2.8
                                                                                          35

                                                                                          30
                                                                                                                          3

                                                                                                                              2.2
                                                                                                                          2

                                                                                          25

   Electric vehicles
                                     0                               5                    20
                                                                                                                          2

   (mn)                                                                                   15

                                                                                                                          1

                                                                                          10

                                                                                                 5
                                     7                               24
                                                                                                                          1

    Transport (TWh)                                                                        5

                                                                                           -
                                                                                                                          -

                                                                                               2019E           2022           2019E          2022
   Residential share
                                   38%                              45%
   of power

                                                        Platforms development to support demand electrification
             (1)   Source: Spanish PNIEC
             (2)   Public and private charging points                                                                                               20
Our vision

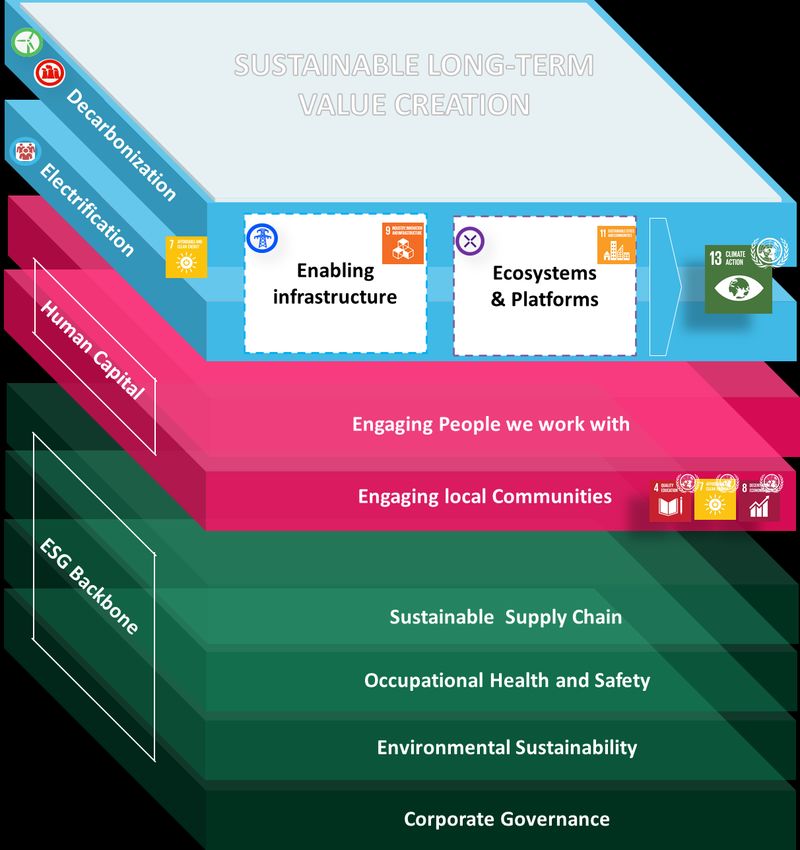
             A fully sustainable capex plan reflected in SDGs
             impacts
                              Capital allocation by SDG 2019E-22                              SDGs impacts at 2022

                                                                                                                                     2014

                                                                                                          ~60%                       28%
                                                                                              RES Capacity/Mainland Capacity
                                             9%

                                                                                                        ~12 mn                       5 mn
                                                  7.7 €bn                                              Smart Meters (1)

                                                              56%
                                           26%
                                                                                                           36 k                      n.a.
                                                                                              charging points (public and private)

                                                            ~90% allocated to climate action (SDG 13)
                                                                                                                                            21
  (1) Includes LV and HV full deployment
Endesa 2020-22
Strategic Plan Update

Strategic plan
2020-22 Strategic Plan

                            Key Financial Indicators
                            Net Capex analysis, €bn
                                                                  By nature                                                                 By business                              By strategic pillar

                                                                       +20%                                                                    +1.3 €bn
                                                                                        7.7                                                               7.7
                                                                                                                                                          0.5
                                                            6.4                                                                        6.4                                 Decarbonisation             5.2
                                                                                                                                       0.7
                                 Asset                                                  4.8                                                               3.8
                                                            3.3                                                                        2.0                                 Electrification             0.3
                              development

                                Asset                                                                                                  1.9                                 Enabling infrastructure     2.0
                                                                                                                                                          2.0
                              management                    2.4                         2.3
                                                                                                                                       1.8                1.4
                                  Customer (1)              0.7                                                                                                            Ecosystems & Platforms      0.2
                                                                                        0.6
                                                        2018-21                    2019E-22                                        2018-21            2019E-22
                                                                                                                                    Conventional
                                                                                                                                                           Networks
                         Gross capex                                                                                                Generation(2)
                                                           7.1                          8.4
                                                                                                                                    Retail + Endesa X      Renewables(3)

                                                         More than 20% increase in total capex and 45% increase in asset development
                            (1)    Customer capex includes Cost to Acquire new customers, Connections and Investments associated with new services.
                            (2)    Includes Net Capex in non mainland
                            (3)    Renewables capex includes Hydro investments                                                                                                                               23
2020-22 Strategic Plan

                         Decarbonisation
                         Renewables

                                                    Renewables net capex 2019E-22                                 EGPE(1) gross margin evolution, €bn

                                                                        6%                                                      1.3x

                                                                                                                                           0.7

                                                                       3.8 €bn
                                                                                                                       0.3

                                                                               94%
                                                                                                                      2019E               2022

                                                        Asset                          Asset
                                                        development                    management

                                                                                 Doubling renewable capex drives gross margin growth
                         (1)   EGPE includes wind, solar and mini hydro. It excludes large hydro                                                        24
2020-22 Strategic Plan

                         Electrification
                         Maintaining leadership in the power business
                                            Total energy sold 2019E-22(1), TWh                                                                                     Power integrated margin(2), €/MWh

                                                                                       +4%
                                                                                 (3)
                                                                          99.1                        103.1
                                         Regulated                        13.6                         12.9                                            Unitary revenue        ~68             ~69
                                                                          20.0                         22.3
                                         Free B2C

                                          Free B2B                        65.6                         67.9

                                                                        2019E                          2022
                                                                                                                                                         Unitary integrated
                               Free customers                                                                                                            margin               ~26             ~30
                                                                           5.9                           6.6            +12%
                               mn
                               Regulated customers
                                                                           4.8                           4.1             -14%                                                 2019E           2022
                               mn

                               Churn rate (4)
                                                                          9.6%                         8.9%              -7%
                               %

                                                                                                 Consolidating integrated margin growth
                         (1)     Total liberalized sales include international sales (2.7 TWh in 2019E and 3.0 TWh in 2022), not   (3)   Rounded figures
                                 considered in the integrated margin.                                                              (4)   Churn rate B2C free                                           25
                         (2)     Includes Generation and Supply margin
2020-22 Strategic Plan

                              Electrification
                              Consolidating as the 2nd gas operator

                                                       Volumes sold 2019E-22(1), TWh                                        Key figures

                                                                              +3%                                            2019E        2022   Var. 2019E-22

                                                                 87                  89
                                                                                                      Free customers
                                   CCGT sales                                                                                 1.4         1.6       +14%
                                                                 20                  24               mn

                                                                                                      Regulated customers
                                                                                                                              0.2         0.2        +0%
                                                                                                      mn
                                   Retail
                                                                 67                  65
                                                                                                      Total customers(2)
                                                                                                                              1.7         1.8        +6%
                                                                                                      mn

                                                              2019E                  2022
                                                                                                      Unitary margin(3)
                                                                                                                              ~3          ~3
                                                                                                      €/MWh
                         Churn rate (%)                         8.7%                 8.2%

                                                                   Lower sales in retail due to progressive electrification of demand
                             (1)    Not included Wholesale business
                             (2)    Rounded figures
                             (3)    Gas unitary margin does not include CCGT sales
                                                                                                                                                                 26
2020-22 Strategic Plan

                         Electrification
                         Improving efficiency and digitalisation

                                                                     Digital KPIs(1)                                   Cost to Serve(1) , €/customer

                                                                                       +29%

                                                                                                                                           -14%
                                        e-billing,                              3.5           4.5
                                                                      2.8
                                               mn

                                                                                       +4pp
                                                                                                                       10.9        10.6
                                 Digital sales,                                                                                                   9.1
                                                                                10%           14%
                                      % digital                       6%
                                                                                                                       2018        2019E          2022
                                                                                       +6%

                           Digital contracts,                         4.4       4.7           5.0
                                         mn
                                                                     2018      2019E          2022

                                                                              Digitalisation driving cost to serve reduction
                         (1)   Power and gas. Not including Social Bonus
                                                                                                                                                         27
2020-22 Strategic Plan

                               Enabling infrastructures
                               Investments in networks

                                                                            Net Capex(1) 2019E-22, €bn

                                                                                                       2.0                           Resiliency and flexibility in grids facing
                                      Smart meters                              1.9                                                          the Energy Transition
                                                                                                       0.1
                                                                        0.1
                                      Customers                                  0.1
                                                                                                       0.8
                                       Asset Management                         0.7                                                  1.1 €bn (~50%) capex in digitalisation to
                                                                                                                2.0
                                                                                                                         +11%                  promote efficiencies
                                                                                               1.8                    vs. old plan
                                      Asset Development                         1.0                    1.1
                                                                                                                                           100% capex devoted to RAB
                                                                              2018-21                2019E-22

                                                                                                Double digit growth in Networks capex

                         (1)   2019E-2022 Gross capex 2.6€bn (includes client contributions)                                                                                      28
2020-22 Strategic Plan

                             Enabling infrastructures
                             Margin evolution

                                                    Networks margin, €bn                           2020-25 New remuneration draft

                                      2.6
                                                                                2.5             Confirms 5.58% RoR (6.003% in 2020)
                                                   -0.15          +0.03
                           Other      0.4
                                                                                0.4

                                                                                              Remuneration of digitalisation investments,
                                                                                                   confirming our expectations.
                         Regulated
                                      2.2
                                                                                2.1

                                                                                                        New incentive scheme
                                     2019E      Regulated Mg      Others       2022
                RAB, €bn             11.6                                       11.2

                                                    New regulatory framework draft in line with expectations

                                                                                                                                            29
2020-22 Strategic Plan

                               Ecosystems and Platforms
                               Endesa X

                                                             Net Capex 2019E-22                                               Gross margin, €bn

                                                                                                                                            ~0.2

                                                                                                                                            ~20%
                                                             36%

                                                                       0.2 €bn                                                ~0.1
                                                                                 64%                                          ~10%
                                                                                                                                            ~80%

                                                                                                                              ~90%

                                                                                                                                1             2
                                                                                                                              2019E          2022

                                                                                       New business(1)   Mature business(2)

                                                          Leveraging existing businesses to support growth in e-Mobility and e-City
                         (1)   New business: e-city, e-mobility and e-finance
                         (2)   Mature business: e-home and e-industry                                                                               30
2020-22 Strategic Plan

                         Efficiency through digitalisation

                               2019E-22 Digitalisation Net Capex                                   Key highlights

                                                                                      Networks: ~1.1 €bn for digitalisation
                                                                                            Quality Plan & remote control
                                                                                            DigI&N and Digital Hub
                                                       3%

                                                        11%
                                                                                      Renewables: Advanced automation of construction
                                           1.3 €bn       5%
                                                                                      and O&M
                                     81%
                                                                                            Wind & Solar maintenance

                                                                                      Thermal Gx: Increased flexibility and automation
                                                                                            Drones & augmented reality with Smart Glasses

                             Generation    Networks     Retail     Endesa X
                                                                                      Customers: Process automation and increased
                                                                                      offering
                                  2022 EBITDA contribution: ~150 €mn                        B2B and B2C CRM
                                                                                            Channels and internal process digitalisation

                                                Digitalisation contributes with 25% to EBITDA growth

                                                                                                                                             31
2020-22 Strategic Plan

                         Efficiency through digitalisation
                         Unitary KPIs of the Efficiency Plan per area

                                                     Opex(1) evolution, €bn

                                                                                    -5%

                                                                                                                                             2014   2019E   2022   Var. 2019E-22

                                                                                                                        Unitary cost   (2)
                                                                                                                                              51     45      45          -
                                                                                        0.1                             k€/MW
                                                                     0.1                             (0.3)
                                2.4                                                                                     Unitary cost
                                                                                                                                              59     43      39        -9%
                                                                                                                        €/end user
                                                   2.0                                                            (3)
                                                                                                                1.9     Cost to Serve
                                                                                                                                              13     11      9         -18%
                                                                                                                        €/customer

                               2014             2019E                CPI             Growth        Efficiency   2022

                               44%               35%                 Opex(1)/ Gross margin                      30%

                                                           Efficiency more than compensate the increase of inflation and growth
                         (1)   Opex: Total fixed costs in nominal terms (net of capitalizations)
                         (2)   Thermal and renewable costs combined. Includes Corporate fees
                         (3)   Not including non-recurrent expenses                                                                                                           32
Endesa 2020-22
Strategic Plan Update

Key Financial Indicators

                           Strategic plan at a glance
                           €bn

                                   Cumulated net capex vs previous plan                                                                                                                  EBITDA

                                                                   +20%
                                                                                                                                                                          6

                                              10
                                                                                                                                                                          5
                                                                                                                                                                                         +16%
                                               9

                                               8
                                                                                                                                                                          4

                                               7

                                                                                                      +1.3 €bn                                                                                           +0.6 €bn
                                               6
                                                                                                                                                                          3

                                               5

                                               4

                                                                               7.7                                                                                        2

                                                                                                                                                                                  3.7             4.3
                                               3

                                               2
                                                       6.4
                                                                                                                                                                          1

                                               1

                                               0
                                                                                                                                                                          0

                                                     2018-21                2019E-22                                                                                             2019E            2022

                                                    Net Ordinary Income(1)                                                                                                               Net Debt

                                               3
                                                                                                                                                                                         +20%
                                                                 +27%
                                                                                                                                                                         10

                                              2.5

                                                                                                                                                                          8

                                               2

                                                                                                                                                                          6

                                                                                                      +0.4 €bn
                                              1.5

                                                                                                                                                                                  7.1             8.5
                                                                               1.9
                                                                                                                                                                          4

                                               1

                                              0.5
                                                       1.5                                                                                                                2

                                               0                                                                                                                          0

                                                      2019E                    2022                                                                                              2019E            2022

                           (1)   Reported Net Income – Net Result on Disposals of Non-Financial Assets (over 10€M) - Net Results on Impairment of Non-Financial Assets (over 10 €M)
                                                                                                                                                                                                                    34
Key Financial Indicators

                           Profitability and credit metrics

                                                    Profitability                        Return on invested capital                      Credit metrics

                                                                                                     +90 bps                              +300 bps
                                                     +400 bps
                                   0.5 0

                                                                                                                       40. 0%

                                                                                14. 0%

                                   0.4 5

                                                                                                                       35. 0%

                                   0.4 0

                                                                     44%        12. 0%                                                               37%
                                   0.3 5
                                              40%                                                              12.1%   30. 0%
                                                                                                                                   34%
                                   0.3 0
                                                                                10. 0%

                                                                                            11.2%                      25. 0%

                                                                                 8.0 %

                                   0.2 5

                                                                                                                       20. 0%

                                   0.2 0
                                                                                 6.0 %

                                                                                                                       15. 0%

                                   0.1 5
                                                                                                                                          1.9x              2x
                                                                                 4.0 %

                                                                                                                       10. 0%

                                   0.1 0

                                                                                 2.0 %

                                   0.0 5                                                                                5.0 %

                                     -
                                                                                 0.0 %

                                                                                                                        0.0 %

                                             2019E (1)               2022                    2019E (1)         2022               2019E              2022

                                                    Net Income/EBITDA                                    ROIC                   FFO/Net Debt         Net debt/EBITDA

                                                                            Focus on profitability and value creation

                           (1)   Calculated on Net Ordinary Income
                                                                                                                                                                       35
Key Financial Indicators

                           Key Financial Indicators
                           EBITDA analysis
                                                         EBITDA by business, €bn                                                                                                   EBITDA per year, €bn

                                                                                  +16%
                                                                                                                                                                                                                        (1)
                                                                                                                                                                                                                  4.3
                                                                                                                              (1)                                                                          4.1
                                                                                        -0.1                             4.3                                                             3.9
                                                                        0.3                             -0.1                                                     3.7
                                        3.7             0.4
                                                                                                                                                                                                           1.4    1.5
                                                                                                                         1.5                                     1.1                     1.3
                                        1.1
                                                      • Higher renewable contribution
                                                                                                                                                                 0.2                     0.3               0.4    0.5
                                        0.2           • Reference prices increase                                        0.5                                     0.3                     0.3
                                        0.3                                                                                                                                                                0.3    0.2
                                                                                                                         0.2
                                                      • Sales growth
                                                      • Efficiencies
                                        2.1                                                                                                                      2.1                     2.0               2.0    2.0
                                                      • Regulatory revision                                              2.0

                                       2019E                                                                            2022                                   2019E                     2020              2021   2022

                                                   Electrification & Decarbonisation
                                                                                                  Networks                          Non-mainland                 EGPE                        Gx & Sx (2)

                                                                    EBITDA growth driven by liberalized business and renewables
                           (1)   Rounded figures
                           (2)   Gx & Sx EBITDA figure includes Generation and Supply business, Corporate Structure, Services and Adjustments and does not include Non-mainland generation                                    36
Key Financial Indicators

                           Key Financial Indicators
                           Net ordinary income evolution

                                                                     Net Ordinary Income, €bn

                                                    +27%

                                                                     1.9
                                                           1.8                                               ~-0.2        1.9
                                              1.7
                                                                                      1.5         +0.6
                                 1.5

                               2019E         2020          2021     2022            2019E       EBITDA   D&A, financial   2022
                                                                                                           & others

                                                      27% increase in Net Ordinary Income vs. 16% in EBITDA

                                                                                                                                 37
Key Financial Indicators

                                 Key Financial Indicators
                                 Debt analysis

                                                        Gross debt, €bn                                                              Source of funds allocation 2020-22, €bn

                                                                                        8.8                                    9.5
                                                     7.4                                0.3
                                                     0.3

                                                                                        8.5
                                                      7.1                                                                                          3.7
                                                                                                                                        (5.8)

                                                                                                                                                                                  (1.4)
                                                 2019E                                2022
                                              Net Debt                     Cash & Equivalents                                                              (4.7)       (0.4)
                           Cost of debt                                                                                        FFO      Capex(1)   FCF    Dividends   IFRS 16   Chg. Net
                                                 1.8%                                   2.1%                                                                          &Others    Debt
                           (%)

                                                                                                                  Increase in net debt to boost growth
                                 (1)   Net Capex = Gross Capex - assets from clients’ contributions – subsidies
                                                                                                                                                                                           38
Key Financial Indicators

                           Sustainable finance
                           Key financing with sustainability instruments

                                                                  New green loans linked to renewable
                             Sustainable debt 2019E, %                                                     Path to 100% Sustainable Debt
                                                                        investments: 635 €mn

                                          10%                                        March, 2019           Debt increase by 1.4 €bn will rise the
                                                                                                           sustainable finance ratio
                                                                           EIB first Green Loan, 335 €mn

                                     €7.1bn                                           15 years
                                     net debt                                                              Sustainable criteria across all financial
                                                                                                           tools will be pursued

                                                                                     May, 2019
                                                                                                           Promoting sustainability criteria among
                                                                           ICO first Green Loan, 300 €mn
                                                                                                           financial counterparties
                                                                                      12 years

                                   Sustainable finance plays a key role in promoting sustainable development over the long term
                                                                                                                                                       39
Endesa 2020-22
Strategic Plan Update

Closing Remarks
Closing Remarks
Financial Targets

                                                                                                                                                                        CAGR
                                                               2019E                               2020                              2021                      2022
                                                                                                                                                                       2019E-22
 EBITDA
                                                                 ~ 3.7                             ~ 3.9                             ~ 4.1                     ~ 4.3     +5%
 (€bn)

 Net Ordinary Income (1)
                                                                 ~ 1.5                             ~ 1.7                             ~ 1.8                     ~ 1.9     +8%
 (€bn)

 Pay out(2)
                                                                100%                              100%                                80%                      70%
 (%)

 Implicit DPS
                                                                 ~1.4                               ~1.6                              ~1.4                     ~1.3
 (€/share)

                                                                                                                                                                       S 2019E-22
 Net Capex
                                                                   1.9                               1.6                               2.0                     2.2        7.7
 (€bn)

 (1)   Reported Net Income – Net Result on Disposals of Non-Financial Assets (over 10 €mn) - Net Results on Impairment of Non-Financial Assets (over 10 €mn)
 (2)   70% pay out long term perspective
                                                                                                                                                                                    41
Closing Remarks

                     First-class integrated player in Iberia

                      Outstanding delivery track record

        Decarbonisation and electrification driving ample opportunities

                  Strategy aimed at sustainable growth path

                 Long term value creation for all stakeholders

                                                                          42
Endesa 2020-22
Strategic Plan Update

Appendix
Key Financial Indicators
   Commodity overview and update to latest market consensus

                            Brent price,
                            Brent price,$/bbl
                                         $/bbl                        CO2 price, €/ton
2020-22 plan
2019-21 plan
                           67.5                                23.5   23.5       24.0    24.5
                69.0
                                       65.0        66.0
                68.0       65.0         63.5                          17.5       18.0
                                                              16.0

               2019E       2020        2021      2022         2019E   2020       2021    2022

                            Coal API2, $/ton                            PVB, €/MWh

                77.0        75.0        76.0      78.0         21.4   20.6       20.8    20.9

                 73.0      75.0         74.0                   20.6   20.5
                                                                                 20.0
               2019E       2020        2021      2022         2019E   2020       2021    2022

                                                                                                44
Key Financial Indicators
   Power market overview and update to latest market consensus

                                          Mainland Spain demand(1), TWh         Average daily market price(2), €/MWh
2019-22 plan
2018-21 plan
                                                              266
                                                   263                        56.5        55.0       55.4
                                       259
                                                            256       258
                                                 253                                       53.2      53.5       53.3
                                    250                                       50.2

                                   2019E        2020       2021       2022   2019E        2020      2021        2022

                                              Spain GDP growth, %                         Thermal gap, TWh

                                   2.3%                                              63
                                                2.0%
                                   2.2%                                        52            39         40
                                                           1.8%
                                                2.0%                  1.5%
                                                         1.7%                               34         33         31
                                   2019E        2020        2021      2022    2019E        2020       2021        2022

   (1)   In bus bars
   (2)   Arithmetic power prices                                                                                         45
Key Financial Indicators
Net(1) Capex analysis

                                                            Net Capex, €bn

                                                                                    2.2
                                                     1.9                     2.0

                                                             1.6
                 Renewables(2)                                                      1.4
                                                     0.8                     1.0
                                                             0.6

                    Networks                         0.5
                                                             0.5             0.5
                                                                                    0.5
                        Gx(3)                        0.4     0.4             0.4     0.2
                      Supply                         0.2     0.1             0.1     0.1
                                                    2019E   2020             2021   2022

(1)   Exclude client contributions
(2)   Renewables capex includes Hydro investments
(3)   Includes Net Capex in non mainland                                                   46
Key Financial Indicators
   Gross(1) Capex analysis

                                               Gross Capex(2), €bn                                                                    Gross Capex by nature, €bn

                                                                                                                 2.4                                     8.4
                             2.1                                                     2.1                                                    7.1
                                                         1.8
Renewables(3)                                                                                                                                            4.9
                             0.8                                                     1.0                          1.4          Asset
                                                         0.6                                                                development      3.3

 Networks
                             0.6                         0.7                         0.7                                      Asset
                                                                                                                  0.7                        2.4         2.3
                                                                                                                            management
     Gx(4)
                             0.4                         0.4                         0.4                         0.2                         1.4
   Supply                    0.2                         0.1                         0.1                         0.1        Customer (5)                 1.2
                           2019E                        2020                        2021                        2022                       2018-21    2019E-22

   (1)   Includes client contributions
   (2)   Rounded figures
   (3)   Renewables capex includes Hydro investments
   (4)   Includes Net Capex in non mainland
                                                                                                                                                                   47
   (5)   Customer capex includes Cost to Acquire new customers, Connections and Investments associated with new services.
Key Financial Indicators
Comparison of old plan vs. updated plan

                                                            EBITDA, €bn

                              + OTC references                                     + Supply margin
                              + Supply margin                                      + Higher renewables
                              + Fixed costs                                        + Fixed costs
                              - Thermal generation                                 - Non mainland margin
                              - Non mainland margin                                - OTC references & lower thermal Gx
                                                                                                                         4.3
                                                      3.9                 4.0            4.1
                     3.7            3.8
       3.7

             2019E                          2020                                2021                                     2022

                                          Plan 2019-21              Plan 2020-22

                                                                                                                                48
Endesa 2020-22
Strategic Plan Update

Environmental, Social and Governance
annexes
Endesa 2020-22
Strategic Plan Update

Sustainability Plan
Sustainability Plan

                      Sustainable business model driving change through
                      innovation           2020-22 Sustainability Plan

                        Endesa public committment to the United Nations
Endesa 2020-22
Strategic Plan Update

Focus on People Centricity

                             Engaging people we work with

                                                                       Plan actions                                                           2019E                                             2020-22 targets

                                                                                                                          • 8,566 people involved
                                                 Open Feedback Evaluation                                                                                                          • 100% of people involved
                                                                                                                          • 100% of eligible people

                                                                                                                       • 100% of people involved                                   • 100% of people involved
                                                 Climate      survey(1)
                                                                                                                       • 83% of people participating                               • 87% of people participating

                                                 Gender - % of women in selection                                         29% women involved                                       45% women involved in
                                                 processes(2)                                                             in recruiting processes                                  recruiting processes

                                                 Promotion of digital skills’ dissemination                               40% of people involved in digital                        100% of people involved in digital
                                                 among all employees                                                      skills training3                                         skills training(3)

                              1. Eligible and reachable people having worked in the Group for at least 3 months / 2. It excludes the selection processes involving the blue collars / 3. % accumulated with the training given since 2018   53
Focus on People Centricity

                             Engaging local communities

                                                       Plan actions                         2019E(1)             2020-22 targets

                                    High-quality, inclusive and fair education   0.17 mn beneficiaries   0.7 mn beneficiaries in 20301

                                    Access to affordable and clean energy        1.6 mn beneficiaries    4.8 mn beneficiaries in 20301

                                    Employment and sustainable                                           1.7 mn beneficiaries in 20301
                                                                                 0.5 mn beneficiaries
                                    and inclusive economic growth

                                   1.   Cumulated figures since 2015

                                                                                                                                         54
Endesa 2020-22
Strategic Plan Update

Focus on Corporate Governance

                                  Corporate governance structure

                                             Composition                                        BoD and Commitees

                                                                                                                              Audit firm
                                                                                                Shareholder’s meeting

                                   36%        BoD’s         55%
                                            composition
                                                                                                 Board of Directors
                                                                                                   (11 members)

                                             9%

                                Executive    Proprietary   Independent

                                                                         Audit and Compliance                              Appointments and
                                                                               Committee                                remuneration Committee

                                                                                                                                                 56
Focus on Corporate Governance

                                Board of Directors composition

                                                      Board of Directors                                 Board of Directors’ diversity

                                                                     Chairman
                                  J. Sánchez-Calero
                                                                         .

                                  J. Bogas                               CEO
                                                                                                 By gender                           By tenure

                                  P. Grieco                      Proprietary Director

                                  F. Starace                       Vice Chairman                 18%                                18%
                                                                                                                                                  27%
                                                               Audit & Compliance C.
                                  A. de Paoli
                                                           Appointments & Remuneration C.

                                  A. Cammisecra                  Proprietary Director

                                                               Audit & Compliance C.
                                  M. Roca
                                                           Appointments & Remuneration C.
                                                                                                         82%
                                                               Audit & Compliance C.                                                  55%
                                  A. Echevarría
                                                           Appointments & Remuneration C.
                                                               Audit & Compliance C.              Male   Female         1-3 years     4-6 years     Over 6 years
                                  H. Revoredo
                                                           Appointments & Remuneration C.
                                                               Audit & Compliance C.
                                  I. Garralda
                                                           Appointments & Remuneration C.
                                                               Audit & Compliance C.
                                  F. de Lacerda
                                                           Appointments & Remuneration C.

                                     Proprietary             Executive             Independent
                                                                                                                                                            57
Focus on Corporate Governance

                                      Short-term variable remuneration(1)
                                                                                      2019 Objective                Type of target   Macro objective
                                                                                                Range      Weight

                                           Net ordinary income                              Maximum 120%   25%         Economic         Profitability

                                                                                                                                       Cash and debt
                                                       FFO                                  Maximum 120%   15%         Financial
                                                                                                                                       management

                                                  Fixed costs                               Maximum 120%   20%         Economic          Efficiency

                                              Decarbonisation                               Maximum 120%   20%         Business        Environmental

                                         Safety in the workplace                            Maximum 120%   20%           ESG              Safety

                                (1)   2019 executive director variable remuneration
                                                                                                                                                        58
Focus on Corporate Governance

                                      Long-term variable remuneration(1)
                                                                                                  Objective
                                                                                                  Objective                                                                                         Type of
                                                                                                                                                                                                   Type  of target
                                                                                                                                                                                                            target

                                                                           Entry (50%)               Target (100%)               Over I (150%)              Over II (180%)

                                                                          Endesa’s TSR               Endesa’s TSR                Endesa’s TSR
                                                                                                                                                            Endesa’s TSR
                                                                           from 90 % to              from 100 % to               from 110 % to
                                         TSR(2)                                                                                                              > 115% of                                      Market                                  Performance
                                                                              100% of                   110% of                     115% of
                                                                                                                                                                TSR
                                                                               TSR                        TSR                         TSR
                                                       50%(3)

                                      ROACE(4)                                -3% Target                   Target                 +1.5% Target                +3% Target                                   Financial                                 Profitability

                                                       40%(3)

                                   CO2 emissions
                                  reduction (gCO2                             +3% Target                   Target                  -3% Target
Endesa 2020-22
Strategic Plan Update

Focus on Innovation & Cybersecurity

                                      Innovation & Cyber security

                                                             Innovation                                                  Cibersecurity

                                          Plan actions                    2020-22 targets                Plan actions                    2020-22 targets

                                                                                                  Coverage of web
                                                                   1000 people involved in                                        100% of internet web
                                                                                                  applications exposed
                                                                   promotional innovation                                         applications protected
                                                                                                  to internet with
                                                                   actions (workshops,                                            through advanced
                                                                                                  advanced cyber
                                                                   trainings,                                                     cyber security
                                                                                                  security application
                                                                   intrapreneurship)                                              solutions
                                                                                                  solutions
                                      Promoting innovation
                                      culture
                                                                                                  Disseminating the
                                                                                                  information security            15 cyber security
                                                                   5 innovation events per year   culture and changing            knowledge sharing
                                                                                                  people’s behavior in order      events per year
                                                                                                  to reduce risks

                                                                                                                                                           61
Glossary of terms (I/II)

                    Item                                                                           Definition

 Average cost of debt (%)                 Cost of gross financial debt / gross average financial debt

 Average life of debt (number of years)   (Principal x number of days of term) / (Principal in force at the end of the period x number of days of the period)

 Cash flow from operations (€mn)          Net cash provided by operating activities

 Debt maturities coverage (months)        Maturity period (months) for vegetative debt that could be covered with the liquidity available

                                          Revenues – Purchases and Services + Work performed by the entity and capitalized – Personnel expenses – Other fixed
 EBITDA (€mn)
                                          operating expenses

 EBIT (€mn)                               EBITDA - Depreciation and amortization

 Fixed costs (Opex) (€mn)                 Personnel expenses + Other fixed operating expenses - Work performed by the entity and capitalized

 Gross margin (€mn)                       Revenues – Purchases and Services

 Leverage (times)                         Net financial debt / EBITDA

 Net Capex (€mn)                          Gross tangible and intangible Capex - assets from clients’ contributions and subsidies
                                          The higher profit before tax and non-controlling interests net of depreciation and amortisation and other adjustments +
 Funds from Operations (FFO, €mn)
                                          Change in Net Working Capital + Variation in the payment of the Income Tax

                                                                                                                                                                    62
Glossary of terms (II/II)

                    Item                                                                               Definition
 Net financial debt (€mn)                     Long and short term financial debt - Cash and cash equivalents – Derivatives recognized as financial assets

 Net financial results (€mn)                  Financial Revenues - Financial Expenses - Foreign Exchanges

 Revenues (€mn)                               Sales + Other operating revenues

 Electric Integrated Margin (€mn)             Contribution margin Gx+Sx - Margin SENP - Margin SCVP - Margin gas - Margin Endesa X - Others

 Unitary electric integrated margin (€/MWh)   Electric Integrated Margin / Electric sales in the liberalized market in Spain and Portugal

 Gas retail unitary margin (€/MWh)            Gas margin from retail sales / Gas Retail sales

 Endesa X Gross Margin (€mn)                  Gross margin generated by the added value products and services commercialized by the Endesa X unit

                                                                                                                                                            63
Disclaimer

This document contains certain "forward-looking" statements regarding anticipated financial and operating results and statistics and other future events. These statements are not guarantees of future performance and they are subject to material risks,
uncertainties, changes and other factors that may be beyond ENDESA’s control or may be difficult to predict.
Forward-looking statements include, but are not limited to, information regarding: estimated future earnings; anticipated increases in generation and market share; management strategy and goals; estimated cost reductions; tariffs and pricing structure;
estimated capital expenditures and other investments; estimated increases in capacity and output and changes in capacity mix; repowering of capacity and macroeconomic conditions. The main assumptions on which these expectations and targets are
based are related to the regulatory setting, exchange rates, increases in production and installed capacity in markets where ENDESA operates, increases in demand in these markets, assigning of production amongst different technologies, and the
availability and cost of the gas, coal, fuel oil and emission rights necessary to run our business at the desired levels.
In these statements we avail ourselves of the protection provided by the Private Securities Litigation Reform Act of 1995 of the United States of America with respect to forward-looking statements.
The following important factors, in addition to those discussed elsewhere in this document, could cause actual financial and operating results and statistics to differ materially from those expressed in our forward-looking statements:
Economic and industry conditions: significant adverse changes in the conditions of the industry, the general economy or our markets; the effect of the prevailing regulations or changes in them; tariff reductions; the impact of interest rate fluctuations; the
impact of exchange rate fluctuations; the impact of energy commodities price fluctuations; natural disasters; the impact of more restrictive environmental regulations and the environmental risks inherent to our activity; potential liabilities relating to our
nuclear facilities.
Transaction or commercial factors: any delays in or failure to obtain necessary regulatory, antitrust and other approvals for our proposed acquisitions or asset disposals, or any conditions imposed in connection with such approvals; our ability to integrate
acquired businesses successfully; the challenges inherent in diverting management's focus and resources from other strategic opportunities and from operational matters during the process of integrating acquired businesses; the outcome of any
negotiations with partners and governments. Delays in or impossibility of obtaining the pertinent permits and rezoning orders in relation to real estate assets. Delays in or impossibility of obtaining regulatory authorisation, including that related to the
environment, for the construction of new facilities, repowering or improvement of existing facilities or its closure or decommissioning; shortage of or changes in the price of equipment, material or labour; opposition of political or ethnic groups; adverse
changes of a political or regulatory nature in the countries where we or our companies operate; adverse weather conditions, natural disasters, accidents or other unforeseen events, defaults quantifiable of monetary obligations by the counterparties to
which the Company has effectively granted net credit and the impossibility of obtaining financing at what we consider satisfactory interest rates.
Regulatory, environmental and political/governmental factors: political conditions in Spain and Europe generally; changes in Spanish, European and foreign laws, regulations and taxes.
Operating factors: technical problems; changes in operating conditions and costs; capacity to execute cost-reduction plans; capacity to maintain a stable supply of coal, fuel and gas; acquisitions or restructuring; capacity to successfully execute a strategy
of internationalisation and diversification.
Competitive factors: the actions of competitors; changes in competition and pricing environments; the entry of new competitors in our markets.
Further details on the factors that may cause actual results and other developments to differ significantly from the expectations implied or explicitly contained in this document are given in the Risk Factors section of the current ENDESA regulated
information filed with the Comisión Nacional del Mercado de Valores (the Spanish securities regulator or the “CNMV” for its initials in Spanish).
No assurance can be given that the forward-looking statements in this document will be realised. Except as may be required by applicable law, neither Endesa nor any of its affiliates intends to update these forward-looking statements.
This presentation does not constitute a recommendation regarding the securities of Endesa, S.A.. This presentation does not contain an offer to sell or a solicitation of any offer to buy any securities issued by Endesa, S.A. or any of its subsidiaries or
affiliates.

                                                                                                                                                                                                                                                                64
IR Team
Contact us

                              Contacts

                              Email: ir@endesa.es
 Mar Martinez
                              Phone: + 34 91 213 15 03
 Head of Investor Relations
                                     + 34 91 213 90 49
 Investor Relations team
                              Website: www.endesa.com
 Isabel Permuy
 Javier Hernandez
 Francesc Trilla
 Juan Carlos Jimenez
 Sonia Herranz
 Paloma de Miguel

                                                         65
You can also read