Energetic and health effects of protein overconsumption constrain dietary adaptation in an apex predator
←
→
Page content transcription
If your browser does not render page correctly, please read the page content below
www.nature.com/scientificreports
OPEN Energetic and health effects
of protein overconsumption
constrain dietary adaptation
in an apex predator
Karyn D. Rode1*, Charles T. Robbins2, Craig A. Stricker3, Brian D. Taras4 & Troy N. Tollefson5
Studies of predator feeding ecology commonly focus on energy intake. However, captive predators
have been documented to selectively feed to optimize macronutrient intake. As many apex predators
experience environmental changes that affect prey availability, limitations on selective feeding can
affect energetics and health. We estimated the protein:fat ratio of diets consumed by wild polar
bears using a novel isotope-based approach, measured protein:fat ratios selected by zoo polar bears
offered dietary choice and examined potential energetic and health consequences of overconsuming
protein. Dietary protein levels selected by wild and zoo polar bears were low and similar to selection
observed in omnivorous brown bears, which reduced energy intake requirements by 70% compared
with lean meat diets. Higher-protein diets fed to zoo polar bears during normal care were concurrent
with high rates of mortality from kidney disease and liver cancer. Our results suggest that polar bears
have low protein requirements and that limitations on selective consumption of marine mammal
blubber consequent to climate change could meaningfully increase their energetic costs. Although
bear protein requirements appear lower than those of other carnivores, the energetic and health
consequences of protein overconsumption identified in this study have the potential to affect a wide
range of taxa.
Understanding the physiological limitations of a species is critical to determining potential adaptation to envi-
ronmental change1. Although responses to environmental change are often predicted based on currently observed
relationships between a species and its environment and the existing range of behaviors, the ability to respond
to environmental change is ultimately a function of physiological constraints that may or may not be apparent
under current conditions1,2. Nutrition is an important component of physiology that, like other physiological
limitations associated with metabolism, affects wildlife behavior and ultimately population dynamics via repro-
duction and s urvival3,4.
Evolutionary history plays an important role in determining constraints on nutritional e cology5. For exam-
ple, felids which diverged from other species within the order Carnivora differ in requirements for amino acids,
fatty acids, and vitamins as a result of their evolution to consume a high-protein, meat-only d iet5. Similarly, the
ability to extract nutrients from fibrous plants depends on the evolution of gut morphology and microflora that
improve digestive e fficiency6. When food resources available to a species are altered, their ability to withstand
environmental change is a function of the degree to which altered diets can continue to meet energetic and
nutritional needs7. Understanding a species’ nutritional physiology in light of their evolutionary history has
important implications both for free-ranging populations and those in managed care8.
Ursids are among the least specialized carnivores. The family includes herbivorous giant pandas (Ailuropoda
melanoleuca), six omnivorous species [e.g., brown bears (Ursus arctos), American black bears (U. americanus),
sun bears (Helarctos malayanus)], and the carnivorous polar bear (U. maritimus). Their more generalized diets
allow them to utilize diverse food resources from tropical forests to the Arctic sea ice. Recent studies indicate that
despite diverse diets, bears optimize protein levels to simultaneously meet minimal requirements while avoid-
ing the increased energetic costs associated with metabolizing protein consumed at levels above physiological
1
U.S. Geological Survey, Alaska Science Center, 4210 University Drive, Anchorage, AK 99508, USA. 2School
of the Environment and School of Biological Sciences, Washington State University, Pullman, WA 99164,
USA. 3U.S. Geological Survey, Fort Collins Science Center, Fort Collins, CO 80526, USA. 4Division of Wildlife
Conservation, Alaska Department of Fish and Game, Fairbanks, AK 99701, USA. 5Mazuri Exotic Animal Nutrition,
Land O’Lakes, Inc., St. Louis, MO 63166, USA. *email: krode@usgs.gov
Scientific Reports | (2021) 11:15309 | https://doi.org/10.1038/s41598-021-94917-8 1
Vol.:(0123456789)www.nature.com/scientificreports/
requirements into urea to excrete excess n itrogen9–11. For example, coastal Alaskan brown bears congregate at
streams where they have access to easily caught and abundant spawning salmon, yet, bears leave streams to
spend 6–10 h/day, or ~ 50–90% of their foraging effort, eating small, dispersed, carbohydrate-rich b erries10. By
consuming both salmon and berries, brown bears optimize the protein:energy ratio such that it increases the rate
of body mass gained by 72% compared to salmon-only d iets10. Giant pandas are strict herbivores that increase
dietary protein content by selectively consuming plant parts, but it is unclear whether dietary protein levels are
similar to or exceed the lower levels consumed by other ursids12,13. Polar bears are strictly carnivorous on the
sea ice, but they appear to preferentially consume the blubber of lipid-rich marine mammal prey which would
reduce their protein intake below that of typical strict carnivores while maximizing energy i ntake14. Thus, among
ursids maintaining lower levels of protein intake appears to play an important role in diet selection and nutrition.
Polar bears occupy a unique niche in the animal kingdom as the only species in the world that inhabits the
Arctic sea ice and extracts their nutrition from marine mammals that live beneath the ice surface. Although they
are the most carnivorous ursid, they evolved from omnivorous brown bears 150,000–600,000 years ago15. Studies
of polar bear feeding ecology have focused on whether or not a bear has fed recently or the prey composition
of the diet, and rarely, on the dietary nutritional composition. This narrow view of feeding ecology is common
in studies of marine apex predators and other c arnivores16,17. The assumption that carnivores “forage for prey”
rather than in response to more specific nutritional requirements has recently been questioned16,18.
Global-warming induced sea ice loss in the Arctic is changing polar bear access to prey and prey
composition19,20. Even during seasons when sea ice is not limiting, polar bears in some areas have experienced
substantial declines in access to prey. For example, in the northern and southern Beaufort Sea subpopulations,
the proportion of adult females that had not fed while on the sea ice in the past 7–10 days in March and April
increased from 13 to 33% and 30 to 42%, respectively for the two subpopulations, between 1983 and 201620.
Declines in predation success reduce the opportunity to preferentially consume high fat blubber. Similarly,
polar bears are increasingly using terrestrial habitats where available foods are carbohydrate-based and higher
in protein, such as plants, lean meat, and bird e ggs21.
An important factor that will affect the ability of polar bears to adapt to reduced availability of their marine
mammal prey is whether they have retained the need to consume a relatively low protein diet similar to other
ursids or evolved sufficiently towards strict carnivory that increased consumption of protein will not increase
their energetic needs or affect long term health. We hypothesized that polar bears have retained the physiological
niche of omnivorous brown bears and therefore consume lower protein diets to avoid the increased energetic
costs associated with excretion of nitrogen when protein is consumed above physiological requirements9–11. If
true, increased consumption of high protein diets would have important consequences for polar bear energet-
ics and further support the implications of upper limits on protein consumption in carnivores. To address this
hypothesis, we (a) estimated the dietary protein and fat content of diets consumed by wild polar bears in the
Chukchi Sea subpopulation where prey is not currently limiting21,22, (b) measured the protein to fat dietary
content selected by zoo polar bears that have never had access to high-fat marine prey to determine if protein:fat
selection is genetically and physiologically based, and (c) evaluated the potential health consequences (e.g.,
energetic costs, diseases and lifespan) of consuming high protein diets that might affect wild polar bears when
prey availability is reduced and be important in diet formulation for polar bears in managed care.
Results
Macronutrient: proportions consumed by wild and zoo polar bears. Polar bears in the Chukchi
Sea subpopulation, where prey is not currently limiting, consumed diets consisting of 66–74% marine mammal
blubber with little variation across sex and age classes (n = 229 adult and subadult bears) (Table 1). Fat content
of blubber ranged from 85.4 to 95.0% across prey species (n = 18), whereas the fat content of muscle ranged
from 7.9 to 9.3%23. The fat proportions in the diets of male and female polar bears in the Chukchi Sea from 2008
to 2017 averaged 67 ± 4% (± stdev across age classes of males) and 70 ± 1% (female) of dry matter, respectively
(Table 2). Because fats are more energy dense than proteins, the metabolizable energy contents of male diets
were 81 ± 3% fat and 19 ± 3% protein and female diets 83 ± 1% fat and 17 ± 0% protein (Table 2).
Diets fed to polar bears in North American zoos (n = 10) during normal care contained 36 ± 16% fish on a
fresh weight basis, 33 ± 15% raw meat and commercially prepared meat and fat mixtures, 12 ± 12% extruded dry
pellets, 16 ± 21% fruits and vegetables, and 6 ± 6% oils and fats. Because the diets are predominantly low-fat fish
and meat products, they average 37 ± 12% fat (range 22–67%), 51 ± 8% protein (range 29–62%), and 12 ± 5%
digestible carbohydrate (range 4–25%) on a dry matter basis. This corresponded to diets of 55 ± 12% fat (range
36–82%), 37 ± 8% protein (range 16–47%), and 8 ± 5% carbohydrate (range 2–20%) on a metabolizable energy
basis.
Zoo polar bears given ad libitum access to fat and protein selected diets containing 60 ± 9% fat and 40 ± 9%
protein on a dry matter basis and 76 ± 7% fat and 24 ± 7% protein on a metabolizable energy basis (Table 2). The
proportion of fat selected by zoo bears was 8% less as a percent of dry matter (F1,14 = 4.9, p = 0.04) and 7% less
as a percent of metabolizable energy (F1,14 = 5.8, p = 0.03) than that consumed by wild polar bears. Percent of fat
consumed did not exhibit a trend during the 14-day trials (t = − 1.8, p = 0.09). Male and female polar bears used
in the study averaged 481 ± 29 kg (n = 5) and 301 ± 53 kg (n = 4), respectively, all of which were adults.
Relating the mass gain of the zoo polar bears during ad libitum selection trials to digestible energy intake
(Fig. 1) allowed comparison of the metabolic efficiency of the diet selected by zoo polar bears with efficiency of
mass gain in brown bears fed a range of protein levels in previous studies. Although the digestible energy intake
of the zoo polar bears at 0 mass gain (214 kcal/kg0.75/day) was approximately double that of brown bears (Fig. 2),
their efficiency of mass gain (0.11 g/kg digestible energy intake) was identical to that for brown bears at the same
dietary protein content (relationship between brown bear dietary protein content as percent of dry matter (x) and
Scientific Reports | (2021) 11:15309 | https://doi.org/10.1038/s41598-021-94917-8 2
Vol:.(1234567890)www.nature.com/scientificreports/
Prey species Adult females Adult males Young adult females Young adult males Subadult females Subadult males Fat content
N 53 52 34 47 16 27
Bearded seal blubber 26 (15) 21 (11) 27 (16) 24 (13) 22 (16) 25 (17) 93.8
Ringed seal and Beluga whale blubber 23 (11) 22 (8) 21 (11 22 (10) 32 (14) 20 (11) 95.0
Ringed seal and Bearded seal pup muscle 23 (5) 30 (5) 22 (5) 24 (5) 25 (6) 20 (6) 8.0a
Walrus non-calf blubber 9 (9) 8 (7) 11 (12) 9 (9) 7 (8) 12 (14) 93.5
Bearded seal, Ringed seal, and Beluga muscle 5 (3) 5 (3) 5 (3) 6 (3) 3 (2) 6 (4) 8.3a
Walrus calf blubber 5 (6) 6 (5) 5 (7) 6 (6) 4 (5) 8 (10) 79.0
Bowhead whale blubber 6 (7) 5 (4) 5 (6) 5 (6) 6 (1) 5 (6) 93.4
Gray whale blubber 4 (4) 4 (3) 4 (5) 4 (5) 2 (3) 5 (7) 85.4
Total blubber 73 (6) 66 (5) 73 (7) 70 (6) 73 (6) 74 (7)
Table 1. Mean percentage (standard deviation) contributions of prey muscle and blubber to the diets of male
and female polar bears in the Chukchi Sea based on a bulk isotope model using carbon and nitrogen isotopes
in polar bear hair and prey muscle and blubber tissues. Dietary percentages for prey tissues that could not be
differentiated in the model due to overlap in their isotopic signatures were combined. Sample sizes (n) for each
sex and age class are provided in the second row. Adult bears are age > 10 years, young adults are age 5–10,
and subadults are independent bears age 2–4. a Data from Yurkowski et al.23. For combined prey muscle we
assumed seal contributed more than beluga whale and therefore used a weighted value from the range of 7.9%
for ringed seals and 9.3% for beluga whale.
% of
% of dry matter metabolizable
intake energy
Zoo Age Sex Fat Protein Fat Protein
Alaska Zoo, Anchorage, AK 16 F 72 28 85 15
Brookfield Zoo, Chicago, IL 13 M 67 33 81 19
13 F 54 46 71 29
Columbus Zoo, Columbus, OH
20 M 59 41 75 25
24 M 58 42 75 25
Como Park Zoo and Conservatory, St. Paul, MN
24 M 63 37 78 22
14 M 71 29 84 16
Detroit Zoo, Detroit, MI
6 F 55 45 72 28
Seneca Park Zoo, Rochester, NY 24 F 50 50 61 39
Average (stdev) for Zoo bears 60 ± 9 40 ± 9 76 ± 7 24 ± 7
Brown bears (salmon/salmon oil) 66 ± 5 34 ± 5 80 ± 3 20 ± 3
F 69 ± 8 31 ± 2 83 17
Chukchi Sea adult polar bears
M 63 ± 5 37 ± 2 78 21
F 70 ± 8 30 ± 2 82 17
Chukchi Sea young adult bears
M 67 ± 8 33 ± 2 81 19
F 70 ± 8 30 ± 2 83 17
Chukchi Sea subadult bears
M 71 ± 9 29 ± 2 84 16
Average for Chukchi Sea bears 68 32 82 18
Table 2. Fat and protein intake of 9 zoo polar bears and 5 captive brown bears fed ad libitum options of meat
and fat (lard or salmon oil) and free-ranging polar bears in the Chukchi (n = 229) consuming diets of marine
mammal prey. Zoo polar bears were provided lean meat and lard. Brown bears were provided salmon and
salmon oil11. Standard deviations were calculated for the dry matter intake of fat and protein of Chukchi Sea
polar bears using standard deviations of individual dietary components in Table 1 with respective proportional
protein and fat content of prey tissues.
efficiency of mass gain (y): y = 0.1370–0.0007x, R2 = 0.52, F1,8 = 8.7, p = 0.02). The higher energetic cost for main-
taining body mass (maintenance energy cost determined by solving the equation of the line in Fig. 1 for y = 0) of
zoo polar bears than brown bears was expected due to the larger exhibits available for zoo polar bears to roam
compared to the habitat for the captive brown bears in previous studies. Further, while efforts could be made to
standardize energetic costs of brown bears in previous studies, such controls were not possible with zoo polar
bears on exhibit. Thus, both wild and zoo polar bears selected protein and fat at levels consistent with minimizing
maintenance energy costs and higher efficiencies of mass gain as previously observed in brown bears (Fig. 2).
Scientific Reports | (2021) 11:15309 | https://doi.org/10.1038/s41598-021-94917-8 3
Vol.:(0123456789)www.nature.com/scientificreports/
Figure 1. Relationship between digestible energy intake and mass change of 9 polar bears fed ad libitum lean
meat and lard. Energy intake and mass change is presented relative to body mass scaled to metabolic rate (i.e.,
kg0.75). An adult male (Hudson) at the Brookfield Zoo was reported to have paced extensively during the trial
while isolated from an adult female and was not included in the regression.
Figure 2. The non-linear relationship between dietary protein content and the energy required to maintain
body mass (maintenance cost) for brown bears fed diets varying in dietary protein content (data points) in
comparison to the dietary protein levels selected and consumed by wild and zoo polar bears. Low and high
protein diets are associated with high maintenance energy costs. The dietary protein content selected by wild
polar bears feeding on marine mammals as indicated by the solid vertical line, and the dietary protein content
selected by zoo polar bears in feeding studies with ad libitum access to lean meat and lard as indicated by
the dashed vertical line were within the range associated with minimization of maintenance energy costs.
Brown bear diets ranged from 100% fruit (3% protein) to 100% salmon (61% protein) or 100% white-tailed
deer9–11,24. Reference24 did not report meat protein content, so the protein content of white-tailed deer meat was
determined from Ref.25. Digestible dry matter was converted to kcal using dry matter digestibility of deer for
brown bears from Ref.26.
Health indicators, lifespan, and causes of death in wild and zoo polar bears. The average age
of adult male and female polar bears (> 4 years of age) captured in two subpopulations that range in Alaska
(the southern Beaufort and Chukchi Sea subpopulations) from 1983 to 2017 was 11.5 ± 5.2 (n = 982) and
11.3 ± 5.1 years (n = 640), respectively. The oldest females captured in the two subpopulations were 29 in the
southern Beaufort Sea and 30 in the Chukchi Sea and the oldest males were 28 in the southern Beaufort Sea and
27 in the Chukchi Sea, respectively. Only 6.5% of 1622 adult bears captured in the two subpopulations between
1983 and 2017 were over the age of 20.
During the 6 years from 2015 to 2020, 19 adult polar bears died in American zoos at an average age of
27 ± 6 years. Kidney disease was listed as a cause of death for 37% (7/19) of zoo polar bears and liver disease or
cancer was listed as a cause of death for 32% (6/19) (Supplementary Table S1). Liver cancer and kidney disease co-
occurred in 1 bear. Bears that died solely of kidney disease or kidney disease co-occurring with heart disease (but
not liver disease and cancer) were, on average, 10 years younger (22 ± 5 years; n = 5) than bears that died of other
causes (32 ± 5 years; n = 8; one-way ANOVA: F2,14 = 7.7, p = 0.006; Bonferroni post-hoc tests: p = 0.005). Bears
listed with the cause of death as liver disease or cancer were 28 ± 4 years old (n = 5) which did not differ from the
age of bears dying of other causes (post-hoc test: p = 0.36).
Scientific Reports | (2021) 11:15309 | https://doi.org/10.1038/s41598-021-94917-8 4
Vol:.(1234567890)www.nature.com/scientificreports/
Serum urea (15.7 ± 12.2 mg/dl; range = 1–85.5; n = 628) and creatinine (1.1 ± 0.4 mg/dl; range = 0.3–3.5;
n = 628) levels of wild adult polar bears sampled in the southern Beaufort and Chukchi Sea subpopulations
were well below values observed in zoo polar bears with chronic kidney disease (serum urea: 180.1 ± 77.8 mg/dl;
n = 9; creatinine: 14.8 ± 12.7 mg/dl; n = 90)27. Mean phosphorus levels of wild adult bears (5.6 ± 1.3 mg/dl; n = 628)
were also below those of polar bears with kidney disease (14.5 ± 6.9 mg/dl; n = 8)27, but 3 wild bears exhibited
phosphorus levels above 10.0 (range 1.7–13.2 mg/dl). For wild polar bears age 20 and older (n = 32), urea aver-
aged 13.8 ± 11.8 (range 3–40), creatinine averaged 1.1 ± 0.3 (0.7–2.0), and phosphorus averaged 5.7 ± 1.9 (range
2.9–13.2). Urea, creatinine, and phosphorus levels did not differ between bears < 20 years old and bears age 20
and older (p > 0.05).
Discussion
Wild and zoo polar bears and captive brown bears strongly preferred diets high in fat and low in protein (Ref.11;
this study), suggesting that the macronutrient requirements of polar bears closely align with those of the omnivo-
rous brown bear. Because the largest males do most of the breeding and the fattest females have the highest prob-
ability of producing surviving cubs28, evolution should have favored bears that select the most efficient balance
of macronutrients. The efficiency of mass gain on high fat diets may have similarly played a role in the evolution
of polar bear milk consumed by cubs between 4 and 16 months of age which has an average dry matter content
of 23.6% protein, 69.7% fat, and 3.1% carbohydrates, or a metabolizable energy ratio of 14% protein: 82% fat:
4% carbohydrate29. Although other marine mammals have high fat milks, most lactate for much shorter periods
(< 2 months) than polar bears to promote rapid growth of young required for swimming and at-sea feeding.
Consistency in macronutrient composition of milk for young, rapidly growing cubs and diets selected by fully
grown adults suggests that these protein levels meet requirements of both growing and fully grown individuals
of both sexes. High fat milk and selective feeding on blubber by polar bears after weaning also maximize energy
intake supporting polar bears to be the largest of the ursid species.
Although few studies of the feeding ecology of predators consider the implications of macronutrient con-
sumption, consuming protein in excess of requirements increases energy intake requirements in a variety of taxa
because of the need to metabolize and excrete excess nitrogen (e.g., mink Neovison vison30; Stellar sea lions31;
harp seals Phoca groenlandica32; harbor seals Phoca vituline33; northern fur seals Callorhinus ursinus34; pigs35;
humans36). Selected protein levels vary across carnivores in which data are available, but some patterns are
consistent with phylogeny. Among species in the Order Carnivora, cats (i.e., felids) and hyenas diverged from
all other carnivores 35–38 million years ago37 and specialize in the consumption of high protein, lean meat diets
(e.g., ≥ 50% of metabolizable energy (ME) as p rotein18,38) whereas other carnivores select diets lower in protein
(< 40% of ME as protein) and exhibit higher nitrogen excretion and metabolic costs when consuming diets above
selected levels ( canids39; harbor s eals33; northern fur s eals34; mink30; brown bears11). For example, the percent
of metabolizable energy available to northern fur seals declined from 83 to 71% on diets containing 36% and
63% of energy from protein, r espectively34. Similarly, declines in Steller sea lions (Eumetopias jubatus) in Alaska
have been linked to the increased metabolic cost of consuming and metabolizing higher-protein, lower fat prey
(54% of ME as protein; pollock; Theragra chalcogramma) consequent to reduced availability of lower protein
Pacific herring (36% of ME as protein; Clupea pallasi)40. The energetic consequences of consuming protein above
physiological requirements likely also explains observed selective feeding for fat-rich prey parts in non-felid
carnivores (e.g., harbor s eals41).
In addition to affecting energetic requirements, overconsumption of protein has been associated with nega-
tive effects on kidney and liver health. Pigs and rats fed diets with 35% of energy from protein developed kidney
damage and exhibited higher kidney weights and higher creatinine c learance42,43 as the kidneys worked to excrete
excess nitrogen. In humans, diets high in animal protein impair kidney function, increase the propensity for
kidney disease, and increase the progression of kidney disease44. Protein intake above requirements even in cats
has been identified as a precursor to chronic kidney d isease45. Similarly, high protein intake has been associated
46
with increased risk of liver cancer in humans . Thus, excretion of nitrogen in excess of requirements is associ-
ated with effects on kidney and liver health across a variety of taxa.
Current zoo polar bear diets are higher in protein (51% dry matter) than those consumed by wild polar bears
(32%) and selected by zoo polar bears (40%). Because zoo polar bears are also fed carbohydrates which have
lower calorie density than fats, protein contributes approximately twice as much to their caloric intake (37%)
when compared to diets consumed by wild bears (18%) and selected by zoo bears in ad libitum trials (24%).
Chronic kidney disease (29% of zoo polar bear mortalities from 1995 to 2 01127; 37% this study) and liver disease
and cancers (32%) are the primary causes of death in zoo polar bears, the former of which may have increased in
prevalence in recent years (this study). Zoo polar bears dying of kidney disease died 10 years earlier than bears
dying of other causes and 5–9 years earlier than the maximum age achieved by wild polar bears. Serum urea,
creatinine, and phosphorus levels measured in over 600 wild adult polar bears (this study) and among 35 wild
polar bears in S valbard47 were consistently well below levels documented in zoo polar bears with chronic kidney
disease27, suggesting that kidney disease is not an affliction in wild polar bears. Thus, the potential that high
protein intake may affect metabolism and kidney and liver health suggests the need for careful consideration of
protein levels in formulated diets for carnivores (i.e., species in the order carnivora)—particularly ursids which
have a long evolutionary history of omnivory and diets dominated by carbohydrates or fat.
Achieving optimal protein intake has the potential to become an increasing challenge for wild polar bears. The
most common prey of polar bears is ringed seals (Pusa hispida), which contribute 60–80% of the diet but vary
widely in energy content with changes in blubber composition21,48. Adult ringed seals can range from 29 to 50%
blubber49, and ringed seals of all ages range in total fat content of 34–76% of dry matter and 52–85% of total body
energy14. Thus, if polar bears consume entire ringed seals as opposed to selectively feeding on blubber, dietary
Scientific Reports | (2021) 11:15309 | https://doi.org/10.1038/s41598-021-94917-8 5
Vol.:(0123456789)www.nature.com/scientificreports/
protein can be up to 66% of dry matter intake and within ranges associated with increased maintenance energy
requirements (Fig. 2). This could be occurring in areas where access to seals appears to be reduced, including the
southern Beaufort S ea20 and Hudson B ay50. Furthermore, in some areas polar bears are spending longer periods
on land where they scavenge on the remains of subsistence harvested bowhead whales in which the blubber
has been r emoved51. As polar bears increasingly use terrestrial habitats throughout the A rctic52, they will be
challenged to simultaneously meet their high total energy requirements and avoid the increased energetic costs
associated with metabolizing protein-rich terrestrial mammals and bird eggs and the reduced energy intake from
carbohydrate-dominated plants as opposed to lipid-rich marine mammals53. Thus, their evolutionary divergence
from brown bears and the associated physiological constraints on protein intake are likely an additional factor
limiting the adaptation of polar bears to sea ice loss.
The energetic and health consequences of consuming protein in excess of physiological requirements appear
to be near-universal across taxa consequent to similar physiological processes for coping with excess nitrogen
that require energy and tax the liver and kidneys in ways that can lead to disease. In animal nutrition, protein is
primarily considered per its role as a limiting resource, as is the case for herbivores. When protein is limited it
can affect species behavior, health, and population dynamics54. Yet, our results, along with those of others34,40,55,
suggest that the implications of protein overconsumption may play an equally important role in affecting behav-
ior, health, and conservation.
Methods
Estimation of dietary fat consumption of wild polar bears. We used stable isotopes of carbon and
nitrogen in polar bear hair and prey bulk (i.e., not lipid-extracted) blubber and muscle samples to estimate the
contribution of prey blubber to the diets of polar bears in the Chukchi Sea. The Chukchi Sea subpopulation
ranges on sea ice over productive shallow continental shelf waters between the northwest coast of Alaska and
the northeast coast of Russia. Recent studies indicate that this population is not currently prey-limited and has
maintained body condition and survival rates that support a stable p opulation20–22,56. Similarly, populations of
the two primary prey species, bearded (Erignathus barbatus) and ringed seals, appear to be stable57.
Blubber has a substantially lower δ13C and a marginally higher δ15N content than m uscle58 resulting in these
tissues being isotopically distinct among polar bear prey. For example, bulk muscle and blubber of ringed seal
sampled in the Alaskan Chukchi Sea had an average δ13C of − 18.9 ± 0.9 (stdev; n = 43) and − 25.4 ± 0.7 (n = 6),
respectively (Supplementary Table S2). Other prey species similarly exhibited a substantial difference in δ13C
between muscle and blubber that, in most cases, exceeds differences between prey species (Supplementary
Table S2). We capitalized on these isotopic differences to estimate contributions of prey blubber and muscle
tissue to polar bear diets inferred from hair.
Guard hair was collected from the upper forearm of polar bears captured on sea ice in the spring (i.e.
March–May) in the Alaskan portion of the Chukchi Sea from 2008 to 2017 and analyzed for δ13C and δ15N. Bears
were located by helicopter and immobilized with zolazepam-tiletamine (Telazol) administered via a dart. Immo-
bilization and sampling was approved and carried out in accordance with the U.S. Marine Mammal Protection
and Endangered Species Acts, under the U.S. Fish and Wildlife Service (USFWS) permit number MA 046081 and
animal handling protocols established by the USFWS Region 7 Institutional Animal Care and Use Committee.
Hairs collected from polar bears in the spring primarily represent the period of maximum hair growth that
occurred the prior June–August with some additional growth occurring in September and October59. A prey
carbon and nitrogen isotope library was generated for muscle and blubber of known prey species collected from
subsistence harvested marine mammals and carcasses of polar bear hunted prey encountered during annual
capture efforts (Supplementary Table S2). These included ringed seal, bearded seal, walrus (Odobenus rosmarus),
beluga whale (Delphinapterus leucas), bowhead whale (Balaena mysticetus), and gray whale (Eschrichtius robus-
tus)21,60. Pups and calves of bearded seal, ringed seal, and walrus were also included as separate prey items
due to the unique isotopic signature of their muscle in comparisons to non-nursing, older individuals of each
species61. Details on polar hair and prey muscle and blubber preparation and isotopic analyses are provided in
Supplementary Appendix S1.
The proportion of blubber and muscle consumed from each food item was estimated using the Bayesian mix-
ing model framework, MixSIAR, implemented in R 62. We used bulk trophic enrichment factors (TEFs) derived
for hair from zoo polar bears fed diets that mimicked the carnivorous (i.e. protein and fat only), marine diets
consumed by free-ranging polar bears63. The TEFs were corrected for differential C concentration in dietary fat
and protein assuming these macronutrients were composed of 74% and 42% C, respectively63. This resulted in
bulk diet TEFs of Δ13C = 7.72 ± 0.60‰ and Δ15N = 1.47 ± 1.07‰. We included the combination of sex and age
class as a categorical variable with six levels, including males and females of three age classes: subadults (inde-
pendent bears age 2–4), young adults (age 5–10) and adults (age 11+). These classes differentiate reproductively
mature individuals (age 5+) from non-reproductively mature (2–4) and full-grown males (11+) from males that
are continuing to increase in length and body mass (age 5–10) as described by Ref.21. Dependent offspring were
excluded from the analysis.
We initially included the muscle and blubber of all prey in diet models. However, the results indicated that
there was a 95% chance that the muscle of walrus calves and non-calves, gray whale and bowhead whale each
contributed ≤ 1% to the total diet. Because many of these are large prey species in which polar bears would be
likely to select exclusively for blubber, and the initial results suggested low dietary proportions, these prey tissues
were removed from the final diet model. Although these were all prey muscle, removing these species tissues
from the diet estimates had minimal effect on our estimate of percent dietary fat (i.e., the model with all prey
muscle components generated a fat estimate of 67% dietary fat as dry matter compared to 68% dietary fat when
these components were excluded).
Scientific Reports | (2021) 11:15309 | https://doi.org/10.1038/s41598-021-94917-8 6
Vol:.(1234567890)www.nature.com/scientificreports/
Not all tissues from prey species could be differentiated isotopically because both their δ13C and δ15N values
overlapped. Therefore, we combined dietary proportions estimated from the model for tissues of species in which
both δ13C and δ15N overlapped, including pup and non-pup blubber for bearded and ringed seals (i.e., the two
species blubber differed but pups and non-pups of each species overlapped), muscle of ringed and bearded seal
non-pups and beluga whale, and the muscle of ringed and bearded seal p ups62. Thus, final prey proportions are
combined among some species and tissues. The MixSIAR model generated average muscle and blubber prey
proportions for each of the six combinations of polar bear sex and age class.
Dietary fat content was determined by summing the percent of fat contributed by muscle and blubber com-
ponents of each species in the diet. Blubber fat contents were estimated per gravimetric analyses described in
Supplementary Appendix S1 and supplemented with values provided by Ref.23. Because prey and hair samples
are dried for isotope analysis, %blubber and %dietary fat estimates are on a dry matter basis. Standard deviations
were calculated for the dry matter intake of fat and protein of Chukchi Sea polar bears using standard deviations
of individual dietary components in Table 1 with respective proportional protein and fat content of prey tissues.
Isotopic estimates from hair represent assimilated diet and therefore do not require correction for digestion and
metabolism. The contribution of mean dietary fat and protein to metabolizable energy was determined using
Atwater specific factors of 4.27 kcal/g dry matter for meat protein and 9.03 kcal/g dry matter for meat l ipid64.
Macronutrient composition of diets fed to polar bears at North American zoos. The protein,
fat, and digestible carbohydrate (i.e., sugars and starch) content of diets fed to polar bears in 10 North American
Zoos were estimated using nutrient analyses provided by the zoos, manufacturers’ data for the commercial diets,
and nutrient composition tables such as that found at https://fdc.nal.usda.gov/ for foods commonly consumed
by humans. When zoo diets varied seasonally, the average macronutrient content of the two diets was used to
estimate the average across zoos. The metabolizable energy content of the diets fed to zoo polar bears was calcu-
lated by multiplying the total dry matter amount of protein, fat, and carbohydrate fed by Atwater specific factors
of 4.1 kcal/g for proteins and carbohydrates and 9.0 kcal/g fat11,64 rather than the meat-specific values since the
source of macronutrients from animal or plant matter varied.
Feeding trials to measure macronutrient selection of zoo polar bears. Fourteen-day macronutri-
ent selection trials were conducted with 9 polar bears (5 males and 4 females) in cooperation with 6 U.S. zoos.
This research was approved and carried out in accordance with a letter of authorization from the USFWS issued
October 18, 2018 and study protocols were approved by the U.S. Geological Survey Alaska Science Center’s Ani-
mal Care and Use Committee (IACUC) and the American Zoological Association’s Polar Bear Research Council.
Bears were given the opportunity to consume either lean meat (e.g., lean beef, horse meat, or a low fat commer-
cial canine diet such as Nebraska Premium Canine) or fat (e.g., lard or trimmed beef or pork fat) presented in
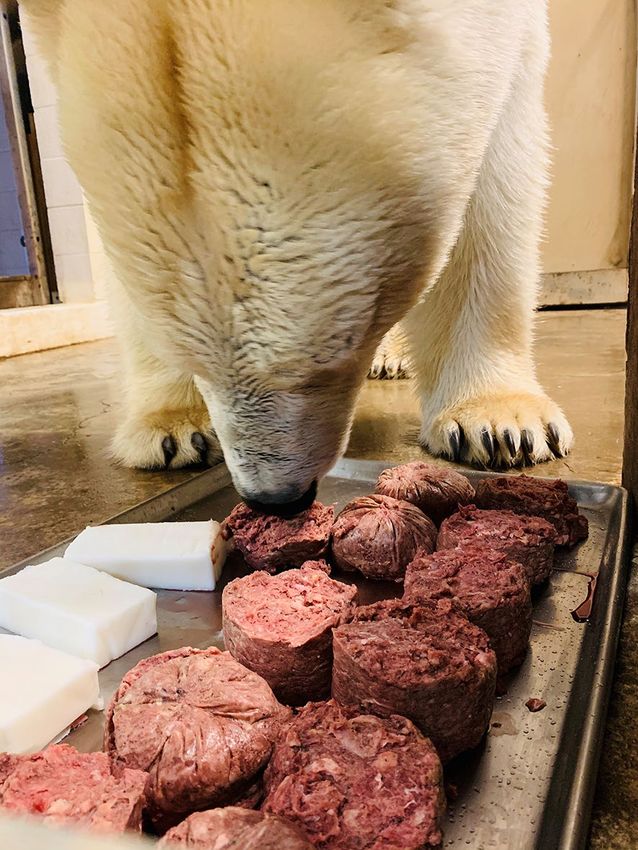
separate piles ad libitum during 2–3 feedings per day (Fig. 3). A 4-day dietary adjustment period occurred prior
to each 14-day trial during which each bear was given increasing amounts of both foods. By the 3rd or 4th day of
the adjustment period, the amount offered was increased to ad libitum such that surplus food was still available
at the end of each meal. Each bear was weighed prior to their first feeding of the 14-day trial and before feeding
on the morning following the last day of the trial. The meat and fat offered and rejected were weighed each day
to determine the total amount consumed. Samples of each food were collected throughout the study and stored
frozen immediately after collection and during shipping to Washington State University for nutritional analyses.
Samples were freeze-dried to determine dry matter content, ground and analyzed to estimate crude protein con-
tent (N X 6.25) via a nitrogen-carbon analyzer, fat content by ether extraction, and gross energy content by bomb
calorimetry11. Carbohydrates were not measured because meat has < 1% soluble carbohydrates. Digestibility of
fat and energy were estimated as 99% and 97%, r espectively65. The metabolizable energy content of each bear’s
selected diet was calculated by multiplying the total dry matter amount of protein and fat consumed during the
14-day study by the Atwater specific factors for meat protein and meat lipid used for wild bear diets.
We used a mixed effects model to test for changes in macronutrient preferences within and between bears
during the 14-day trials. The dependent variable was % dietary fat, bear was a random effect, and trial day was a
fixed effect for each bear (i.e., accounting for repeated measures for each bear). We used an ANOVA to test for
differences between the macronutrient preferences of zoo polar bears and the macronutrient consumption of
the six sex and age classes of wild polar bears. We used an α level of 0.05 to test for significance.
Serum indicators of kidney function in wild and zoo polar bears. Blood samples were collected
from 628 adult (age 5 + years) polar bears of both sexes captured in two polar bear subpopulations that range in
Alaska (the Chukchi and southern Beaufort Sea subpopulations) from 2004 to 2017 and analyzed for serum urea,
creatinine, and phosphorus levels to determine if levels were consistent with those of zoo polar bears exhibiting
chronic kidney disease reported by Ref.27: serum urea (180.1 ± 77.8 mg/dl; n = 9), creatinine (14.8 ± 12.7 mg/
dl; n = 9) and phosphorus levels (14.5 ± 6.9 mg/dl; n = 8). All wild bears were sampled between March and May.
Blood was collected and stored unfrozen during transport to base camps where samples were centrifuged to
remove serum. Serum was stored frozen until analysis. Both serum urea and creatinine have been found to be
stable in blood samples for up to 10 years20. All samples in this study were analyzed within 10 years of collection.
Thawed serum was analyzed for urea and creatinine levels using comprehensive rotors with an Abaxis vetscan
(Abaxis, Inc., Union City, CA, USA20). Independent bears in both subpopulations were aged by counting the
cementum annuli in a vestigial premolar. Dependent young were aged based on tooth eruption patterns which
differ between first year cubs, yearlings, and two-year olds. Female polar bears typically wean cubs by the age of
2. We report averages, standard deviations, and ranges for all bears age 3 and older and bears age 20 and older.
Scientific Reports | (2021) 11:15309 | https://doi.org/10.1038/s41598-021-94917-8 7
Vol.:(0123456789)www.nature.com/scientificreports/
Figure 3. A female polar bear at the Columbus zoo selects among lean meat and lard food options (Photo c/o
Devon Sabo).
Lifespan and causes of death in wild and zoo polar bears. We examined the age of death and causes
of mortality for polar bears held in zoos based on news reports. Mortality data for zoo polar bears were previ-
ously summarized for 1995–2011 by Ref.27. Thus, we report only deaths occurring after 2011. We compared the
age at death among bears listed as dying of kidney disease or kidney disease co-occurring with heart disease
(since heart disease is often a consequence of kidney disease; n = 5), bears listed as dying of liver cancer or disease
(n = 5), and bears listed as dying of other causes (n = 8). We excluded two 19-year old bears that died of a bacterial
infection and meningitis, both of which occurred at the same zoo, from the age comparison. Comparisons were
made using a one-way ANOVA with a Bonferroni post-hoc test.
Natural mortalities of polar bears in the wild are rarely observed. Thus, direct information on the age and
causes of mortality cannot be ascertained. Rather, we summarized the age structure of polar bears captured
from the southern Beaufort Sea subpopulation from 1983 to 2017 and from the Chukchi Sea subpopulation
from 2008 to 2017 to identify the proportion of bears in the subpopulation that reach various ages, as well as
the maximum age achieved by wild bears in these two subpopulations. Both subpopulations are harvested by
hunters from indigenous coastal communities. Harvest rates are estimated to be low (< 4% of the subpopula-
tion) but are typically male-biased which may affect age distribution in older classes. Ages of captured bears was
determined as described above.
Methods for all aspects of data collection from wild and zoo polar bears were carried out in accordance with
relevant guidelines and regulations and approved as specified in the above sections relating to sampling of wild
and zoo polar bears. In addition, all aspects of the study are reported here in accordance with ARRIVE guidelines
(https://arriveguidelines.org).
Data availability
Data used in this study will be released simultaneous to publication at the following locations: Rode, K.D. 2021.
Carbon and Nitrogen Isotope Concentrations in Polar Bear Hair and Prey from the Alaska Beaufort and Chukchi
Seas, 1978–2019: U.S. Geological Survey data release, https://doi.org/10.5066/P9KM5FT2. USGS Alaska Science
Center, Polar Bear Research Program. 2021, Protein and fat consumption of zoo polar bears in 14-day ad libitum
trials 2019–2020: U.S. Geological Survey data release, https://doi.org/10.5066/P9W7MP0T.
Received: 24 April 2021; Accepted: 19 July 2021
Scientific Reports | (2021) 11:15309 | https://doi.org/10.1038/s41598-021-94917-8 8
Vol:.(1234567890)www.nature.com/scientificreports/
References
1. Fuller, A. et al. Physiological mechanisms in coping with climate change. Phys. Biochem. Zool. 83, 713–720. https://doi.org/10.
1086/652242 (2010).
2. Raubenheimer, D., Simpson, S. J. & Tait, A. H. Match and mismatch: Conservation physiology, nutritional ecology and the time-
scales of biological adaptation. Philos. Trans. R. Soc. B 367, 1628–1646. https://doi.org/10.1098/rstb.2012.0007 (2012).
3. Tracy, C. R. et al. The importance of physiological ecology in conservation biology. Integr. Comp. Biol. 46, 1191–1205. https://doi.
org/10.1093/icb/icl054 (2006).
4. Parker, K. L., Barboza, P. S. & Gillingham, M. P. Nutrition integrates environmental responses of ungulates. Funct. Ecol. 23, 57–69.
https://doi.org/10.1111/j.1365-2435.2009.01528.x (2009).
5. Morris, J. G. Idiosyncratic nutrient requirements of cats appear to be diet-induced evolutionary adaptations. Nutr. Res. Rev. 15,
153–168. https://doi.org/10.1079/NRR200238 (2002).
6. Hofmann, R. R. Evolutionary steps of ecophysiological adaptation and diversification of ruminants: A comparative view of their
digestive system. Oecologia 78, 443–457. https://doi.org/10.1007/BF00378733 (1989).
7. Rode, K. D., Chapman, C. A., McDowell, L. R. & Stickler, C. Nutritional correlates of population density across habitats and log-
ging intensities in redtail monkeys (Cercopithecus Ascanius). Biotropica 38, 625–634. https://doi.org/10.1111/j.1744-7429.2006.
00183.x (2006).
8. Birnie-Gauvin, K., Peiman, K. S., Raubenheimer, D. & Cooke, S. J. Nutritional physiology and ecology of wildlife in a changing
world. Cons Phys. 5, cox030. https://doi.org/10.1093/conphys/cox030 (2017).
9. Rode, K. D. & Robbins, C. T. Why bears consume mixed diets during fruit abundance. Can. J. Zool. 78, 1640–1645. https://doi.
org/10.1139/z00-082 (2000).
10. Robbins, C. T. et al. Optimizing protein intake as a foraging strategy to maximize mass gain in an omnivore. Oikos 116, 1675–1683.
https://doi.org/10.1111/j.0030-1299.2007.16140.x (2007).
11. Erlenbach, J. A., Rode, K. D., Raubenheimer, D. & Robbins, C. T. Macronutrient optimization and energy maximization determine
diets of brown bears. J. Mamm. 95, 160–168. https://doi.org/10.1644/13-MAMM-A-161 (2014).
12. Nie, Y. et al. Giant pandas are macronutritional carnivores. Curr. Biol. 29, 1677–1682. https://doi.org/10.1016/j.cub.2019.03.067
(2019).
13. Sponheimer, M., Clauss, M. & Codron, D. Dietary evolution: The panda paradox. Curr. Biol. 29, R417–R419. https://doi.org/10.
1016/j.cub.2019.04.045 (2019).
14. Stirling, I. & McEwan, E. H. The caloric value of whole ringed seals (Phoca hispida) in relation to polar bear (Ursus maritimus)
ecology and hunting behavior. Can. J. Zool. 53, 1021–1027. https://doi.org/10.1139/z75-117 (1975).
15. Liu, S. P. et al. Population genomics reveal recent speciation and rapid evolutionary adaptation in Polar Bears. Cell 157, 785–794.
https://doi.org/10.1016/j.cell.2014.03.054 (2014).
16. Kohl, K. D., Coogan, S. C. P. & Raubenheimer, D. Do wild carnivores forage for prey or for nutrient? Evidence for nutrient-specific
foraging in vertebrate predators. BioEssays 37, 701–709. https://doi.org/10.1002/bies.201400171 (2015).
17. Machovsky-Capuska, G. E. & Raubenheimer, D. The nutritional ecology of marine apex predators. Ann. Rev. Mar. Sci. 12, 361–387.
https://doi.org/10.1146/annurev-marine-010318-095411 (2020).
18. Hewson-Hughes, A. K., Colyer, A., Simpson, S. J. & Raubenheimer, D. Balancing macronutrient intake in a mammalian carnivore:
Disentangling the influences of flavor and nutrition. R. Soc. Open 3, 160081. https://doi.org/10.1098/rsos.160081 (2016).
19. McKinney, M. A., Atwood, T. C., Iverson, S. J. & Peacock, E. Temporal complexity of southern Beaufort Sea polar bear diets during
a period of increasing land use. Ecosphere 8, e01633. https://doi.org/10.1002/ecs2.1633 (2017).
20. Rode, K. D. et al. Spring fasting behavior in a marine apex predator provides an index of ecosystem productivity. Glob. Change
Biol. 24, 410–423. https://doi.org/10.1111/gcb.13933 (2018).
21. Rode, K. D. et al. Variation in the response of an arctic top predator experiencing habitat loss: Feeding and reproductive ecology
of two polar bear populations. Glob. Change Biol. 20, 76–88. https://doi.org/10.1111/gcb.12339 (2014).
22. Rode, K. D. et al. Seal body condition and atmospheric circulation patterns in the Chukchi Sea influence polar bear body condi-
tion, recruitment, and feeding ecology. Glob. Change Biol. https://doi.org/10.1111/gcb.15572 (2021).
23. Yurkowski, D. J., Hussey, N. E., Semeniuk, C., Ferguson, S. H. & Fisk, A. T. Effects of fat extraction and the utility of fat normaliza-
tion models on δ13C and δ15N values in Arctic marine mammal tissues. Pol. Biol. 38, 131–143. https://doi.org/10.1007/s00300-
014-1571-1 (2014).
24. Hilderbrand, G. V., Jenkins, S. G., Schwartz, C. C., Hanley, T. A. & Robbins, C. T. Effect of seasonal differences in dietary meat
intake on changes in body mass and composition in wild and captive brown bears. Can. J. Zool. 77, 1623–1630. https://doi.org/
10.1139/z99-133 (1999).
25. McCullough, D. R. & Ullrey, D. E. Proximate mineral and gross energy composition of white-tailed deer. J. Wildl. Manag. 47,
430–441. https://doi.org/10.2307/3808516 (1983).
26. Pritchard, G. T. & Robbins, C. T. Digestive and metabolic efficiencies of grizzly and black bears. Can. J. Zool. 68, 1645–1651. https://
doi.org/10.1139/z90-244 (1990).
27. LaDouceur, E. E. B., Garner, M. M., Davis, B. & Tseng, F. A retrospective study of end-stage renal disease in captive polar bears
(Ursus maritimus). J. Zoo Wildl. Med. 45, 69–77. https://doi.org/10.1638/2013-0071R.1 (2014).
28. Derocher, A. E. & Stirling, I. Aspects of survival in juvenile polar bears. Can. J. Zool. 74, 1246–1252. https://doi.org/10.1139/z96-
138 (1996).
29. Hedberg, G. E. et al. Milk composition in free-ranging polar bears (Ursus maritimus) as a model for captive rearing milk formula.
Zoo Biol. 30, 550–565. https://doi.org/10.1002/zoo.20375 (2011).
30. Jensen, K. et al. Nutrient-specific compensatory feeding in a mammalian carnivore, the mink, Neovison vison. Br. J. Nutr. 112,
1226–1233. https://doi.org/10.1017/S0007114514001664 (2014).
31. Rosen, D. A. S. & Trites, A. W. Examining the potential for nutritional stress in young Stellar sea lions: Physiological effects of prey
composition. J. Comp. Phys. B 175, 265–273. https://doi.org/10.1007/s00360-005-0481-5 (2005).
32. Kirsch, P. E., Iverson, S. J. & Bowen, W. D. Effect of a low-fat diet on body composition and blubber fatty acids of captive juvenile
harp seals (Phoca groenlandica). Phys. Biochem. Zool. 73, 45–59. https://doi.org/10.1086/316723 (2000).
33. Zhao, L., Schell, D. M. & Castellini, M. A. Dietary macronutrients influence 13C and 15N signatures of pinnipeds: Captive feeding
studies with harbor seals (Phoca vitulina). Physiol. Part A Mol. Integr. Phys. 143, 469–478. https://doi.org/10.1016/j.cbpa.2005.12.
032 (2006).
34. Diaz Gomez, M., Rosen, D. A. S. & Trites, A. W. Net energy gained by northern fur seals (Callorhinus ursinus) is impacted more
by diet quality than diet diversity. Can. J. Zool. 94, 12–135. https://doi.org/10.1139/cjz-2015-0143 (2016).
35. Le Bellego, L., van Milgen, J. & Noblet, J. Effect of high temperature and low-protein diets on performance of growing pigs. J. Anim.
Sci. 79, 1259–1271. https://doi.org/10.2527/2001.7951259x (2002).
36. Anton, S. D. et al. Effects of popular diets without specific calorie targets on weight loss outcomes: Systematic review of findings
from clinical trials. Nutrients 9, 822. https://doi.org/10.3390/nu9080822 (2017).
37. Bininda-Emonds, O. R. P., Gittleman, J. L. & Purvis, A. Building large trees by combining phylogenetic information: A complete
phylogeny of the extant Carnivora (Mammalia). Biol. Rev. 74, 143–175. https://doi.org/10.1017/S0006323199005307 (1999).
Scientific Reports | (2021) 11:15309 | https://doi.org/10.1038/s41598-021-94917-8 9
Vol.:(0123456789)www.nature.com/scientificreports/
38. Plantinga, E. A., Bosch, G. & Hendriks, W. H. Estimation of the dietary nutrient profile of free-roaming feral cats: Possible implica-
tions for nutrition of domestic cats. Br. J. Nutr. 106, S35–S48. https://doi.org/10.1017/S0007114511002285 (2011).
39. Hewson-Hughes, A. K. et al. Geometric analysis of macronutrient selection in breeds of the domestic dog, Canis lupus familiaris.
Behav. Ecol. 24, 293–304. https://doi.org/10.1093/beheco/ars168 (2013).
40. Trites, A. W. & Donnelly, C. P. The decline of Steller sea lions Eumetopias jubatus in Alaska: A review of the nutritional stress
hypothesis. Mamm. Rev. 33, 3–28. https://doi.org/10.1046/j.1365-2907.2003.00009.x (2003).
41. Hauser, D. D. W., Allen, C. S., Rich, H. B. Jr. & Quinn, T. P. Resident harbor seals (Phoca vitulina) in Iliamna Lake, Alaska: Summer
diet and partial consumption of adult sockeye salmon (Oncorhynchus nerka). Aquat. Mamm. 34, 303–309. https://doi.o rg/1 0.1 578/
AM.34.3.2008.303 (2008).
42. Jia, Y. et al. Long-term high intake of whole proteins results in renal damage in pigs. J. Nutr. 140, 1646–1652. https://doi.org/10.
3945/jn.110.123034 (2010).
43. Wakefield, A. P., House, J. D., Ogborn, M. R., Weiler, H. A. & Aukema, H. M. A diet of 35% of energy from protein leads to kidney
damage in female Sprague–Dawley rats. Br. J. Nutr. 106, 656–663. https://doi.org/10.1017/S0007114511000730 (2011).
44. Ko, G.-J., Rhee, C. M., Kalantar-Zadeh, K. & Joshi, S. The effects of high-protein diets on kidney health and longevity. J. Am. Soc.
Nephrol. 31, 1667–1679. https://doi.org/10.1681/ASN.2020010028 (2020).
45. Bӧswald, L. F., Kienzle, E. & Dobenecker, B. Observation about phosphorus and protein supply in cats and dogs prior to the
diagnosis of chronic kidney disease. J. Phys. Anim. Nutr. 102, 31–36. https://doi.org/10.1111/jpn.12886 (2017).
46. Ioannou, G. N., Morrow, O. B., Connole, M. L. & Lee, S. P. Association between dietary nutrient composition and the incidence
of cirrhosis or liver cancer in the united states population. Hepatology 50, 175–184. https://doi.org/10.1002/hep.22941 (2009).
47. Tryland, M. et al. Plasma biochemical values from apparently healthy free-ranging polar bears from Svalbard. J. Wildl. Dis. 38,
566–575. https://doi.org/10.7589/0090-3558-38.3.566 (2002).
48. Thiemann, G. W., Iverson, S. J. & Stirling, I. Polar bear diets and Arctic marine food webs: Insights from fatty acid analysis. Ecol.
Monogr. 78, 591–613. https://doi.org/10.1890/07-1050.1 (2008).
49. Ryg, M., Smith, T. G. & Oritsland, N. A. Seasonal changes in body mass and body composition of ringed seals (Phoca hispida) on
Svalbard. Can. J. Zool. 68, 470–475. https://doi.org/10.1139/z90-069 (1990).
50. Ferguson, S. H. et al. Demographic, ecological, and physiological responses of ringed seals to an abrupt decline in sea ice avail-
ability. Peer J. 5, e2957. https://doi.org/10.7717/peerj.2957 (2017).
51. Atwood, T. C. et al. Rapid environmental change drives increased land use by an Arctic marine predator. PLoS One 11, 30155932.
https://doi.org/10.1371/journal.pone.0155932 (2016).
52. Molnar, P. K. et al. Fasting season length sets temporal limits for global polar bear persistence. Nat. Clim. Change 10, 732–738.
https://doi.org/10.1038/s41558-020-0818-9 (2020).
53. Rode, K. D., Robbins, C. T., Nelson, L. & Amstrup, S. C. Can polar bears use terrestrial foods to offset lost ice-based hunting
opportunities?. Front. Ecol. Environ. 13, 138–145. https://doi.org/10.1890/140202 (2015).
54. McArt, S. H. et al. Summer nitrogen availability as a bottom-up constraint on moose in south-central Alaska. Ecology 90, 1400–
1411. https://doi.org/10.1890/08-1435.1 (2009).
55. Lahtinen, M., Clinnick, D., Mannermaa, K., Salonen, J. S. & Viranta, S. Excess protein enabled dog domestication during severe
Ice Age winters. Sci. Rep. 11, 7. https://doi.org/10.1038/s41598-020-78214-4 (2021).
56. Regehr, E. V., Hostetter, N. J., Wilson, R. R. & Rode, K. D. Integrated population modeling provides the first empirical estimates
of vital rates and abundance for polar bears in the Chukchi Sea. Sci. Rep. 8, 16780. https://doi.org/10.1038/s41598-018-34824-7
(2018).
57. Crawford, J. A., Quakenbush, L. T. & Citta, J. J. A comparison of ringed seal and bearded seal diet, condition, and productivity
between historical (1975–19480 and recent (2003–2012) periods in the Alaskan Bering and Chukchi Seas. Progr. Oceanogr. 136,
133–150. https://doi.org/10.1016/j.pocean.2015.05.011 (2015).
58. Germain, L. R., McCarthy, M. D., Koch, P. L. & Harvey, J. T. Stable carbon and nitrogen isotopes in multiple tissues of wild and
captive harbor seals (Phoca vitulina) off the California coast. Mar. Mamm. Sci. 28, 542–560. https://doi.org/10.1111/j.1748-7692.
2011.00516.x (2011).
59. Erlenbach, J. A. Nutritional and landscape ecology of brown bears (Ursus arctos). PhD dissertation. Washington State University,
Pullman, WA, USA (2020).
60. Laidre, K. L., Stirling, I., Estes, J. A., Kochnev, A. & Roberts, J. Historical and potential future importance of large whales as food
for polar bears. Front. Ecol. Environ. 16, 515–524. https://doi.org/10.1002/fee.1963 (2018).
61. Newsome, S. D., Koch, P. L., Etnier, M. A. & Aurioles-Gamboa, D. Using carbon and nitrogen isotope values to investigate maternal
strategies in northeast Pacific otariids. Mar. Mamm. Sci. 22, 556–572. https://doi.org/10.1111/j.1748-7692.2006.00043.x (2006).
62. Stock, B. C. et al. Analyzing mixing systems using a new generation of Bayesian tracker mixing models. Peer J. 6, e5096. https://
doi.org/10.7717/peerj.5096 (2018).
63. Rode, K. D. et al. Isotopic incorporation and the effects of fasting and dietary fat content on isotopic discrimination in large car-
nivorous mammals. Phys. Biochem. Zool. 89, 182–197. https://doi.org/10.1086/686490 (2016).
64. Merrill, A. L. & Watt, B. K. Energy Value of Foods: Basis and Derivation, Revised. Agriculture Handbook 74 (United States Depart-
ment of Agriculture, 1973).
65. Dyck, M. G. & Morin, P. In vivo digestibility trials of a captive polar bear (Ursus maritimus) feeding on harp seal (Pagophilus
growenlandicus) and Arctic charr (Salvelinus alpinus). Pak. J. Zool. 43, 759–767 (2011).
Acknowledgements
The following zoos and individuals collected the necessary data to estimate protein:fat selection in zoo polar
bears: Alaska Zoo: Shannon Jensen; Chicago Zoological Society—Brookfield Zoo: Amy Roberts, Anne Nichols,
and Jennifer Watts; Cincinnati Zoo: Barbara Henry; Columbus Zoo: Devon Sabo and Dana Hatcher; Como Zoo:
Allison Jungheim; Detroit Zoo: Randi Meyerson, Wynona Shellburger, Betsie Meister, and Mary Wulff; Hogle
Zoo: Nancy Carpenter; North Carolina Zoo, Jennifer Ireland; Oregon Zoo: Amy Cutting; Seneca Park Zoo:
Randi Krieger; Toronto Zoo: Jaap Wensvoort and Sarra Gourlie; San Diego Zoo: Mike Landridge, Matt Akel,
Megan Owen, Becky Wolf and Nate Wagner; and Zoo sauvage de Saint-Félicien: Christine Gagnon and Stéph-
anie Grenier-Laroche. Lori Quakenbush (Alaska Department of Fish and Game), Lara Horstmann (University
of Alaska—Fairbanks) and Matt Rogers (National Oceanic and Atmospheric Administration) provided polar
bear prey samples and isotope data. This project was funded by the U.S. Geological Survey’s Changing Arctic
Ecosystems Initiative and the Detroit Zoological Society. The U.S. Fish and Wildlife Service Marine Mammals
Management program (MMM) provided hair and prey samples for isotope analysis and the U.S. Geological Sur-
vey polar bear program provided blood samples for chemistry analyses and age and sex data of sampled bears.
Any use of trade, firm, or product names is for descriptive purposes only and does not imply endorsement by
the U.S. Government.
Scientific Reports | (2021) 11:15309 | https://doi.org/10.1038/s41598-021-94917-8 10
Vol:.(1234567890)You can also read