Energy-Efficient Products and Competitiveness in the Manufacturing Sector
←
→
Page content transcription
If your browser does not render page correctly, please read the page content below
Journal of Open Innovation:
              Technology, Market, and Complexity

Article
Energy-Efficient Products and Competitiveness in the
Manufacturing Sector
Giacomo Di Foggia

                                           Department of Business and Law, University of Milano-Bicocca, 20126 Milano, Italy; giacomo.difoggia@unimib.it

                                           Abstract: Transition to a low-carbon, energy-efficient economy presents an opportunity to enhance
                                           the sustainability and competitiveness of manufacturing firms. The integration of energy-efficiency
                                           solutions into products resembles the concept of servitization that is now a lever for product com-
                                           petitiveness and, in turn, business performance. Based on empirical data from 293 manufacturers
                                           of electrical equipment or machinery and equipment, this paper analyzes the relation between
                                           energy-efficiency servitization capacity and performance using two structural equation models. To
                                           test the mediating role of servitization capacity, the first model uses strategic analysis of competitive
                                           structure to predict business performance, while the second model uses knowledge of the regulatory
                                           framework. Results suggest that both strategic analysis of competitive structure and knowledge
                                           of the regulatory framework positively influence performance via improving servitization capacity.
                                           With demand for new energy-efficient products expected to increase, products with a reduced en-
                                           ergy footprint and energy-management services are needed for industrial processes to contribute to
                                           decarbonizing the economy.

                                           Keywords: energy efficiency; manufacturing; servitization; green economy; innovation


Citation: Di Foggia, G.                    1. Introduction
Energy-Efficient Products and                    To achieve environmental goals such as limiting global warming to well below 2 ◦ C by
Competitiveness in the                     2030, necessary actions must be considered in all sectors, including an increase in industrial
Manufacturing Sector. J. Open Innov.       energy efficiency. The efficient use of energy has become a lever for transforming industrial
Technol. Mark. Complex. 2021, 7, 33.
                                           processes, and this will ensure increasing demand for new energy-efficient products. For
https://doi.org/10.3390/joitmc
                                           this reason, products with a reduced energy footprint and energy-management services
7010033
                                           are needed to enhance the energy efficiency of industrial processes.
                                                 As the energy-efficient products that drive the development of a low-carbon economy
Received: 26 October 2020
                                           are usually more expensive [1], it is important to understand if and to what extent manu-
Accepted: 11 January 2021
Published: 14 January 2021
                                           facturers consider the integration of energy-saving characteristics in products a valuable
                                           strategy [2] and to examine the effects on performance [3]. Energy-efficient products are es-
Publisher’s Note: MDPI stays neu-
                                           pecially relevant in light of the fourth industrial revolution paradigm, and companies may
tral with regard to jurisdictional clai-   identify green product development as a growth opportunity [4]. That said, energy-efficient
ms in published maps and institutio-       products are an investment given that savings can offset the initial price premium on energy
nal affiliations.                          efficient options, and offer a noteworthy return in comparison to non-efficient alternatives.
                                                 Manufacturing firms are innovating their business models by integrating product-
                                           service offerings as a strategic response to market trends [5] and to generate value [6] in
                                           order to outperform global competition [7,8]. Recent studies have examined the drivers of
Copyright: © 2021 by the author. Li-
                                           servitization success [9], its role in the value proposition [10], and the relationship between
censee MDPI, Basel, Switzerland.
                                           servitization and performance [11], suggesting that behavioral and business factors are
This article is an open access article
                                           prominent factors [12].
distributed under the terms and con-
                                                 In this paper, the term performance refers to a set of factors that concur to increase
ditions of the Creative Commons At-
                                           the competitiveness of the products that firms produce; i.e., the ability of a firm to cope
tribution (CC BY) license (https://
                                           with competitors in selling its products in the reference market. Due to the complexity
creativecommons.org/licenses/by/
4.0/).
                                           of relationships between the various factors this paper examines, and given that the

J. Open Innov. Technol. Mark. Complex. 2021, 7, 33. https://doi.org/10.3390/joitmc7010033                      https://www.mdpi.com/journal/joitmc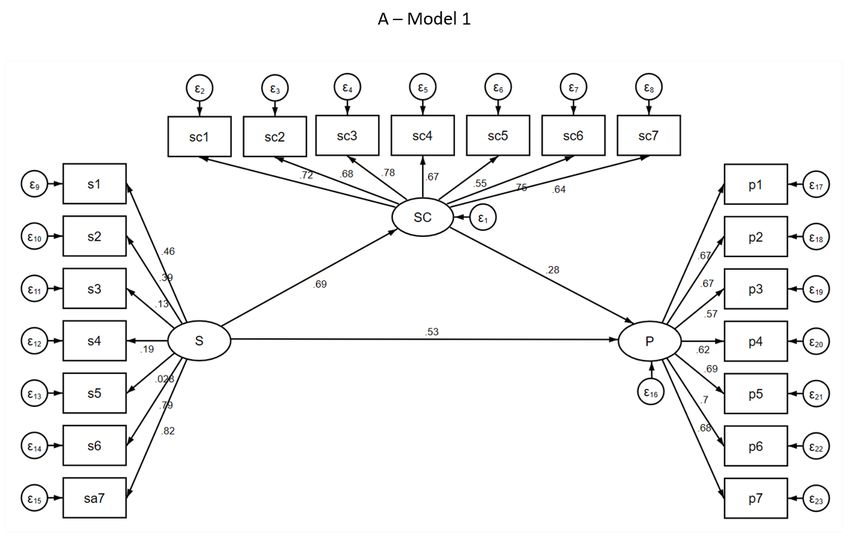
J. Open Innov. Technol. Mark. Complex. 2021, 7, 33                                                                            2 of 14

                                      analyses use empirical survey data, this performance proxy represents a fair compromise
                                      to overcome possible subjectivity biases in respondents’ answers. Similarly, “servitization”
                                      in this paper means the integration of energy-efficiency solutions into products, and serves
                                      to provide insights on the role of servitization as a mediator of performance.
                                            Since mediation involves a mediator variable intervening between two other related
                                      constructs [13], this study examines two hypotheses to test whether servitization signif-
                                      icantly mediates the relationships of both strategic analysis level and knowledge of the
                                      business regulatory framework with performance. To test these hypotheses, four constructs
                                      were designed: strategic analysis of competitive pressure (S), knowledge of the business
                                      regulatory framework (R), servitization capacity (SC), and performance assessment (P).
                                            In the first hypothesis, energy-efficiency servitization mediates the relationship be-
                                      tween strategic analysis and business performance; in the second hypothesis, energy-
                                      efficiency servitization mediates the relationship between business regulatory framework
                                      and business performance.
                                            The relationships between these constructs are formalized using a structural equation
                                      model (SEM). The analysis is based on empirical data obtained from 293 manufacturers
                                      spread across Italy. The sample comprised manufacturers of machinery and equipment,
                                      including their mechanical components; fixed and mobile or hand-held devices; special
                                      equipment for transport; products that generate, distribute, and use electrical power;
                                      electrical lighting, signaling equipment, and electric household appliances.
                                            Results suggest that the level of strategic analysis and the knowledge of the regula-
                                      tory framework influence performance by facilitating servitization, in terms of integrating
                                      energy-efficiency solutions into products. In turn, servitization capacity is found to mediate
                                      the relationships of strategic analysis level and knowledge of the regulatory framework
                                      with business performance: specifically, 73% of the effect of strategic analysis on perfor-
                                      mance and 47% of the effect of knowledge of the regulatory framework on performance is
                                      direct. Therefore, firms can improve their internal ecosystems for service development by
                                      connecting their strategy and regulatory expertise. Doing so can benefit manufacturers’
                                      organizational change processes, which have received little attention thus far [14].
                                            The transition to a low-carbon, energy-efficient economy presents an opportunity to
                                      improve the sustainability and competitiveness of manufacturing firms. In fact, energy-
                                      efficient products constitute a competitive advantage in the global market for products
                                      and services.
                                            The remainder of this paper is organized as follows. Section 2 reviews the literature,
                                      then Section 3 presents the materials and methods and explains the data collection proce-
                                      dure and sample selection approach. Section 4 reports the results, which are then discussed
                                      in Section 5. Finally, Section 6 concludes.

                                      2. Literature Review
                                            The service innovation literature has evolved into a vast field of research and develop-
                                      ment, incorporating dynamic interactions between technological and human systems that
                                      lead to management and organizational changes [15] in different types of services facing
                                      unique development, marketing, and management challenges [16]. The limited coherence
                                      in knowledge on this topic may be largely due to product innovation concepts, frameworks,
                                      and methods being applied by many early researchers to the services domain [17]. There
                                      are different types of service innovation, and a recent study identified four different ways
                                      to categorize these innovations: degree of change, type of change, newness, and means of
                                      provision [18]. In this study, product and service innovations complement each other be-
                                      cause the paper analyzes manufacturers that, in many cases, add services to their products,
                                      thereby reinforcing their core business. Doing so can strengthen firms’ core competencies
                                      in relation to their key products, creating economies of scale that lead to self-reinforcing
                                      innovation dynamics, as suggested by the path-dependency literature [19].
                                            Because innovation and its impacts on performance are often analyzed jointly, energy-
                                      efficiency services markets, which have numerous growth opportunities [20], and play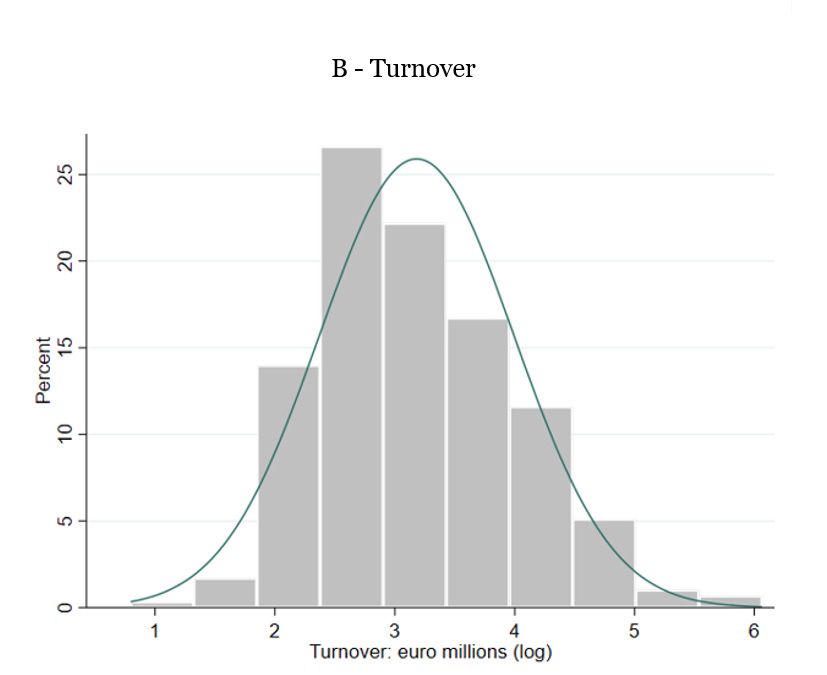
J. Open Innov. Technol. Mark. Complex. 2021, 7, 33                                                                             3 of 14

                                      a prominent role in increasingly competitive and dynamic economies. To exploit new
                                      business opportunities, firms must be able to adapt their business models; that is, their
                                      approaches to generating revenue, including their assumptions about capturing the value
                                      generated [21].
                                            Research specifically focusing on service innovation in relation to sustainability is
                                      scarce [22], especially studies on innovation in energy-efficiency services. Previous research
                                      has focused primarily on various aspects of existing or potential concepts pertaining to
                                      energy-efficiency services, while customer needs for innovative energy-efficiency services
                                      have not received sufficient attention [23]. Generally, firms that offer energy services to end
                                      users operate in multiple industries [24]. Thus, innovation in energy-efficiency services
                                      varies according to the industry and the types of services provided.
                                            Various definitions of servitization and various understandings of its value [6] have
                                      been provided. A contextual analysis of these works shows that servitization can be
                                      defined as the innovation of a manufacturer’s offerings, entailing a move from selling
                                      products to selling integrated product-service offerings. This innovation can range from
                                      introducing marginal services aimed at improving a product’s condition to integrating
                                      advanced services aimed at improving a product’s capabilities [25] and even its function
                                      and scope. The transition to integrating energy-efficiency solutions into products is com-
                                      monly assumed to proceed gradually. Nevertheless, this kind of transition also faces three
                                      barriers related to strategy, implementation, and market structure [26]. Thus, servitization
                                      entails a search process in which new services are explored and then integrated with the
                                      product. For example, digital energy-efficiency services fall into the category of general
                                      purpose technologies [27] that open new business opportunities affecting firms’ activities
                                      and, in turn, performance. The concept of performance reflects the evaluation of a set of
                                      measures of a company’s ability to achieve its objectives effectively and efficiently [28]. For
                                      companies operating in dynamic markets, it is necessary to supplement objective economic
                                      and technical indicators with subjective data that reflect the perceptions of key personnel.
                                      This study recognizes that subjectivity in performance measurement should be treated
                                      with caution, as its use is simultaneously valuable and problematic, and one may note that
                                      scholars have investigated the benefits and drawbacks of both objective and subjective
                                      measures, with results that remain debatable [29]. If well-defined, subjective indicators
                                      tend to reflect related objective information: for example, a recent study confirms a pos-
                                      itive correlation between subjective and objective business performance [30]. A careful
                                      analysis of the literature on firm performance measures revealed some recurring aspects of
                                      performance surveys [31,32].
                                            Scholars have conducted numerous studies on how competition affects innovation.
                                      Their contradictory results may be partly due to the difficulty of both finding accurate mea-
                                      sures of competition and defining the relevant market [33]. Overall, numerous empirical
                                      findings suggest that companies facing competitive pressure tend to be more innova-
                                      tive [34], and studies generally postulate that firms operating in competitive industries
                                      tend to find groundbreaking ways to perform value creation [35] and organizational
                                      learning—the process by which a firm develops new knowledge and insights from the
                                      market and its employees [36]. In line with growing interest in the relationship between
                                      strategic emphasis on business model innovation and firms’ performance [37], this study as-
                                      sumes that dealing with changes in the market creates substantial challenges for managers.
                                      Owing to the complexity of strategy formulation, managers face difficulty in analyzing
                                      all aspects of the business environment or establishing precise objectives; consequently,
                                      business strategies tend to involve small strategic adjustments [38]. To avoid strategic
                                      drift and positively affect firms’ performance, these marginal strategy adjustments should
                                      reflect and follow changes occurring in the market. This recommendation is particularly
                                      important in the energy-efficiency services sector given its vulnerability to unpredictable
                                      occurrences, such as technological innovation, regulations, or changes in energy prices,
                                      which undermine the rationality of strategic decisions [39].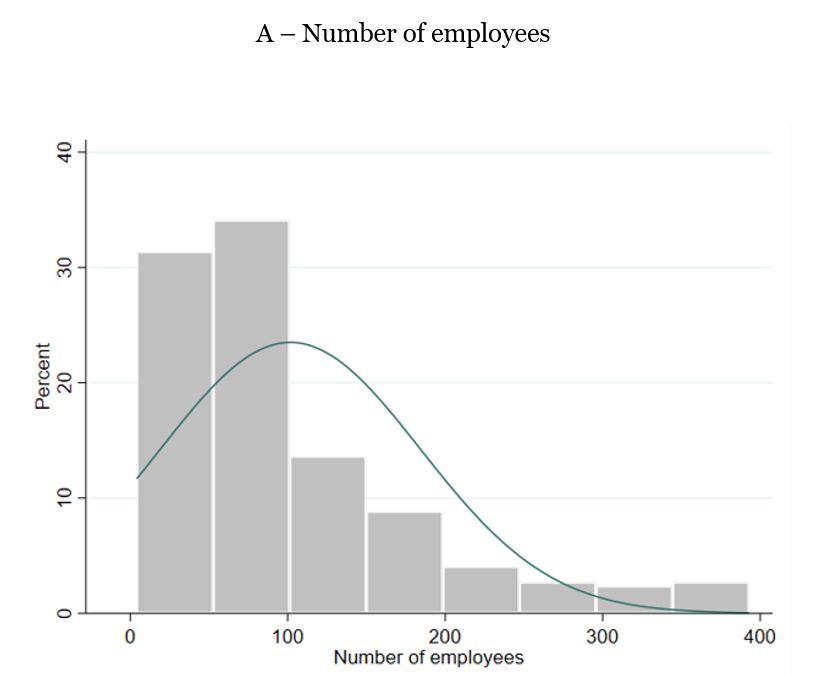
J. Open Innov. Technol. Mark. Complex. 2021, 7, 33 4 of 14
Firms’ everyday operations are ruled by regulations. When well-designed, they can
promote industry development; however, they can also be costly and ineffective. Although
regulation is often perceived as static, it undergoes constant change and reformulation
in practice [40]. Indeed, debates continue over how to harness competitive forces to
motivate firms to serve consumers’ best interests [41] and the importance of policies to
reduce barriers to innovation and increase energy efficiency [42]. This study adds to the
evidence that high-quality regulation facilitates firms’ performance by contributing to their
competitiveness [7]. Energy-efficient products reduce the energy need, keeping the same
level or even improving technical efficiency.
The relation between energy-efficient products and performance has gained impor-
tance. Although due to the lower energy requirements, these products contribute to
greening industrial processes, their development requires remarkable efforts [43] and they
may be more expensive [1] even if savings can offset the initial price premium on energy
efficient options, and offer a noteworthy return in comparison to non-efficient alternatives.
However, the relative energy efficiency of different products strongly depends on the
energy price [44]. Therefore, in designing energy-efficient products, manufacturers must
make decisions on these products’ energy-efficiency performance during the early design
stages [45].
3. Materials and Methods
3.1. Design and Hypotheses
The path diagram in Figure 1 resembles a simple SEM of the kind widely used to
assess the relationships among latent and observed variables [46]. In this idealized model,
three constructs interact: the exogenous causal influence is defined as X, the endogenous
causal influence (or mediator) corresponds to M, and the dependent variable is represented
by Y [47]. X has a partial direct effect on Y, denoted as c, and an effect on M, denoted as
a; M has an effect on Y, denoted as b. Intrinsically, M plays a dual role as the dependent
variable and an independent variable. In the models used in this study, the total effect of X
on Y comprises both a direct and an indirect effect [13]. The direct effect is the pathway
from X to Y controlling for M; the indirect effect is the pathway from X to Y through M.
The total effect measures the expected change in Y that arises owing to variation in X. The
direct effect of a variable is not mediated by other variables in the model, whereas 5indirect
J. Open Innov. Technol. Mark. Complex. 2021, 7, x FOR PEER REVIEW of 15
effects are mediated by at least one variable and can be determined by subtracting the
direct effect from the total effect.
Figure
Figure 1. 1. Research
Research framework.
framework. Source:
Source: Created
Created byby
thethe author,
author, based
based onon [13,47].
[13,47].
This
This paper
paper uses
uses thethe frameworkdepicted
framework depictedininFigure
Figure1 1totobuild
buildtwo
twomodels.
models.InInmodel
model1 1
the exogenous causal influence is the strategic analysis of competitive pressure;
the exogenous causal influence is the strategic analysis of competitive pressure; the medi- the me-
diator is servitization capacity, while the dependent variable is performance
ator is servitization capacity, while the dependent variable is performance assessment. assessment.
Similarly,ininmodel
Similarly, model2 2the
theexogenous
exogenous causal
causal influence
influence is is knowledge
knowledge ofof the
the business
business regula-
regula-
toryframework,
tory framework,while
whilethethemediator
mediatorisisservitization
servitization capacity
capacity andand the
the dependent
dependent variable
variableis
performance assessment (see Appendix A for a representation of
is performance assessment (see Appendix A for a representation of both models). both models).
This paper makes two assumptions, which are both empirically verified. First, it as-
sumes that the higher the strategic analysis level, the higher the business performance
[48]. Indeed, strategy is assumed to be relevant in explaining variations in firm profitabil-
ity and performance [49]. Second, it assumes that the higher the knowledge of the businessJ. Open Innov. Technol. Mark. Complex. 2021, 7, 33 5 of 14
This paper makes two assumptions, which are both empirically verified. First, it as-
sumes that the higher the strategic analysis level, the higher the business performance [48].
Indeed, strategy is assumed to be relevant in explaining variations in firm profitability and
performance [49]. Second, it assumes that the higher the knowledge of the business regu-
latory framework, the higher the business performance. This construct aims to appraise
the conditions set by regulatory bodies that can be considered to dynamically influence
performance [7]. These assumptions and arguments lead to the following hypotheses:
Hypothesis 1. Servitization capacity significantly mediates the relationship between strategic
analysis and performance.
Hypothesis 2. Servitization capacity significantly mediates the relationship between knowledge of
the business regulatory framework and performance.
To test these hypotheses, this paper’s research method merges quantitative and quali-
tative analyses.
3.2. Data Collection and Sample
Professionals in energy efficiency and management were surveyed to learn more about
Italian manufacturers’ perspectives on energy-efficiency services and the related trends.
The survey was designed to ensure the clarity, accuracy, order, and effectiveness of the
items [50]. Each question was answered on an ordinal (Likert) scale. The possible responses
were arranged horizontally from one to seven, anchored with consecutive integers and with
verbal labels connoting evenly spaced gradations from “strongly disagree” to “strongly
agree” or from “very low” to “very high.” The labels were symmetrical about a neutral
middle. Table 1 lists the codified survey questions.
Table 1. List of variables and key statistics.
Variable Label Min. Mean Max SD Kurtosis
sc1 Idea management and collection 1 4.478 7 1.853 1.921
sc2 Differentiation from competitors 1 5.512 7 1.604 3.489
sc3 Trade-off analysis of energy-efficiency projects 1 4.782 7 1.769 2.257
sc4 Energy-efficiency servitization financial analysis 1 4.744 7 1.832 2.074
sc5 Pricing, placing, and value analysis 1 4.945 7 1.735 2.311
sc6 Energy-efficiency service characteristics 1 4.901 7 1.637 2.325
sc7 Client integration (feedback) into service design 1 5.253 7 1.589 2.511
s1 Implementation of SWOT analysis 1 4.263 7 1.760 2.065
s2 Industry analysis and research 1 2.345 7 1.706 3.517
s3 Implementation of PEST analysis 1 5.406 7 1.622 2.771
s4 Assessment of possible strategic alternatives 1 3.713 7 1.752 2.133
s5 Analysis of substitute products 1 4.253 7 1.729 2.016
s6 Competitive strategy and advantage 1 4.034 7 1.759 2.082
s7 Market trends analysis 1 4.372 7 1.703 2.145
r1 Regulation simple to understand and practical 1 2.877 7 1.665 2.447
r2 Analysis of possible market distortions 1 2.532 7 1.602 3.120
r3 Consistency with complementary rules or policies 1 3.147 7 1.687 2.352
r4 Forecasting of regulation goals and output 1 2.700 7 1.503 3.475
r5 Regulation fairly implemented 1 3.932 7 1.610 2.145
r6 Regulation compatible with competition 1 2.106 7 1.332 3.320
r7 Cost-efficiency analysis of regulation 1 3.956 7 1.904 1.919
p1 Positioning of products 1 4.584 7 1.874 2.157
p2 Quality of offered products 1 5.003 7 1.525 2.350
p3 Product delivery operations 1 4.532 7 1.635 2.336
p4 Strengthened market share 1 4.553 7 1.569 2.429
p5 Client feedback 1 5.150 7 1.576 2.624
p6 Product attractiveness 1 4.717 7 1.604 2.520
p7 Industry knowledge 1 4.512 7 1.772 2.290J. Open Innov. Technol. Mark. Complex. 2021, 7, 33 6 of 14
The questionnaire was aimed at energy managers, energy-efficiency experts, or ded-
icated professionals within the targeted firms. In partnership with a specialized energy
business communication agency, email invitations to complete the online questionnaire
were sent to 3124 individuals in the sampling frame. The survey was accompanied by a
letter of invitation to participate, which included an explanation of the research objective.
To encourage participation in the survey, participants were offered the opportunity to
attend a workshop where the study’s main insights would be presented. During this
workshop, additional feedback from qualified experts that enriched the analyses reported
in this paper were received. The questionnaire link was opened by 784 recipients who at
least started to fill in the questionnaire and of these, a total of 293 recipients returned a
fully completed questionnaire, representing a response rate of 9.04%. The data collection
period lasted three months and started in conjunction with a wider research program in
partnership with the Italian industrial plant association. The respondents were analyzed
by Nomenclature of Economic Activities (NACE Rev. 2), a European industrial activity
classification set by Regulation (EC) 1893/2006, in Table 2.
Table 2. Sample by NACE Rev. 2 code.
NACE Freq. % NACE Rev. 2 Code
26 21 7.17 Manufacture of computer, electronic, and optical products
27 91 31.06 Manufacture of electrical equipment
28 154 52.57 Manufacture of machinery and equipment n.e.c.
35 22 7.51 Manufacture and supply: electricity, gas, steam, and air conditioning
other 5 1.71 Construction of utility projects
See Appendix B for the distribution of size and turnover.
Table 2 shows that respondents according to the NACE Rev. 2 code at two digits level.
Because 74.74% of the respondents were male, an independent t-test was performed to
check whether a sample bias emerged under the null hypothesis that the difference between
genders was non-zero. The gender group means are not statistically significantly different,
as the p-values for the four constructs are as follows: P = 0.664, SC = 0.475, S = 0.548,
R = 0.509. Noteworthy descriptive statistics of the sample composition are as follows: the
average number of employees per firm was 103, 65.81% of the sample described their firms
as “innovative” compared to the industry average, and 12.9% declared that their firms
were members of a strategic alliance or network.
The manufacturers were geographically distributed across Italian regions as follows:
Lombardy (79), Emilia-Romagna (53), Veneto (43), Piedmont (17), Lazio (15), Tuscany
(8), Sardinia (8), Apulia (6), Sicily (6), Marche (4), Campania (4), Trentino-South Tyrol (3),
Friuli-Venezia Giulia (3), Liguria (3), Abruzzo (3), Molise (3), Umbria (2), and Aosta Valley
(1). No respondents reported being based in Calabria or Basilicata; location information
was not provided by 32 manufacturers.
Given the growing motivation to improve and rising investment in energy efficiency,
the market tends to function increasingly well for companies that sell complete packages
of energy-efficiency services and for customers willing to pay to improve their energy
efficiency. This study focuses on firms that operate in quasi-pure and incremental service
areas, taking into consideration that the business models in these markets vary across
NACE Rev. 2 sectors, reflecting differences in competitive environments and regulations.
4. Results
I designed four measurement constructs to build the two SEMs used in this study with
maximum likelihood estimation. The constructs were then tested for quality and internal
consistency to ensure reliability. The Cronbach’s alpha coefficients are reported in Table 3.
Each measurement construct is based on seven observed variables, as detailed in Table 3.
The 28 total variables were also tested for internal consistency to ensure reliability. The
literature offers several different benchmarks for acceptable Cronbach’s alpha values; theJ. Open Innov. Technol. Mark. Complex. 2021, 7, 33 7 of 14
acceptability threshold is normally set at 0.70, but some studies use a threshold of 0.6 [51].
The relatively low alpha value of the strategic analysis construct may be explained by
the technical business units in which the respondents operated: respondents employed
in technical and R&D units may have been unfamiliar with the strategic management
terminology (e.g., “SWAT analysis” or “PEST analysis”) used in some questions.
Table 3. Measurement constructs.
Construct Items Cronbach’s Alpha RMSEA CFI SRMR
SC sc1, sc2, sc3, sc4, sc5, sc6, sc7 0.858 0.102 0.945 0.044
R r1, r2, r3, r4, r5, r6, r7 0.756 0.061 0.974 0.046
S s1, s2, s3, s4, s5, s6, s7 0.610 0.125 0.807 0.090
P p1, p2, p3, p4, p5, p6, p7 0.840 0.064 0.974 0.034
RMSEA: root mean square error of approximation; CFI: comparative fit index; SRMR: standardized root
mean residual.
The literature shows that firm size affects the decision to invest in innovation, with a
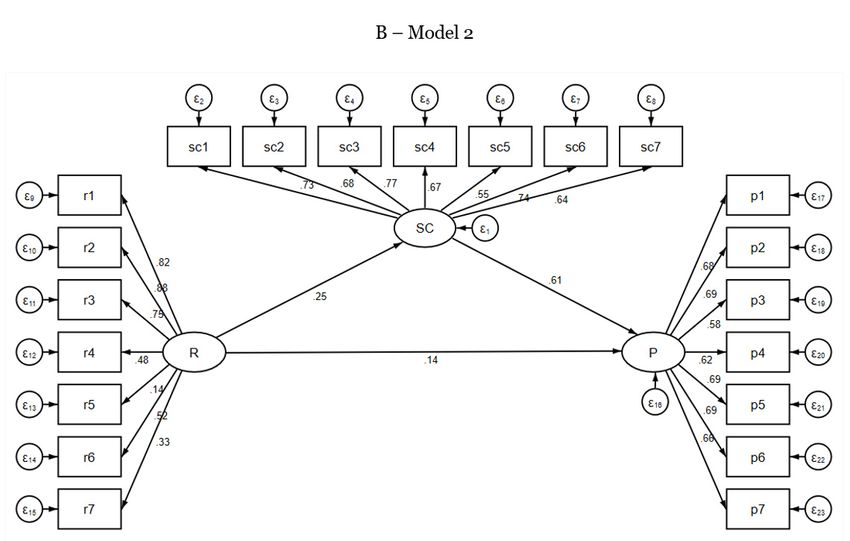
larger size increasing the likelihood of investing [52]. The models depicted in Appendix A
respectively correspond to model 1 and model 2, which contain three constructs. Two
of the constructs—those related to SC and PA—are found in both models, while one
construct varies according to the model. Model 1 incorporates the construct related to
strategic analysis of competitive pressure while model 2 incorporates the construct related
to knowledge of the regulatory framework. The models should be interpreted by noting
the unidirectional links between the component pairings.
Analysis
Table 4 presents key statistics for the two models. Based on the analysis of model 1,
I note that, consistent with Hypothesis 1, strategic analysis is positively correlated with
servitization capacity (0.693 ***). This phenomenon can be explained by the expectation that
greater market awareness facilitates an appropriate response to stimuli related to market
trends. Similarly, strategic analysis is positively correlated with business performance
(0.528 ***), although the correlation is weaker. Model 1 also shows that servitization
capacity positively affects business performance (0.277 ***), but the causal direction of this
association is beyond this study’s scope. Regarding model 2, I identify weak effects of
knowledge of the business regulatory framework on servitization capacity (0.250 ***) and
on business performance (0.135 **).
Table 4. Summary of the models.
Coefficients Std. Err. Z
SC
S 0.693 *** 0.045 15.250
Model 1 P
SC 0.277 *** 0.086 3.210
S 0.528 *** 0.084 6.260
SC
R 0.250 *** 0.063 3.950
Model 2 P
SC 0.607 *** 0.049 12.420
R 0.135 ** 0.058 2.310
Standardized coefficients. Structural components of models. ** significance level 5%, *** significance level 1%.
Table 5 summarizes the goodness of fit for both models. The root mean square error
of approximation (RMSEA) is an index of fit for which a value of zero indicates the best
fit and 0 < RMSEA < 0.1 indicates a good fit. In this respect, both models have a good
fit, with model 2 (RMSEA 0.048) achieving a better fit than model 1 (RMSEA 0.069). For
the standardized root mean residual (SRMR), a value of zero again indicates the best fit,J. Open Innov. Technol. Mark. Complex. 2021, 7, 33 8 of 14
and 0 < SRMR < 0.1 indicates a good fit. Again, both models achieve good fits, although
model 1 (SRMR 0.067) achieves a better fit than model 2 (SRMR 0.076). The comparative
fit index (CFI) compares a model’s fit with a hypothesized model. Its value ranges from
0 to 1; 1 indicates the best fit, and CFI > 0.9 indicates a good fit. The CFI value for model 1
is slightly below the desirable level of 0.9 (0.879), whereas the value for model 2 exceeds
this level (0.942), indicating a better fit.
Table 5. Goodness of fit of the models.
RMSEA AIC BIC CFI TLI SRMR
Model 1 0.069 22,130.24 22,373.13 0.879 0.864 0.067
Model 2 0.048 21,695.47 21,938.36 0.942 0.935 0.076
AIC: Akaike information criterion; BIC: Bayesian information criterion; CFI: comparative fit index; TLI: Tucker
Lewis index; SRMR: standardized root mean square residual.
I next consider the magnitudes of the direct and indirect effects of strategic analysis
and knowledge of the regulatory framework on business performance. As Table 6 shows,
the total effect of strategic analysis on business performance in model 1 equals 1.10, and
the direct effect is 0.807. These figures indicate that 73% of the effect of strategic analysis
on business performance is direct after controlling for servitization capacity, while 27%
is indirect. In model 2, the total effect of knowledge of the regulatory framework on
business performance is 0.265, and the direct effect is 0.125. Thus, 47% of the effect of
knowledge of the regulatory framework on business performance is direct after controlling
for servitization capacity, and 53% is indirect.
Table 6. Total, direct, and indirect effects in the models.
Effects Coef. Std. Err. Z
SC
S 1.125 *** 0.169 6.64
Direct P
SC 0.261 *** 0.085 3.07
S 0.807 *** 0.169 4.77
P
Model 1 Indirect
S 0.293 *** 0.102 2.86
SC
S 1.125 *** 0.169 6.64
Total P
SC 0.260 *** 0.085 3.07
S 1.100 *** 0.174 6.33
SC
R 0.246 *** 0.067 3.69
Direct P
SC 0.571 *** 0.073 7.76
R 0.125 ** 0.055 2.27
P
Model 2 Indirect
R 0.140 *** 0.040 3.47
SC
R 0.246 *** 0.067 3.69
Total P
SC 0.571 *** 0.073 7.76
R 0.266 *** 0.064 4.13
** significance level 5%, *** significance level 1%.
The results reported in Tables 4 and 6 support Hypothesis 1 (servitization capac-
ity significantly mediates the relationship between strategic analysis and performance)
and Hypothesis 2 (servitization capacity significantly mediates the relationship between
knowledge of the business regulatory framework and performance). The integration ofJ. Open Innov. Technol. Mark. Complex. 2021, 7, 33 9 of 14
product-service offerings is thus shown to be positively linked to business performance,
and the impacts of strategic analysis of competitive pressure and knowledge of the busi-
ness regulatory framework on performance are strengthened by the mediating role of
servitization capacity.
5. Discussion
Our findings confirm that knowledge of the regulatory framework is positively related
to performance and that market-oriented firms—those that continuously analyze and
understand their industries’ structures—stand out in their ability to dynamically act and
react to trends in their markets, gaining useful knowledge for anticipating and responding
to developing needs by integrating products and services.
The results provide different degrees of support for Hypotheses 1 and 2. First, the
results confirm that servitization capacity mediates the positive relationship between
strategic analysis and business performance (Hypothesis 1). Indeed, after controlling for
propensity to innovate, 73% of the total effect of strategic analysis on business performance
is direct; the remaining 27% of the total effect is indirect and mediated by servitization
capacity. Second, the results also confirm that servitization capacity mediates the positive
relationship between knowledge of the regulatory framework and business performance
(Hypothesis 2). Of the total effect of knowledge of the regulatory framework on business
performance, 47% is the direct effect after controlling for servitization capacity, while 53%
is the indirect effect, mediated by servitization capacity. The mediating role of servitization
capacity is, therefore, stronger in model 2.
Servitization capacity is likely to become a prominent success factor for businesses.
This capacity is a fundamental requirement for capturing new market opportunities.
Indeed, mandatory regulatory policies are currently supplemented by other measures
that incentivize higher energy-efficiency levels [8,53–55], including incentives to adopt
energy-management systems and share information and other resources that improve
energy-efficiency knowledge and skills. This is particularly important given that new
energy-efficiency services also contribute to decarbonizing industry, which is a sustainable
development goal.
Considering that there is public pressure on firms to be responsible for the environ-
ment, and customers tend to favor businesses with a greening strategy, many firms are
succeeding in reducing their carbon footprint and make sure they are energy efficient.
Indeed, the world is becoming more environmentally conscious and energy-efficient prod-
ucts can improve firms’ reputations, which in turn can improve performance. Many firms
are releasing reports showing their environmental practices in light of the fact that focusing
on energy efficiency gives companies a competitive edge when it comes to branding and
marketing. Being a company that sells energy-efficient products means being innovative for
potential employees and your customers, and as previously stated, innovation is important
for firms.
Because the study’s findings are based on a limited sample, they should be treated
with caution. The first limitation is that using survey responses entails an unavoidable
degree of subjectivity. Second, the study is based on cross-sectional data that do not allow
causal inferences across time. Third, respondents may have considered a wide range of
meanings for servitization, including alternative interpretations to that used in this paper.
Nonetheless, this study advances current knowledge by providing insights to better un-
derstand how servitization capacity can create more value by enabling the transition from
sales of products to sales of product-service systems, combining manufactured products
with the provision of evolutionary maintenance and other services.
6. Conclusions
Since markets are becoming more environmentally conscious, energy-efficient prod-
ucts can enhance manufacturing firms’ performance. This paper investigated how integrat-
ing energy-efficiency solutions into products influences business performance, based onJ. Open Innov. Technol. Mark. Complex. 2021, 7, 33 10 of 14
empirical data from a sample of manufacturers, primarily of electrical equipment and of
machinery and equipment. Two models were developed to improve understanding of the
mediating role of energy-efficiency solutions integrated into products: the first based on
strategic analysis of the competitive structure, and the second based on knowledge of the
regulatory framework.
The analyses results confirm that strategic analysis and knowledge of the regula-
tory framework are positively related to performance. Specifically, both the level of
strategic analysis and knowledge of the regulatory framework facilitate the process of
product-service integration and, in turn, positively influence business performance. Energy-
efficiency solutions integrated into products are found to mediate these two relationships,
as 27% of the effect of strategic analysis on performance and 53% of the effect of knowledge
of the regulatory framework on business performance is indirect via servitization capacity.
The integration of product-service offerings is thus shown to be positively linked to
business performance, and the impacts of strategic analysis of competitive pressure and
knowledge of the business regulatory framework on performance are strengthened by
the mediating role of servitization capacity. Overall, performance is influenced by how
these innovations affect companies’ abilities to effectively adapt their operations to sector
regulations and to analyze the industries in which they operate.
Business implications are straightforward since the transition to a low-carbon econ-
omy presents an opportunity to enhance the sustainability and competitiveness of manu-
facturing firms. The integration of energy-efficiency solutions into products by mean of
servitization is now a key factor for business performance. So the transition to a low-carbon,
energy-efficient economy provides opportunities for manufacturing firms to improve their
sustainability and competitiveness. In fact, energy-efficient products can constitute a com-
petitive advantage in global markets for products and related services. So manufacturing
firms can give an important boost to energy-efficiency innovation and simultaneously offer
fundamental resources for society and the environment. Policy implications are clear, too,
when it comes to commitment to limiting global warming. Policy-makers must help firms to
modernize industrial processes and exploit energy-efficient product opportunities by stim-
ulating the development of new markets for efficient products by mean of financial support
and regulatory frameworks aimed at steering the transition to a decarbonized economy.
Funding: This research received no external funding.
Institutional Review Board Statement: Not applicable.
Informed Consent Statement: Not applicable.
Data Availability Statement: Data available in a publicly accessible repository.
Conflicts of Interest: The authors declare no conflict of interest.J. Open Innov. Technol. Mark. Complex. 2021, 7, 33 11 of 14
J. Open Innov. Technol. Mark. Complex. 2021, 7, x FOR PEER REVIEW 12 of 15
Appendix A
Appendix A
Figure
FigureA1.
A1.Representations
Representationsof
ofModel
Model11and
and Model
Model 2.
2.J. Open Innov. Technol. Mark. Complex. 2021, 7, 33 12 of 14
J. Open Innov. Technol. Mark. Complex. 2021, 7, x FOR PEER REVIEW 13 of 15
Appendix
Appendix BB
Figure A2.A2.
Figure Size of of
Size Firms and
Firms Turnover
and in in
Turnover thethe
Sample.
Sample.
References
1. Zhang, Y.; Xiao, C.; Zhou, G. Willingness to pay a price premium for energy-saving appliances: Role of perceived value and
energy efficiency labeling. J. Clean. Prod. 2020, 242, 118555.J. Open Innov. Technol. Mark. Complex. 2021, 7, 33 13 of 14
References
1. Zhang, Y.; Xiao, C.; Zhou, G. Willingness to pay a price premium for energy-saving appliances: Role of perceived value and
energy efficiency labeling. J. Clean. Prod. 2020, 242, 118555. [CrossRef]
2. Jovanovic, M.; Raja, J.Z.; Visnjic, I.; Wiengarten, F. Paths to service capability development for servitization: Examining an internal
service ecosystem. J. Bus. Res. 2019, 104, 472–485. [CrossRef]
3. Shah, S.A.A.; Jajja, M.S.S.; Chatha, K.A.; Farooq, S. Servitization and supply chain integration: An empirical analysis. Int. J. Prod.
Econ. 2020, 229, 107765. [CrossRef]
4. Thurner, T.W.; Roud, V. Greening strategies in Russia’s manufacturing—From compliance to opportunity. J. Clean. Prod. 2016,
112, 2851–2860. [CrossRef]
5. Lightfoot, H.; Baines, T.; Smart, P. The servitization of manufacturing. Int. J. Oper. Prod. Manag. 2009, 20, 547–567. [CrossRef]
6. Garcia Martin, P.C.; Schroeder, A.; Ziaee Bigdeli, A. The value architecture of servitization: Expanding the research scope. J. Bus.
Res. 2019, 104, 438–449. [CrossRef]
7. Kitching, J.; Hart, M.; Wilson, N. Burden or benefit? Regulation as a dynamic influence on small business performance. Int. Small
Bus. J. Res. Entrep. 2015, 33, 130–147. [CrossRef]
8. Cambini, C.; Meletiou, A.; Bompard, E.; Masera, M. Market and regulatory factors influencing smart-grid investment in Europe:
Evidence from pilot projects and implications for reform. Util. Policy 2016, 40, 36–47. [CrossRef]
9. Fliess, S.; Lexutt, E. How to be successful with servitization—Guidelines for research and management. Ind. Mark. Manag. 2019,
78, 58–75. [CrossRef]
10. Annarelli, A.; Battistella, C.; Nonino, F. Competitive advantage implication of different Product Service System business models:
Consequences of ‘not-replicable’ capabilities. J. Clean. Prod. 2020, 247, 119121. [CrossRef]
11. Wang, W.; Lai, K.; Shou, Y. The impact of servitization on firm performance: A meta-analysis. Int. J. Oper. Prod. Manag. 2018, 38,
1562–1588. [CrossRef]
12. Goldbach, K.; Rotaru, A.M.; Reichert, S.; Stiff, G.; Gölz, S. Which digital energy services improve energy efficiency? A multi-criteria
investigation with European experts. Energy Policy 2018, 115, 239–248. [CrossRef]
13. Wu, A.D.; Zumbo, B.D. Understanding and using mediators and moderators. Soc. Indic. Res. 2008, 87, 367–392. [CrossRef]
14. Baines, T.; Ziaee Bigdeli, A.; Sousa, R.; Schroeder, A. Framing the servitization transformation process: A model to understand
and facilitate the servitization journey. Int. J. Prod. Econ. 2020, 221, 107463. [CrossRef]
15. Randhawa, K.; Scerri, M. Service Innovation: A Review of the Literature. In The Handbook of Service Innovation; Agarwal, R.,
Selen, W., Roos, G., Green, R., Eds.; Springer: London, UK, 2015; pp. 27–51.
16. Jaakkola, E.; Meiren, T.; Witell, L.; Edvardsson, B.; Schäfer, A.; Reynoso, J.; Sebastiani, R.; Weitlaner, D. Does one size fit all? New
service development across different types of services. J. Serv. Manag. 2017, 28, 329–347. [CrossRef]
17. Biemans, W.G.; Griffin, A.; Moenaert, R.K. Perspective: New Service Development: How the Field Developed, Its Current Status
and Recommendations for Moving the Field Forward. J. Prod. Innov. Manag. 2016, 33, 382–397. [CrossRef]
18. Snyder, H.; Witell, L.; Gustafsson, A.; Fombelle, P.; Kristensson, P. Identifying categories of service innovation: A review and
synthesis of the literature. J. Bus. Res. 2016, 69, 2401–2408. [CrossRef]
19. Thrane, S.; Blaabjerg, S.; Møller, R.H. Innovative path dependence: Making sense of product and service innovation in path
dependent innovation processes. Res. Policy 2010, 39, 932–944. [CrossRef]
20. Ferraz, I.N.; de Melo Santos, N. The relationship between service innovation and performance: A bibliometric analysis and
research agenda proposal. RAI Rev. Adm. Inovação 2016, 13, 251–260. [CrossRef]
21. Gambardella, A.; McGahan, A.M. Business-model innovation: General purpose technologies and their implications for industry
structure. Long Range Plan. 2010, 43, 262–271. [CrossRef]
22. Calabrese, A.; Castaldi, C.; Forte, G.; Ghiron, N. Sustainability-oriented service innovation: An emerging research field. J. Clean.
Prod. 2018, 193, 533–548. [CrossRef]
23. Anttonen, M.; Halme, M.; Houtbeckers, E.; Nurkka, J. The other side of sustainable innovation: Is there a demand for innovative
services? J. Clean. Prod. 2013, 45, 89–103. [CrossRef]
24. Bertoldi, P.; Boza-Kiss, B.; Panev, S.; Labanca, N. ESCO Market Report 2013; European Union: Ispra, Italy, 2014. Available
online: https://ec.europa.eu/jrc/en/publication/eur-scientific-and-technical-research-reports/european-esco-market-report-
2013 (accessed on 31 December 2020).
25. Baines, T.; Bigdeli, A.Z.; Shi, V.G.; Baldwin, J.; Ridgway, K. Servitization: Revisiting the state-of-the-art and research priorities. Int.
J. Oper. Prod. Manag. 2017, 37, 256–278. [CrossRef]
26. Lütjen, H.; Tietze, F.; Schultz, C. Service transitions of product-centric firms: An explorative study of service transition stages and
barriers in Germany’ s energy market. Int. J. Prod. Econ. 2017, 192, 106–119. [CrossRef]
27. Björkdahl, J. Technology cross-fertilization and the business model: The case of integrating ICTs in mechanical engineering
products. Res. Policy 2009, 38, 1468–1477. [CrossRef]
28. Di Foggia, G.; Beccarello, M. Improving efficiency in the MSW collection and disposal service combining price cap and yardstick
regulation: The Italian case. Waste Manag. 2018, 79, 223–231. [CrossRef]
29. Demartini, M.C.; Trucco, S. Fad and fashion? The relevance of subjective performance measures. Manag. Decis. 2018, 56,
2391–2407. [CrossRef]J. Open Innov. Technol. Mark. Complex. 2021, 7, 33 14 of 14
30. Vij, S.; Bedi, H. Are subjective business performance measures justified? Int. J. Product. Perform. Manag. 2016, 65, 603–621.
[CrossRef]
31. Crescenzi, R.; Gagliardi, L. The innovative performance of firms in heterogeneous environments: The interplay between external
knowledge and internal absorptive capacities. Res. Policy 2018, 47, 782–795. [CrossRef]
32. Cagno, E.; Micheli, G.J.L.; Di Foggia, G. Smart metering projects: An interpretive framework for successful implementation. Int. J.
Energy Sect. Manag. 2018, 12, 244–264. [CrossRef]
33. Beneito, P.; Coscollá-Girona, P.; Rochina-Barrachina, M.E.; Sanchis, A. Competitive pressure and innovation at the firm level. J.
Ind. Econ. 2015, 63, 422–457. [CrossRef]
34. Salavou, H.; Baltas, G.; Lioukas, S. Organisational innovation in SMEs. Eur. J. Mark. 2004, 38, 1091–1112. [CrossRef]
35. Weerawardena, J.; O’Cass, A.; Julian, C. Does industry matter? Examining the role of industry structure and organizational
learning in innovation and brand performance. J. Bus. Res. 2006, 59, 37–45. [CrossRef]
36. Jiménez-Jiménez, D.; Sanz-Valle, R. Innovation, organizational learning, and performance. J. Bus. Res. 2011, 64, 408–417.
[CrossRef]
37. Lambert, S.C.; Davidson, R.A. Applications of the business model in studies of enterprise success, innovation and classification:
An analysis of empirical research from 1996 to 2010. Eur. Manag. J. 2013, 31, 668–681. [CrossRef]
38. Dwyer, L.; Edwards, D. Tourism product and service innovation to avoid “strategic drift”. Int. J. Tour. Res. 2009, 11, 321–335.
[CrossRef]
39. Di Foggia, G. Effectiveness of Energy Efficiency Certificates as Drivers for Industrial Energy Efficiency Projects. Int. J. Energy
Econ. Policy 2016, 6, 273–280.
40. Bach, T.; Niklasson, B.; Painter, M. The role of agencies in policy-making. Policy Soc. 2012, 31, 183–193. [CrossRef]
41. Sappington, D.E.M.; Weisman, D.L. Regulating regulators in transitionally competitive markets. J. Regul. Econ. 2012, 41, 19–40.
[CrossRef]
42. Ruby, T.M. Innovation-enabling policy and regime transformation towards increased energy efficiency: The case of the circulator
pump industry in Europe. J. Clean. Prod. 2015, 103, 574–585. [CrossRef]
43. Zhang, Y.; Huang, T.; Yang, D. Impact of firms’ energy-saving effort and fixed asset characteristics on energy savings. J. Clean.
Prod. 2020, 268, 122182. [CrossRef]
44. Ahmed, R.; Stater, M. Is energy efficiency underprovided? An analysis of the provision of energy efficiency in multi-attribute
products. Resour. Energy Econ. 2017, 49, 132–149. [CrossRef]
45. Li, L.; Yu, S.; Tao, J. Design for energy efficiency in early stages: A top-down method for new product development. J. Clean. Prod.
2019, 224, 175–187. [CrossRef]
46. Henseler, J.; Chin, W.W. A comparison of approaches for the analysis of interaction effects between latent variables using partial
least squares path modeling. Struct. Equ. Model. 2010, 17, 82–109. [CrossRef]
47. Little, T.D.; Card, N.A.; Bovaird, J.A.; Preacher, K.J.; Crandall, C.S. Structural Equation Modeling of Mediation and Moderation
With Contextual Factors. In Modeling Contextual Effects in Longitudinal Studies; Little, T.D., Card, N.A., Bovaird, J.A., Eds.; Taylor &
Francis: Abingdon, UK, 2007.
48. Giones, F.; Brem, A.; Berger, A. Strategic decisions in turbulent times: Lessons from the energy industry. Bus. Horiz. 2019, 62,
215–225. [CrossRef]
49. Teeratansirikool, L.; Siengthai, S.; Badir, Y.; Charoenngam, C. Competitive strategies and firm performance: The mediating role of
performance measurement. Int. J. Product. Perform. Manag. 2013, 62, 168–184. [CrossRef]
50. Brace, I. Questionnaire Design; Kogan Page: London, UK, 2004.
51. Taber, K.S. The Use of Cronbach’s AlphaWhen Developing and Reporting Research Instruments in Science Education. Res. Sci.
Educ. 2016, 48, 1273–1296. [CrossRef]
52. Costa-Campi, M.T.; Duch-Brown, N.; García-Quevedo, J. R&D drivers and obstacles to innovation in the energy industry. Energy
Econ. 2014, 46, 20–30. [CrossRef]
53. Pirard, R.; Lapeyre, R. Classifying market-based instruments for ecosystem services: A guide to the literature jungle. Ecosyst. Serv.
2014, 9, 106–114. [CrossRef]
54. Backlund, S.; Eidenskog, M. Energy service collaborations-it is a question of trust. Energy Effic. 2013, 6, 511–521. [CrossRef]
55. Yan, S. The economic and environmental impacts of tax incentives for battery electric vehicles in Europe. Energy Policy 2018, 123,
53–63. [CrossRef]You can also read