Energy-intensive industries - Europa EU
←
→
Page content transcription
If your browser does not render page correctly, please read the page content below
STUDY
Requested by the ITRE committee
  PI

                   Energy-intensive
                      industries
                  Challenges and opportunities
                       in energy transition

          Policy Department for Economic, Scientific and Quality of Life Policies
                         Directorate-General for Internal Policies
             Authors: Sander de BRUYN, Chris JONGSMA, Bettina KAMPMAN,
                          Benjamin GÖRLACH and Jan-Erik THIE
                                 PE 652.717–July 2020
                                                                                    EN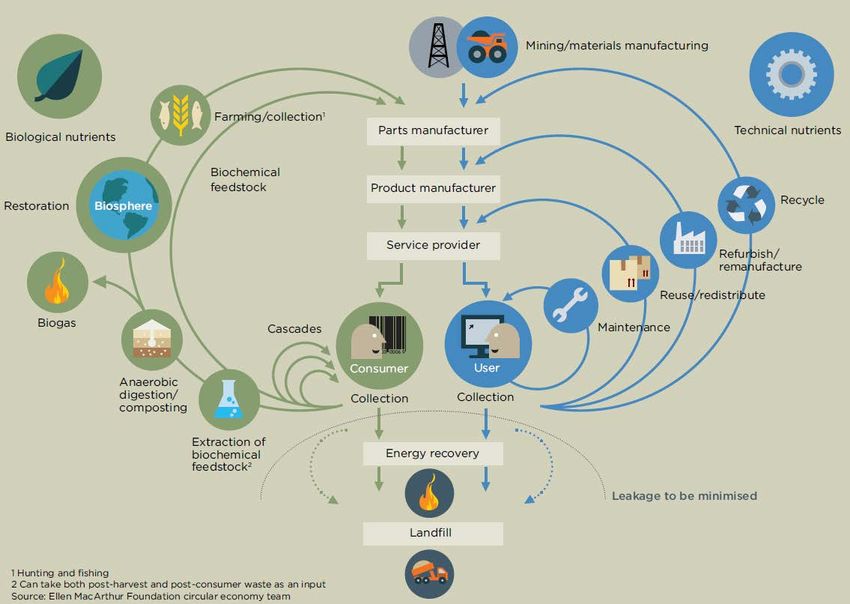
Energy-intensive
      industries
   Challenges and opportunities
        in energy transition

Abstract
Energy-intensive industries need to reach climate neutrality by
2050. This study describes the technologies available for the
decarbonisation of the iron and steel, chemicals, refining and
cement industries as well as the existing financial instruments.
Technology and policy roadmaps are presented to help shape
the Green Deal and enhance the transition to a climate neutral
European industry.
This study was provided by the Policy Department for Economic,
Scientific and Quality of Life Policies at the request of the
committee on Industry, Research and Energy (ITRE).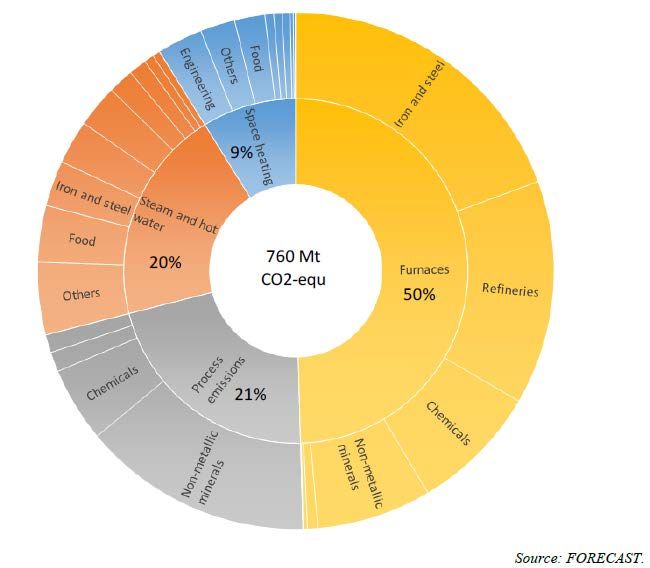
This document was requested by the European Parliament's committee on Industry, Research and
Energy (ITRE).

AUTHORS
Sander de BRUYN, CE Delft
Chris JONGSMA, CE Delft
Bettina KAMPMAN, CE Delft
Benjamin GÖRLACH, Ecologic
Jan-Erik THIE, Ecologic

ADMINISTRATORS RESPONSIBLE
Frédéric GOUARDÈRES
Matteo CIUCCI

EDITORIAL ASSISTANT
Catherine NAAS

LINGUISTIC VERSIONS
Original: EN

ABOUT THE EDITOR
Policy departments provide in-house and external expertise to support EP committees and other
parliamentary bodies in shaping legislation and exercising democratic scrutiny over EU internal
policies.

To contact the Policy Department or to subscribe for updates, please write to:
Policy Department for Economic, Scientific and Quality of Life Policies
European Parliament
L-2929 - Luxembourg
Email: Poldep-Economy-Science@ep.europa.eu

Manuscript completed: May 2020
Date of publication: July 2020
© European Union, 2020

This document is available on the internet at:
http://www.europarl.europa.eu/supporting-analyses

DISCLAIMER AND COPYRIGHT
The opinions expressed in this document are the sole responsibility of the authors and do not
necessarily represent the official position of the European Parliament.
Reproduction and translation for non-commercial purposes are authorised, provided the source is
acknowledged and the European Parliament is given prior notice and sent a copy.
For citation purposes, the study should be referenced as: de Bruyn et al., S, Energy-intensive industries –
Challenges and opportunities in energy transition, study for the committee on Industry, Research and
Energy (ITRE), Policy Department for Economic, Scientific and Quality of Life Policies, European
Parliament, Luxembourg, 2020. © Cover image used under licence from Adobe Stock
Energy-intensive industries - Challenges and opportunities in energy transition

CONTENTS
LIST OF ABBREVIATIONS                                                                                       5
LIST OF FIGURES                                                                                             7
LIST OF TABLES                                                                                              7
1.   INTRODUCTION                                                                                         11
     1.1. Background                                                                                       11
     1.2. Aim of the study                                                                                 11
           1.2.1.   Role of technology                                                                     12
           1.2.2.   Role of finance                                                                        12
           1.2.3.   Role of business                                                                       12
     1.3. Delineation                                                                                      12
     1.4. Reading guide                                                                                    14
2.   STATE OF PLAY OF THE ENERGY-INTENSIVE INDUSTRIES IN EUROPE                                           15
     2.1. Introduction                                                                                     15
     2.2. CO2 emissions and climate policy context for energy-intensive industries                         15
           2.2.1.   CO2 emissions                                                                          15
           2.2.2.   Present regulation                                                                     16
           2.2.3.   Future climate policy context                                                          18
           2.2.4.   High level group                                                                       20
           2.2.5.   European Parliament                                                                    20
           2.2.6.   Timelines European policies                                                            20
     2.3. Impacts on competitiveness                                                                       22
           2.3.1.   Present situation with respect to competitiveness                                      22
           2.3.2.   Present situation with respect to carbon leakage                                       23
     2.4. Discussion and conclusions                                                                       25
3.   AVAILABLE TECHNOLOGIES FOR ENERGY-INTENSIVE INDUSTRIES IN 2050                                       26
     3.1. Introduction                                                                                     26
     3.2. Approach in identification of key technologies                                                   26
     3.3. Overview of main technologies                                                                    28
           3.3.1.   Energy efficiency                                                                      28
           3.3.2.   Technologies dealing with electrification                                              28
           3.3.3.   Technologies for deep geothermal energy                                                29
           3.3.4.   Technologies using biomass                                                             29
           3.3.5.   Technologies using hydrogen                                                            30
           3.3.6.   Technologies for Carbon Capture, Utilisation and Storage (CCUS)                        30

                                                    3                                             PE 652.717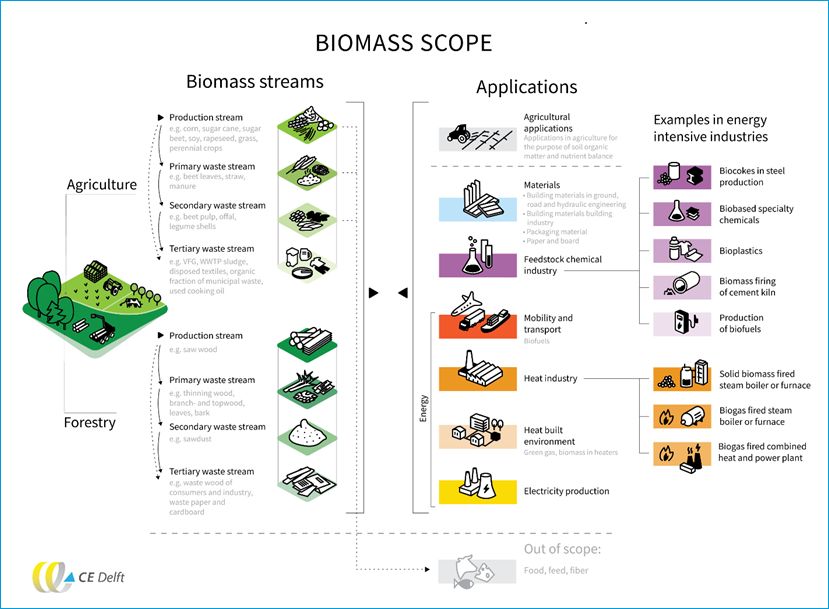
IPOL | Policy Department for Economic, Scientific and Quality of Life Policies

             3.3.7.   Technologies dealing with process intensification (PI)     32
             3.3.8.   Technologies concerning the circular economy               33
     3.4. Application of technologies in energy-intensive industries             34
             3.4.1.   Available technologies                                     34
             3.4.2.   Barriers to implementation                                 36
             3.4.3.   Alternatives routes                                        37
     3.5. Interpretation and conclusions                                         38
4.   REVIEW OF EXISTING FINANCIAL INSTRUMENTS                                    40
     4.1. Introduction                                                           40
     4.2. Price instruments                                                      40
     4.3. Funding and investment instruments                                     41
             4.3.1.   Existing instruments                                       41
             4.3.2.   Analysis                                                   43
5.   POLICY RECOMMENDATIONS                                                      45
     5.1. Introduction                                                           45
     5.2. Policy instruments                                                     46
             5.2.1.   Regulatory instruments and standardisation                 46
             5.2.2.   Pricing instruments                                        47
             5.2.3.   Subsidy instruments                                        50
     5.3. Policy roadmaps                                                        51
             5.3.1.   Technology roadmap for industry                            51
             5.3.2.   Investment roadmap for public and private sectors          55
             5.3.3.   Carbon pricing and costs roadmap                           56
6.   CONCLUSIONS                                                                 60
REFERENCES                                                                       64
ANNEX A.         EXTENSIVE OVERVIEW OF TECHNOLOGIES                              67
ANNEX B.         EXTENSIVE OVERVIEW OF FUNDING MECHANISMS                        82

PE 652.717                                             4
Energy-intensive industries - Challenges and opportunities in energy transition

LIST OF ABBREVIATIONS
BTA       Border Tax Adjustment

CAPEX     Capital Expenses

CCS       Carbon Capture and Storage

CCU       Carbon Capture, Utilisation

CCUS      Carbon Capture, Utilisation and Storage

COSME     EU programme for the Competitiveness of Enterprises and SMEs

CO2       Carbon Dioxide

DRI       Direct Reduced Iron

EAF       Electric Arc Furnace

EFSI      European Fund for Strategic Investments

EGD       European Green Deal

EGDIP     European Green Deal Investment Plan

EII       Energy-intensive Industries

EEII      European Energy-intensive Industries

ESIF      European Structural and Investment Funds

EU ETS    European Union Emission Trading System

EUTL      European Transaction Log

GATT      General Agreement on Tariffs and Trade

GHG       Greenhouse Gases

HLG EII   High-Level Group on Energy-Intensive Industries

H2020     Horizon 2020 programme

LCA       Life Cycle Assessment

MRV       Measurement, Reporting and Verification

                                           5                                             PE 652.717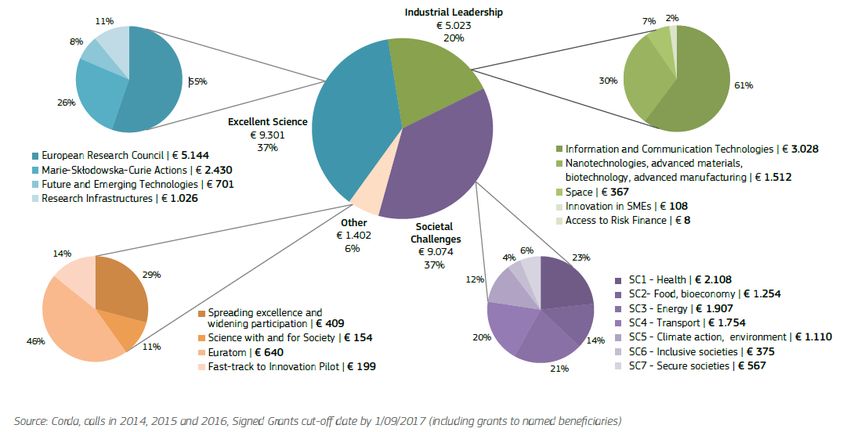
IPOL | Policy Department for Economic, Scientific and Quality of Life Policies

 N2O               Nitrous Oxide

 OPEX              Operational Expenses

 PI                Process Intensification

 SME               Small and Medium-sized Enterprise

 TRL               Technology Readiness Level

 UNFCCC            United Nations Framework Convention on Climate Change

 WTO               World Trade Organisation

PE 652.717                                             6
Energy-intensive industries - Challenges and opportunities in energy transition
LIST OF FIGURES
Figure 1: Share of CO2 emissions in the total industrial CO2 emissions in the EU ETS in 2018 13
Figure 2: CO2 emissions of four core industrial sectors from 1990 until 2017, EU28 15
Figure 3: Estimated direct emissions of industry in Europe by end use and sub-sector, note the large
share of heat-related emissions 16
Figure 4: CO2 emissions in the EU ETS from the energy-intensive industries, EU27, 2008-2018 17
Figure 5: Percentage of free allowances compared to verified emissions of the energy-intensive
industries in the EU ETS, EU27 data, 2008-2018 18
Figure 6: Share of value of exports and imports in the production value of 9 sectors
(2008 and 2018) 23
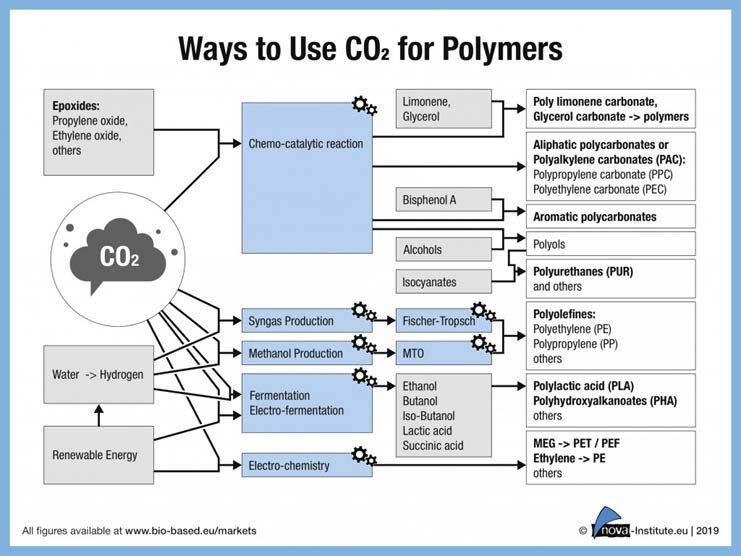
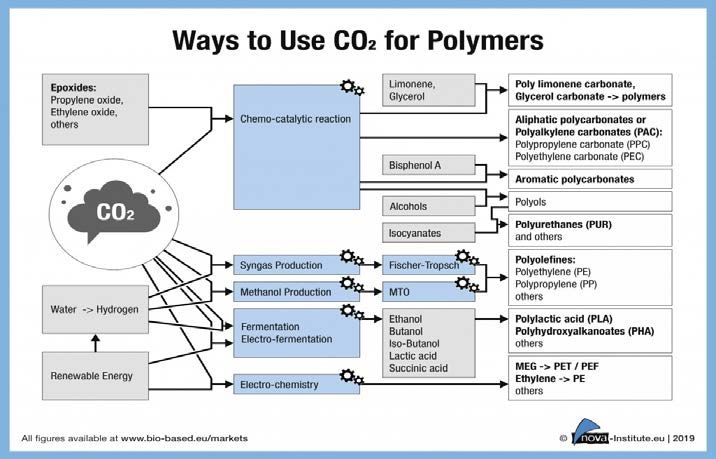
Figure 7: Schematic overview of potential pathways to use CO2 for the production of polymers 31
Figure 8: Graphical representation of the circular economy 33
Figure 9: Price development spot market in the EU ETS, 2008-2020, in €/tCO2 (current prices) 41
Figure 10: Overview of funding instruments and their area of application within the technology
cycle 43
Figure 11: Overview of the core elements of a technology roadmap for industry 52
Figure 12: Carbon pricing roadmap 58
Figure 13: Enablers and technology pathways 62
Figure 14: Biomass streams and applications 71
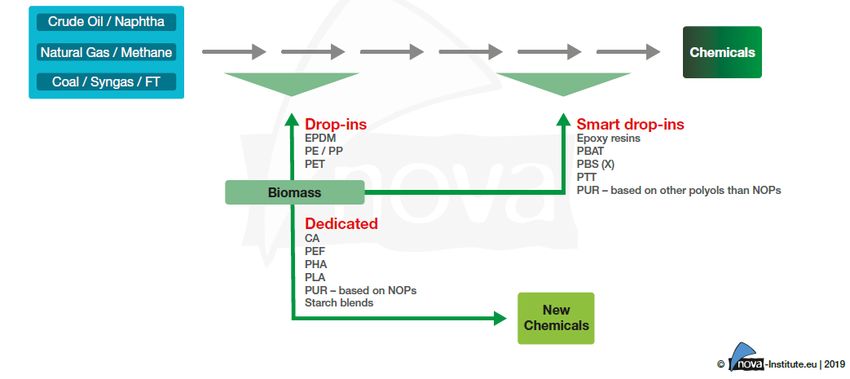
Figure 15: Schematic differentiation of pathways of drop-in, smart drop-in and dedicated
bio-based chemicals 72
Figure 16: Schematic overview of potential pathways to use CO 2 for the production of polymers 76
Figure 17: Graphical representation of the circular economy 79
Figure 18: Share of Investments across Sectors as of 05/02/2020 83
Figure 19: Total ESIF Budget by Theme (in billion EUR) 86
Figure 20: Share of Horizon 2020 funds across types of organisations 87
Figure 21: EU Contribution to signed grants per programme part (EUR million) in 2014-2016 88
LIST OF TABLES
Table 1 : Key policy documents to be published by the EC the upcoming years 21
Table 2: Examples of available technologies for the energy-intensive industries 35
Table 3: Estimated share of energy costs (excluding feedstocks) in 2017 in the EU27 38
Table 4: Overview of existing funding mechanisms for energy-intensive industries 42
Table 5: Technology roadmap for each sector, based on sector roadmaps and expert judgment.
Measures stated with (CE) refer to circular economy techniques 54
Table 6: Estimated cost of electrification routes for three core products 69
Table 7: Estimated cost of CCS for three core products 77
7 PE 652.717
IPOL | Policy Department for Economic, Scientific and Quality of Life Policies

EXECUTIVE SUMMARY
Introduction and background
In March 2020 the European Commission presented its proposal for “A New Industrial Strategy for
Europe”. This document underpins the important role of industry in the transformation towards a
carbon-neutral economy. Industry has to reduce their own carbon footprints and at the same time
accelerate the transition by providing affordable, clean technology solutions. These efforts should be
supported by policies and financial instruments at EU and national level, as well as by the private sector.
Energy-intensive industries (EII) deserve special interest as their large carbon footprints make their
transformation towards a carbon-neutral form of production challenging. This study explores how EU
energy-intensive industries can transition to a climate-neutral economy while maintaining, and ideally
improving, its global competitiveness.

Competitiveness of energy-intensive industries is a challenge
Unequal carbon costs have long been considered as harming the global competitiveness of European
EII, resulting in carbon leakage. So far, however, EII have not shown signs of deteriorating
competitiveness as a result of carbon costs. At the same time, they have not yet increased their energy
productivity in a way that they could absorb rising energy and carbon prices in the future. In the longer
run, however, we expect that more and more countries will introduce carbon pricing or other,
comparable climate policies. Competitiveness in a decarbonising global economy will then primarily
be determined by the capacity to deliver products with drastically reduced emissions. Shielding EIIs
from higher carbon costs may therefore only be a short-term fix and may risk leading them into a lock-
in. A more long-term oriented policy framework should build up or extend leadership in the area of
low-carbon industrial technologies.

The required CO2 reduction technologies are in most cases mature technologies
There is a range of technologies available that can guide Europe’s EIIs towards carbon neutrality by
2050. These can be divided into those that
    •   reduce the CO2 emissions of current processes: energy efficiency, carbon capture and storage
        (CCS);
    •   replace fossil fuels for production: by electrification, biomass, low-carbon hydrogen or other
        synthetic fuels; or
    •   develop new production pathways with a lower CO2 footprint: carbon capture and utilisation
        (CCU), process intensification and circular economy.

All these technologies are mature, but high upfront capital costs and higher operational costs create
an effective barrier to their uptake.

PE 652.717                                             8
Energy-intensive industries - Challenges and opportunities in energy transition
CO2 reduction technologies are more costly but the impact on competitiveness is limited
Carbon-neutral energy is often 2 or 3 times more expensive than fossil-sourced energy. There are
cheaper options such as energy savings or CCS at concentrated sources and innovation may still bring
down these costs. But even if energy costs of industry were to double, the carbon neutral economy
would only result in price increases of 2-11% in the most energy-intensive sectors such as refineries,
cement, fertilizers and iron and steel. As companies have 30 years to adjust to these price increases, it
is not likely that this would wipe out the European base of energy-intensive industries.
Missing infrastructure and regulatory framework are major hurdles
Successful uptake of these technologies is therefore dependent on other factors that to some extent
lay outside the scope of influence of individual companies. Governments should assist in establishing
rules for sustainable biomass use and providing plenty of renewable electricity sources to satisfy
growing demand in industry. In addition, many of the technologies require substantial investments in
infrastructure for electricity, hydrogen and CO2 networks. Such infrastructure is often beyond the scope
of individual companies and therefore needs to be accompanied by government support for the
construction and operation of such networks.
Existing financial instruments fall short of the objectives
The present policy mix in the EU uses regulation, price instruments and subsidies. The EU Emissions
Trading System (EU ETS) is the main policy instrument that puts a price on CO2 emissions for the EIIs.
Even though prices have increased in the last two years, they are still a factor 4 below what could be
considered as an efficient price path towards carbon neutrality in 2050 (if the EU ETS were the only
instrument guiding the transition). Such high carbon prices, however, could have serious adverse
impacts on the competitiveness and financial viability of EIIs.
Support for low carbon investments can bring down these costs. Currently, there are many funding
and support instruments available for energy-intensive industries such as Horizon 2020, the European
Fund for Strategic Investments (EFSI), Programme for Competitiveness of Enterprises and Small and
Medium-sized Enterprises (COSME), European Structural and Investment Funds (ESIF), Just Transition
Fund and the Innovation Fund following from the EU ETS. However, even though these funds can
generate billions of Euros support annually for the EIIs, the investment needs are much larger.
The expected wave of investment support has to promote low-carbon investments
Over the coming months, governments across Europe are expected to launch stimulus packages to
revive their economy and to restart economic development and growth. This presents a unique
opportunity to accelerate investments needed for the transition of energy-intensive industries towards
carbon neutrality. Much of the investment for transitioning to a climate-neutral economy will need to
happen in the 2020’s – which also means that investments supported under the expected wave of
stimulus measures will need to be compatible with the transition to climate-neutrality. By contrast,
programmes need to avoid any investment incentives that cement the current structures in energy-
intensive industries, and thus produce more stranded assets over the long run.
9 PE 652.717IPOL | Policy Department for Economic, Scientific and Quality of Life Policies Creating market demand for low carbon products is key While subsidies can be helpful to accelerate change, in the long run Europe cannot subsidise its industry all the way to carbon neutrality: the transition needs to be driven by market-based incentives. Our analysis shows that the redesign of fossil fuel-based products (such as bio-based plastics, synthetic fuels and recycled cement) is key in the transition towards a low carbon economy. Demand for carbon neutral products should be encouraged through green public procurement and product regulations. The strive for a circular economy could be another enabler in stimulating market demand. CO2 emissions from burning fossil fuels can be reduced by new processes in the iron and steel sector, and use of hydrogen produced from renewable energy as feedstock in the fertilizer sector and as fuel in other sectors. Heat demand in industry will have to be decarbonised through heat pumps or use of hydrogen or geothermal heat. Emissions that cannot be avoided could still be tackled through CCS or CCU. As retrofitting outdated processes with CCS is not recommended, CCS/CCU should be applied to processes that have unpreventable CO2 emissions, most prominently in the cement and lime sector and at waste incineration plants. Without substantially higher carbon prices, the business cases for these transitions may not be attractive and investments into climate-neutral infrastructure run the risk of not being fully utilised. Carbon prices should be near €100/tCO2 in the short to medium term, increasing to over €250/tCO2 in 2050. If implemented unilaterally, higher carbon prices come at the cost of deteriorating competitiveness, so they would need to be accompanied by an effective border tax adjustment (BTA) that taxes imports similarly and exempts exports. An alternative is to introduce higher carbon prices by taxing the CO2 embodied in products, instead of production-based charges. This would also force consumers to take carbon costs into account, and could eventually be administered in a system similar to the VAT where in every production step, the added carbon is being charged. PE 652.717 10
Energy-intensive industries - Challenges and opportunities in energy transition

1. INTRODUCTION
1.1.     Background
The Paris Agreement has the objective to keep the global temperature increase to well below 2°C and
pursue efforts to keep it to 1.5°C. The European Union ratified the Paris Agreement on 5 October, 2016
and submitted its nationally determined contribution (NDC), committing itself to reduce greenhouse
gas emissions by at least 40% by 2030 compared to 1990 under its wider 2030 climate and energy
framework. All key legislation for implementing this target has been adopted by the end of 2018.
In November 2018, the European Commission presented their strategic long-term vision for a
prosperous, modern, competitive and climate-neutral economy by 2050. The strategy shows how
Europe can lead the way to climate neutrality by investing into realistic technological solutions,
empowering citizens, and aligning action in key areas such as industrial policy, finance, or research –
while ensuring social fairness for a just transition. In the political guidelines for the next European
Commission, Ms von der Leyen stated this ambition as follows: “Becoming the world’s first climate-
neutral continent is the greatest challenge and opportunity of our times. It involves taking decisive
action now. We will need to invest in innovation and research, redesign our economy and update our
industrial policy”.
In December 2019, the European Commission presented the European Green Deal. In this new growth
strategy, the European Commission is committed to becoming the first climate-neutral bloc in the
world by 2050. The plan is underpinned by an investment plan (the Sustainable Europe Investment
Plan) that will mobilise public investment and help to unlock private funds through EU financial
instruments which would lead to at least EUR 1 trillion of investments.
Industry has a leading role to play in the transformation towards a climate-neutral economy.
All industrial value chains, including energy-intensive sectors, will be confronted with major
challenges. In March 2020, the European Commission presented “A New Industrial Strategy for Europe”.
This document underpins the important role of industry in the transformation towards a carbon-
neutral economy. Industry has not only to work on reducing their own carbon footprints but also
accelerate the transition by providing affordable, clean technology solutions and by developing new
business models. These efforts should be supported by policies and financial instruments at EU and
national level, as well as the private sector. The big question for the coming years is what direction this
support should take and how it can be implemented most effectively.
The effectiveness of the support may even becoming more urgent since the Corona Crisis has started.
This crisis will lead to substantial economic losses and result in deficit governmental budgets in every
European member state. Designing cost-effective climate policy instruments will become an even
more urgent feature of future climate policies.

1.2.     Aim of the study
The study has the objective to explore how the EU energy-intensive industries can transition to a
climate-neutral economy while maintaining, and ideally improving, its global competitiveness.
This research addresses this objective from three angles: technology, business and finance.

                                                   11                                             PE 652.717
IPOL | Policy Department for Economic, Scientific and Quality of Life Policies
1.2.1. Role of technology
• What technologies can support attaining the ambitious mid-century climate targets (e.g. use
of biomass, further electrification, Carbon Capture and Storage (CCS), use of low-CO2 hydrogen,
Carbon Capture and Use (CCU), Carbon Recycling, Deep Geothermal, and process
intensification?
• What are the possibilities of renewable gas (hydrogen, biogas, synthetic gas, etc.) and what is
the role of energy storage in the future energy system? What are the hurdles to their
deployment? And how feasible are technological alternatives for the transition period (e.g.
alternatives as natural gas and nuclear)?
1.2.2. Role of finance
• How should this transition be financed and what is the role of the EU programmes, such as the
current existing schemes for the energy-intensive industries in the EFSI, COSME, Horizon 2020,
the European Structural and Investment Funds and the Innovation Fund from the EU ETS?
Is support of capital expenses (CAPEX) preferred over support of operational expenses (OPEX)?
• What is the possible role of the Just Transition Fund and Modernisation Funds from the EU ETS
in mitigating social impacts from the transition towards a climate-neutral economy?
1.2.3. Role of business
• Which kind of new business models and value chains can be needed to support this transition
i.e. required industrial symbiosis for supply chains in CCU?
• How can the decarbonisation of the energy-intensive industries be supported by niche
markets/lead markets for low and zero carbon technologies and products?
1.3. Delineation
The scope of the project are the EU’s energy-intensive industries (EII). This study cannot address all the
issues that are relevant in all necessary detail. As a working definition, we focus on those industrial
sectors that are covered in the EU Emissions Trading System (EU ETS). Figure 1 shows the emissions of
industrial sectors in the EU ETS, according to the European Transaction Log (EUTL). This figure shows
that the Iron and steel sector has the greatest share of emissions followed by refineries, cement,
petrochemicals and fertilizer. Together these five sectors make up over 70% of industrial emissions in
the EU ETS. These sectors therefore form the core of our technical and financial analysis.
However, these are not the only energy-intensive industries for whom transition to climate neutrality
constitutes a challenge. In the treatment of the economic impacts, we will also investigate the situation
in the industries that constitute the top-10 sectors in the EU ETS. Next to the aforementioned five
sectors these include: lime and plaster; paper and pulp; aluminium, inorganic chemicals and hollow
glass. Including these sectors implies that 85% of the industrial emissions in the ETS are included in our
analysis.
PE 652.717 12Energy-intensive industries - Challenges and opportunities in energy transition
Figure 1: Share of CO2 emissions in the total industrial CO2 emissions in the EU ETS in 2018
Other
15%
Hollow glas
1%
Iron and steel*
Inorganic chemicals 22%
2%
Aluminium
2%
Paper and pulp
4%
Lime and plaster
4%
Refineries
Fertilizer 19%
5%
Petrochemicals
8%
Cement
18%
Source: EUTL, calculations CE Delft
Notes: * Emissions of the iron and steel sector exclude emissions from burning waste gasses to generate electricity
The analysis in this study will be done at the European level, without going into detail regarding the
differences between Member States or between individual companies or locations.
The energy-intensive sectors (e.g. iron and steel, cement and lime, chemicals and refineries) have
decreased their greenhouse gas emissions by almost 40% between 1990 and 2017. Major components
of this reduction are reduction of nitrous oxide (N2O) in the chemicals sector and CO2 reductions in the
iron and steel, cement and lime sectors. Although all greenhouse gases contribute to global warming,
the abatement technologies are different for each gas. Currently, CO2 emissions constitute 97% of the
total GHG emissions for the four sectors under consideration. Therefore, this report will focus only on
reduction of CO2 emissions in the energy-intensive industries.
Finally, one should notice that this study is executed in a rapidly changing policy context. We have
included the policy situation as of the beginning of March 2020. The policy chapter can be found in
Section 2.3.
13 PE 652.717IPOL | Policy Department for Economic, Scientific and Quality of Life Policies 1.4. Reading guide The content of this study is that Chapter 2 gives the present background information on the current situation of energy-intensive industries with respect to international competitiveness, climate policy costs and the rapidly changing climate policy context. Chapter 3 presents the technologies that can be applied in the industrial sectors to drastically reduce CO2 emissions. Chapter 4 investigates the existing financial framework within the EU to accommodate the transition towards a carbon-neutral economy. Chapter 5 then investigates potential policy roadmaps to follow and presents various policy recommendations on the strategy to follow in the next decades. PE 652.717 14
Energy-intensive industries - Challenges and opportunities in energy transition

2. STATE OF PLAY OF THE ENERGY-INTENSIVE INDUSTRIES IN
   EUROPE
2.1.       Introduction
Energy-intensive industries are important sectors for the European economies. Within the sectors iron
and steel, minerals, refineries and chemical industries an estimated 3.2 million citizens are employed in
the new EU27. 1 This is around 11% of total employment in industry. These four sectors contribute about
15% of total value added of manufacturing in the EU27. Products of these sectors are used in other
industries within the EU. The sheer presence of energy-intensive industries within the European Union
can be seen as an important competitive advantage for high-tech production, such as in the
automotive industry or chemical industries. This fact is also recognised in the Industrial Strategy of the
European Commission that is nowadays oriented on value chains; (EC, 2019) see also Section 2.4.
Climate neutrality by mid-century implies a very drastic change in the way energy-intensive industries
are producing. This chapter describes both the present and future policy context in Section 2.2 and
links this with the potential impacts on competitiveness in Section 2.3. Section 2.4 draws some
conclusions.

2.2.       CO2 emissions and climate policy context for energy-intensive
           industries
Energy-intensive industries are operating in a rapidly changing climate policy context. After the
signature of the Paris Agreement, both the European Commission, the European Parliament and
Member States have formulated far-reaching policies with the intention to keep GHG emissions in line
with the adopted policy goals.
2.2.1.          CO2 emissions
CO2 emissions of energy-intensive industries have been fallen significantly over time. Figure 2 presents
the historic figures for the four sectors under consideration.

Figure 2: CO2 emissions of four core industrial sectors from 1990 until 2017, EU28

Source: (Eurostat, 2018), calculations CE Delft

1
    Throughout this report we will use data for the whole EU excluding the UK because of Brexit.

                                                                  15                                       PE 652.717
IPOL | Policy Department for Economic, Scientific and Quality of Life Policies In the energy-intensive industries, emissions declined by almost 30% between 1990 and 2018: most profoundly in the iron and steel sector (-41%), followed by the cement and lime (-30%), chemicals (-27%) and refineries (-5%). Half of all the emissions in the energy-intensive industries are being caused by heating fossil fuels in furnaces for high-temperature processes. Figure 3 provides an overview of the emissions allocated to use in Europe in 2019. Figure 3: Estimated direct emissions of industry in Europe by end use and sub-sector, note the large share of heat-related emissions Source: (EC, 2018). 2.2.2. Present regulation At present, GHG emissions from energy-intensive industries are primarily regulated through the European Emission Trading Scheme (EU ETS). The EU ETS is an EU-wide policy instrument that regulates the E emissions of over 12,000 installations. Participants have to monitor and report their CO2 andsome other GHG emissions and obtain permits for these. Part of the permits are distributed for free to sectors prone to carbon leakage (see Section 2.4), the rest is sold via auctions. The number of permits distributed decreases every year according to the “linear reduction factor”, currently 2.2%. Permits can be traded to assure a cost-effective compliance to the required reductions. PE 652.717 16
Energy-intensive industries - Challenges and opportunities in energy transition

Figure 4 shows that the emissions of energy-intensive industries participating in the EU ETS declined
between 2008-2012, but since 2013 emission reduction has come to a halt.

Figure 4: CO2 emissions in the EU ETS from the energy-intensive industries, EU27, 2008-2018

              700
     Mt CO2

                                                                                                                  Hollow glas
              600
                                                                                                                  Aluminium

                                                                                                                  Inorganic chemicals
              500
                                                                                                                  Paper and pulp

              400                                                                                                 Lime and plaster

                                                                                                                  Fertilizer
              300
                                                                                                                  Petrochemicals

                                                                                                                  Cement
              200
                                                                                                                  Refineries

              100                                                                                                 Iron and steel*

                0
                 2008   2009    2010     2011     2012      2013     2014     2015     2016     2017     2018*

Source: EUTL data, CE Delft calculations.
* Preliminary dataBTA.

The lack of emission reduction is remarkable because since the start of Phase 3 in the EU ETS, energy-
intensive industries have gradually received less allowances for free (see Figure 4). Nowadays all
sectors, with the exception of the inorganic chemicals and aluminium, need to buy a part of the
emission allowances to fulfil their compliance obligations (see Figure 5). 2 Refineries, on average, had
to buy permits for around 30% of their CO2 emissions in 2018.

2
    It should be noted, though, that most companies still have a large surplus of allowances stemming from the over-allocation of allowances
    during Phase 2 of the EU ETS (2008-2013).

                                                                   17                                                           PE 652.717
IPOL | Policy Department for Economic, Scientific and Quality of Life Policies
Figure 5: Percentage of free allowances compared to verified emissions of the energy-intensive
industries in the EU ETS, EU27 data, 2008-2018 3
200%
180%
160%
140% Paper and pulp
Refineries
120% Inorganic chemicals
Petrochemicals
100%
Fertilizer
Hollow glas
80%
Cement
60% Lime and plaster
Aluminium
40%
20%
0%
2008 2009 2010 2011 2012 2013 2014 2015 2016 2017 2018*
Source: EUTL data, CE Delft calculations.
The ten energy-intensive industries together faced a total cost of around EUR 1 billion from the net
purchase of allowances in the EU ETS. 4 This will gradually increase towards an estimated EUR 5 billion
in 2030 because of the changes in Phase IV of the EU ETS (see Chapter 4).
2.2.3. Future climate policy context
In December 2019, the European Commission presented the European Green Deal (EGD). In it, the
Commission sketches its strategy to transform the EU into a resource-efficient competitive and climate-
neutral economy by 2050. As one key step for implementing the EGD, the Commission proposed a
European Climate Law on 4 March 2020. This Climate Law is intended to legally enshrine the goal of
climate neutrality by 2050.
The European Green Deal mentions the EII explicitly: ‘Energy-intensive industries, such as steel,
chemicals and cement, are indispensable to Europe’s economy, as they supply several key value chains.
The decarbonisation and modernisation of this sector is essential.’5
The European Green Deal stresses the need for frontrunners to develop commercial applications of
breakthrough technologies in key industrial sectors by 2030. It also underlines the importance of new
technologies and their deployment across the internal market.6 The Innovation Fund that was recently
3
In interpreting the figure, one should notice that >100% implies that the sector receives more free allowances than its verified emissions.
During Phase 2 (2008-2012), there was over-allocation to industries, as the fall in emissions because of the economic crisis was not
adjusted with a lower allocation of allowances.
4
Calculated as the average of verified emissions minus allocated emissions multiplied by the average emission price in 2019 (€24/tCO2)
excluding the iron and steel sector.
5
European Commission Communication, The European Green Deal, COM (2019) 640.
6
The Green Deal mentions the following priority areas: clean hydrogen, fuel cells and other alternative fuels, energy storage, carbon
capture, storage and utilisation.
PE 652.717 18Energy-intensive industries - Challenges and opportunities in energy transition
established as part of the EU ETS will contribute to the funding of large-scale innovative projects to
demonstrate the use of low-carbon technologies in EII (EC, 2019).
To meet climate targets set in the European Green Deal significant investments and funding are
required. To meet funding needs the Commission will present a European Green Deal Investment Plan
(EGDIP). 7 Capital for this Investment Plan will be provided by the EU Budget, InvestEU and revenue from
the EU ETS. The Commission will also review the role of the Innovation and Modernisation funds as part
of the EU ETS review. A Just Transition Mechanism is part of the EGDIP. This mechanism is designed to
ensure a fair transition toward a carbon-neutral economy. The focus of this mechanism will be on
regions and sectors that depend on fossil fuels or carbon-intensive processes as they are most affected
by the transition (EC, 2019). Chapter 4 will review these financial instruments.
Specific for the European Industry, the Commission states that the European Green Deal will support
and accelerate the transition to a sustainable model of inclusive growth (EC, 2019). To this end the
European Commission has adopted an EU industrial strategy in March 2020 (EC, 2020). 8 This strategy is
part of the new circular economy action plan, which aims to stimulate markets for circular and climate-
neutral products (EC, 2019). For energy-intensive industries, the plan echoes the objective set in the
European Green Deal to create new markets for climate-neutral and circular products, such as steel,
cement and basic chemicals. To lead this change, Europe needs novel industrial processes and more
clean technologies to reduce costs and improve market readiness. In order to do this, the Commission
will support clean steel breakthrough technologies leading to a zero-carbon steel making process. A
new chemicals strategy for sustainability will help better protect people and the environment against
hazardous chemicals and encourage innovation in the sector to develop safe and sustainable
alternatives. The EU Emissions Trading System Innovation Fund will help deploy other large-scale
innovative projects to support clean products in all energy-intensive sectors. A Clean Hydrogen
Alliance will be established to accelerate the decarbonisation of industry and maintain industrial
leadership, followed by Alliances on Low-Carbon Industries and on Industrial Clouds and Platforms and
raw materials.
The Commission will adopt a White Paper by mid-2020 to address distortive effects caused by foreign
subsidies in the single market and tackle foreign access to EU public procurement and EU funding.
The issue related to foreign subsidies will be addressed in a proposal for a legal instrument in 2021.
This will go hand in hand with ongoing work to strengthen global rules on industrial subsidies in the
World Trade Organisation, and actions to address the lack of reciprocal access for public procurement
in third countries.
By summer 2020, the Commission will present an impact assessed plan to increase the reduction target
for 2030 to 50-55% (compared to 1990 levels). By June 2021, the commission will review and where
necessary revise all climate-related policy instruments, including the EU ETS (and a possible extension
thereof) and the Energy Taxation Directive. A carbon border adjustment mechanism will be proposed
in case of divergence between European and worldwide climate ambitions. This mechanism is
supposed to protect European energy-intensive industries from competitors that operate with less
stringent climate regulations, and thus have an unfair competitive advantage.
7
See the European Commission, press release of 14/01/2020, Financing the green transition: The European Green Deal Investment Plan
and Just Transition Mechanism, available at: https://ec.europa.eu/regional_policy/en/newsroom/news/2020/01/14-01-2020-financin g -
the-green-transition-the-european-green-deal-investment-plan-and-just-transition-mechanism
8
European Commission Communication, A new Industrial Strategy for Europe, COM (2020) 102.
19 PE 652.717IPOL | Policy Department for Economic, Scientific and Quality of Life Policies
2.2.4. High level group
The High-Level Group on Energy-Intensive Industries (HLG EII) developed a Masterplan 9 containing
recommendations to manage the transition to climate-neutrality while keeping the EII competitive.10
These recommendations served as input for the European Green Deal and the EU Industrial Strategy.
The HLG EII share the ambition of the Paris Agreement and underline the transformation challenges
this ambition implies. The Masterplan gives concrete recommendations on three themes:
• the creation of markets for climate-neutral, circular economy products;
• developing climate-neutral solutions and financing their uptake; and
• resources and deployment.
2.2.5. European Parliament
The European Parliament supports the European Green Deal and underlines its ultimate goal to reach
climate-neutrality by 2050. 11 The members of Parliament call for an increase of the 2030 reduction
target to 55% compared to 1990 levels, instead of the Commission’s 50 to 55% reduction target. In
addition, the European Parliament calls for an extra interim target in 2040 on the path to climate-
neutrality in 2050.
Moreover, the European Parliament underlines that the Green Deal should aim for a sustainable and
competitive economy for all and stresses the importance of a just transition to a climate-neutral
economy. In order to prevent carbon leakage, the EP calls for a carbon border adjustment mechanism.
European Parliament also underlines and supports the need for a sustainable investment plan to
finance investments. The European Parliament regards the availability of substantial public and private
investments as a precondition for the success of the Green Deal.
With respect to EII, the European Parliament agrees with the Commission that EII are crucial for the
European economy and that their modernisation and decarbonisation of EII is necessary (EP, 2020).
The European Parliament also highlights the synergies between climate action and the circular
economy in energy- and carbon-intensive industries and calls for an EU-level target for resource
efficiency (EP, 2020).
2.2.6. Timelines European policies
Table 1 summarises some key policy documents that will be published by the EC in the upcoming
year(s). 12
9
Masterplan for a Competitive Transformation of EU Energy-intensive Industries Enabling a Climate-neutral, Circular Economy by 2050 –
Report. Date: 28-11-2020.
10
EU Energy-Intensive Industries’ 2050 Masterplan.
11
European Parliament resolution of 15 January 2020 on the European Green Deal (2019/2956(RSP)).
12
For a complete roadmap see: ‘Annex to the Communication on the European Green Deal - Roadmap - Key actions’.
PE 652.717 20Energy-intensive industries - Challenges and opportunities in energy transition
Table 1 : Key policy documents to be published by the EC the upcoming years
Date Action
October 2016 Paris agreement
November 2018 Strategic vision EU (‘A Clean Planet for all’)
November 2019 Master Plan EII
December 2019 European Green Deal
January 2020 European Parliament support for Green Deal
Proposal EGDIP
January 2020
Proposal Just Transition Mechanism
February/March 2020 Proposal European Climate law
European Industry Strategy
March 2020
Circular Economy Action Plan
March 2020 European Climate pact
Smart sector integration strategy
June 2020
Assessment national energy and climate plans
EC Impact Assessment Plan for GHG reduction target 2030
Summer 2020
Chemicals Strategy for sustainability
Q3 2020 Sustainable finance strategy
Initiatives lead markets for climate-neutral and circular products in EII
2020
Proposal to support zero carbon steel-making process by 2030
2021 Proposal Carbon border adjustment mechanism
Proposals for revisions of climate-related policy instruments (a.o. ETS
June 2021 Directive, Energy Efficiency Directive, Renewable Energy Directive and
Energy Taxation Directive)
2020/2021 EU Strategy on Adaptation to Climate Change
Source: European Commission.
21 PE 652.717IPOL | Policy Department for Economic, Scientific and Quality of Life Policies 2.3. Impacts on competitiveness 2.3.1. Present situation with respect to competitiveness Competitiveness is a difficult concept that is often rooted in a wrong interpretation of economics. The famous economist Paul Krugman (1994) argues that: ‘The doctrine of 'competitiveness' is flatly wrong. The world's leading nations are not, to any important degree, in economic competition with each other’. As Krugman notes, national economic welfare is determined primarily by productivity in both traded and non-traded sectors of the economy and not by the amount of “competitiveness”. The Ricardian theory of trade assumes that countries specialise in their own comparative advantage. There is no model of trade possible where one country dominates in every trade segment – an often implicit vowed aim in many of the advocates of competitiveness. Having this in mind, we can look a bit more in detail at the potential degree of competitiveness in the EU energy-intensive industries. The international competitiveness is determined by a number of factors – the capacity to develop and deliver innovative, high-quality products that meet the needs of the customers reliably, on time, and at affordable cost. Which of these parameters is most important will differ between products and market segments. Yet for energy-intensive industries, production costs are a particular determinant of their competitiveness. Production costs of the energy-intensive industries have been emphasised a long time but the energy cost component in it has really come into the spotlight since the communication For a European Industrial Renaissance from the European Commission in 2014. Specific concern vowed here was that energy costs for the EU industries would endanger their competitiveness in a global market. However, a study by JRC (JRC, 2016) finds that this is not universally true. Production costs of EU industries when compared to major competitors tend to be on the high side for iron and steel, ammonia and methanol production. Production costs in the EU are comparable to the main competitors for cement, ethylene, propylene and copper production. For zinc production, the study finds that the EU has among the lowest production costs. The study shows that EU industries tend to have the highest labour costs; however this cost disadvantage is counter balanced by the high labour productivity, so that the total costs are comparable. A similar advantage has not been achieved by energy costs yet: the study indicates that the energy efficiency of EU industries is only marginally better than that of foreign competitors. Also if we compare trade flows, we do not witness that European energy-intensive industries have lost competitiveness that would cause a change in relative imports or exports. Figure 6 provides an overview of the situation in 2008 and 2018 with respect to the share of imports and exports to production for nine energy-intensive industrial sectors. First of all this figure shows that some sectors, like cement and lime, are hardly competing on world markets as the shares of imports and exports to production are very small. The figure also shows that for most sectors, both exports and imports have been growing in 2018 compared to 2008, which is showing the influence of globalisation so that more trade takes place. For paper and paperboard, glass production and cement, relative exports have been growing while imports have been falling, indicating that these sectors are probably better able to compete with world competitors. For aluminium, iron, and steel, the relative share of imports has been falling indicating that these industries are better able to compete on the domestic EU market than in 2008. So when we investigate trade flows there is no overall sign of deteriorating competiveness in relative import or export positions. This is similar to conclusions conducted in other research in the past (see e.g. Ecorys and Öko-Institut, 2013). PE 652.717 22
Energy-intensive industries - Challenges and opportunities in energy transition

Figure 6: Share of value of exports and imports in the production value of 9 sectors (2008 and
2018)

                                     0%         10%       20%        30%      40%       50%

           Paper and paperboard

             Inorganic Chemicals

               Organic chemicals
                                                                                                  Exports 2008
                       Fertilizers
                                                                                                  Exports 2018

                         Cement
                                                                                                  Imports 2008

                 Lime and plaster
                                                                                                  Imports 2018

                       Aluminium

                            Glass

                   Iron and Steel

Data: Eurostat, DS-066341, retrieved 6 March 2020. For refineries no information was available.
      See Annex A for sector delineation.

2.3.2.         Present situation with respect to carbon leakage
The risk of carbon leakage has the potential to undermine the effectiveness and support for ambitious
future climate policy in the EU. Carbon leakage occurs when, as a result of stricter climate policy in one
country, emission-intensive production activities increase in another country with less stringent
climate policy. As a result, part or all of the emission reduction achieved in one country is compensated
by increases somewhere else. In theory, carbon leakage can only occur if emission move from a country
with an absolute ceiling (cap) on their CO2 emissions to a country that has not capped their CO2
emissions with an absolute ceiling. If emissions would move from one capped system to another
capped system (e.g. from Germany to Norway) there can be no sign of carbon leakage.
Carbon leakage is a complex issue and highly relevant in the context of future climate policies. Carbon
leakage can occur through various channels, but the most debated channels in the political arena are
the impacts on trade (through productivity and market shares) and the impacts on investments
(through impacts on profits margins). These short- and medium term impacts are largely intertwined:
if companies in the EU lose market shares because of climate-oriented policies, their investment climate
will also be negatively affected in the end.
The theoretical and empirical economic literature is not uniform in their conclusion to what extent
carbon leakage has occurred so far because of climate policies or may in the future. For example, Ecorys
and Öko Institut (2013) concluded that carbon leakage so far could not be evidenced by the data from
sectors participating in the EU ETS. In investigating asymmetric energy prices, Sato and Dechezlepetre
(2015) concluded that net exports may be negatively affected by energy price differentials, but that the
impact is small. They state that their analysis reveals that a carbon price of €40-65/tCO2 in the EU ETS
would increase Europe's imports from the rest of the world by less than 0.05% and decrease exports by
0.2%. In a more recent paper, Garsous and Kozluk (2017) find similar small negative impacts on
investments. Therefore, it is exaggerated to suggest that asymmetrical carbon pricing would wipe out
European energy-intensive industries.

                                                                23                                               PE 652.717
IPOL | Policy Department for Economic, Scientific and Quality of Life Policies
However, these empirical papers have merely investigated the short-term impacts. Longer-term
impacts have not been investigated properly yet, partly because of the model formulation in the
studies above, but also because of the fact that asymmetrical carbon pricing is only a recent
phenomenon. In the literature, one can find some key factors that may influence the amount of carbon
leakage that is to occur (see e.g. AEA and CE Delft, 2011; Climate Strategies, 2016):
a. The extent to which other economies have similar carbon and energy policies in place. If all
countries would adhere to the same CO2 reduction target, there is no carbon leakage by
definition. However, as the UNFCCC has identified that countries have “common but
differentiated responsibilities”, CO2 reduction targets have to differ between countries and so do
carbon costs.
b. The investment and operational costs of the technologies in energy-intensive industries. Such
costs can be lowered over time due to learning effects and targeted R&D efforts.
c. Elasticity of substitution for energy, indicating both the substitution between various energy
sources (gas, coal and renewables) and the substitution between energy and other factors of
production (labour, capital).
d. Trade elasticities (e.g. Armington elasticities), the extent to which goods produced in the EU can
be substituted for goods produced in non-EU countries. The trade elasticities tend to be lower
for specific niche products. If the EU industry can become carbon-neutral, and if consumers and
public procurement is increasingly asking for carbon-neutral products and services, the exposure
to international competition can be diminished.
e. Ability to pass the cost of regulatory compliance to consumers (which may depend on market
structures). The ability to pass through costs can also be enhanced by increased demand for
carbon-neutral products and public procurement.
f. The extent to which companies can use climate and energy policies to rationalise on other parts
of their operations. The Porter hypothesis states that higher carbon costs would force companies
to reduce existing inefficiencies and even make companies more competitive on world markets
(see Porter and van der Linde, 1995). Although there is quite some controversy if the Porter
hypothesis holds true from an empirical point of view (see e.g. Brannlund and Lundgren, 2009),
the theory suggests that there could exist a path where climate policies would result in lower
costs for the society as a whole. This is particular true if in the present situation market failures
exist in information, risk perception or property rights (e.g. split incentives) that make present
economics not optimal. If climate policies could internalise one of these existing market failures,
economies adhering to climate policies could become more competitive.
Therefore, the fear that unequal carbon costs make EU energy-intensive companies to drive out of
business and resulting in massive carbon leakage is oversimplified. Moreover, these mechanisms
determine whether a sector or industry is prone to future carbon leakage. As these factors differ for
each sector, it is difficult to say something generalised about the risk of carbon leakage. This implies
that there is a policy risk in addressing carbon leakage, as policies like to make ‘equal rules’ for sectors
and industries avoiding discriminatory measures. In the EU ETS, the interplay between carbon costs
and trade intensities determines which sectors are considered to be at risk of carbon leakage and
thereby receive free allowances. Yet if the carbon price should continue to increase, the list of factors
identified above would indicate that there would be a necessity for a more sophisticated approach.
The question whether such an approach can be found is discussed in Chapter 5.
PE 652.717 24Energy-intensive industries - Challenges and opportunities in energy transition
2.4. Discussion and conclusions
At present, energy-intensive industries in the EU27 pay around one billion Euro annually to comply
with the EU ETS. This is a small share, representing about 1.4% of the profits of 2017. 13 Nevertheless,
carbon leakage concerns have been high on the political agenda since the start of the EU ETS. So far,
no significant carbon leakage impacts have been discerned in the literature: expected impacts for
carbon prices up to €30-40/tCO2 seem to be mild, certainly in the short run. However, the literature has
not yet properly investigated long-term impacts.
What determines competitiveness hinges crucially on the timeframe for the investigation, and the
assumptions about whether other relevant countries will also pursue increasingly ambitious climate
policies. In the short to medium term, and in a world with continued discrepancies in climate ambition,
climate-related costs will remain an important determinant for competition. Yet it should not be
overplayed. European energy-intensive industries have in the past reacted on the rising labour costs
with labour productivity increases thereby remaining competitive on the world market. A similar
increase in energy and carbon productivity can keep the European energy-intensive industries in pace
with the non-EU competitors.
Yet in the longer run, competitiveness in a decarbonising global economy will come to be determined
by the capacity to deliver products with drastically reduced emissions – all the more so if other relevant
countries pursue strategies of comparable ambition. In this way, shielding domestic EIIs from the
pressure to change and innovate is only a short-term fix – and may risk leading them into a lock-in.
A more long-term oriented competitiveness policy should rather aim to build up or extend
technological leadership in the area of low-carbon industrial technologies, as outlined in Chapter 3.
13
Calculated on the basis of the difference of verified minus allocated emissions for the sectors paper & pulp, refineries, inorganic chemicals,
organic chemicals, fertilizers, hollow glass, cement, lime, iron and steel and aluminium.
25 PE 652.717IPOL | Policy Department for Economic, Scientific and Quality of Life Policies
3. AVAILABLE TECHNOLOGIES FOR ENERGY-INTENSIVE
INDUSTRIES IN 2050
3.1. Introduction
Ambitious climate policies confront energy-intensive industries with a major challenge: to remain
competitive on globalised markets while taking steps to drastically reduce their carbon emissions – and
with technological solutions for the transition towards a low-carbon economy at different stages of
maturity. This chapter provides a concise overview of potential carbon-neutral technologies that could
be applied in the energy-intensive industries. It provides an overview of which technologies can
support attaining the ambitious mid-century climate targets, investigates the possibilities of renewable
energy carriers and provides an analysis into the role of energy storage in the future energy system.
A climate-neutral industry requires a source of climate-neutral energy, as all processes in the energy-
intensive industries require energy by definition. This implies that one either has to use a renewable
energy source or a fossil energy source using carbon capture. There are no other options available.
These two core-options have to be assisted by two other developments. Firstly, climate neutrality
demands that material chains need to be closed to turn them from chains into loops, with the
remaining raw materials needs sourced in a climate-neutral way. Secondly, climate neutrality may
involve reduced demand. 14 This includes advances both in energy efficiency as well as in material
efficiency.
Any emissions that cannot be avoided by switching of the fuel or feed need to be either captured or
offset. 15 A key requirement for the majority of technological options for CO2 reduction is the availability
of low-carbon electricity. In this report, the electricity sector is assumed to be carbon-neutral in 2050
although an increase in electricity production is necessary.
3.2. Approach in identification of key technologies
For the technologies, we focus only on technologies available in the most energy-intensive sectors:
iron and steel, cement, refineries, petrochemicals and fertilizers. As seen in Chapter 2, these sectors
account for over 70% of CO2 emissions in the EU ETS. The technologies discussed in this report are
selected by first studying various sector roadmaps (Eurofer, 2013), (Cembureau, 2013), (EuLA, 2018),
(Cefic, 2019), (DECHEMA, 2018), (FuelsEurope, 2018) and existing literature on the decarbonisation of
European industry. Using this information, a number of key reduction paths were selected, the
technologies of which were further researched for this report.
In our selection of technologies we first investigated technologies that are proven technology, but not
(yet) widely applied. In the scores of technology ranking (see Box 1), these would have a typical
Technology Readiness Level (TRL) of 8 to 9 (See next page).
Then, in a second round, we identified technologies that would meet each of the following criteria
below:
• promising technology with good prospects for scale-up (TRL 6-7);
• large reduction potential; and
• solutions applicable in multiple sectors.
14
In terms of physical quantities produced, not necessarily in terms of monetary values.
15
An example of these so-called ‘process emissions’ is the calcination of limestone to quicklime in cement production: CaCO3 → CaO + CO2.
PE 652.717 26You can also read