ENERGY INVESTMENT PLAN FOR WESTERN NOVA SCOTIA - A Roadmap for Addressing Climate Change and Building the Clean Energy Economy
←
→
Page content transcription
If your browser does not render page correctly, please read the page content below

ENERGY INVESTMENT PLAN FOR
WESTERN NOVA SCOTIA
A Roadmap for Addressing Climate Change
and Building the Clean Energy Economy

Contents
IN THE NUMBERS, WESTERN REGION						7

A NOTE ON THE IMPACT OF CORONAVIRUS (COVID-19)				            8

EXECUTIVE SUMMARY									9

1. INTRODUCTION 									11

2. METHOD											13

3. THE WESTERN REGION								17

4. THE ENERGY SYSTEM									19

5. THE ENERGY OPPORTUNITY 							22

6. THE CLEAN ENERGY ECONOMY							26

7. ECONOMIC IMPACT: THE BIG PICTURE						                     45

8. OPPORTUNITIES									58

9. DISRUPTORS										77

10. IMPLEMENTATION									79

APPENDIX A. DETAILED ENERGY AND EMISSIONS MODELLING RESULTS   86

APPENDIX B. DETAILED FINANCIAL MODELLING RESULTS			           91

APPENDIX C. RENEWABLE ENERGY SITE SELECTION				               94


ENERGY INVESTMENT PLAN FOR WESTERN NOVA SCOTIA

Disclaimer
This analysis has been undertaken to identify a community energy investment plan for the
Western Region Enterprise Network (Western REN). Reasonable skill, care and diligence have
been exercised to assess the information acquired during the preparation of this analysis, but no
guarantees or warranties are made regarding the accuracy or completeness of this information.
This document, the information it contains, the information and basis on which it relies, and
factors associated with implementation of the pathway are subject to changes that are beyond
the control of the authors. The information provided by others is believed to be accurate, but has
not been verified.
This analysis includes high level estimates of costs and revenues that should not be relied upon
for design or other purposes without verification. The authors do not accept responsibility
for the use of this analysis for any purpose other than that stated above and does not accept
responsibility to any third party for the use, in whole or in part, of the contents of this document.
This analysis applies to the Western Region and cannot be applied to other jurisdictions without
analysis. Any use by the Western REN, project partners, sub-consultants or any third party, or any
reliance on or decisions based on this document, are the responsibility of the user or third party.

4
A ROADMAP FOR ADDRESSING CLIMATE CHANGE AND BUILDING THE CLEAN ENERGY ECONOMY

Glossary
BAU        Business as usual scenario
CES        Clean energy scenario
CO2        Carbon dioxide
CO2e       Carbon dioxide equivalents
CDD        Cooling degree days
CH4        Methane
CHP        Combined Heat and Power
DE         District energy
GHG        Greenhouse gas emissions
GPC        Global Protocol for Community Scale Greenhouse Gas
           Emissions Inventories
GWP        Global warming potential
HDD        Heating degree days
HFC        Hydrofluorocarbons
HCFC       Hydrochlorofluorocarbons
ICI        Industrial, commercial, and institutional buildings
IRP        Integrated Resource Plan
NPV        Net present value
O&M        Operations and maintenance
REN        Region Economic Network
RNG        Renewable natural gas
PV         Photovoltaic
SCC        Social cost of carbon
VKT        Vehicle kilometers travelled
WREIP      Western Region Energy Investment Plan

                                                                                5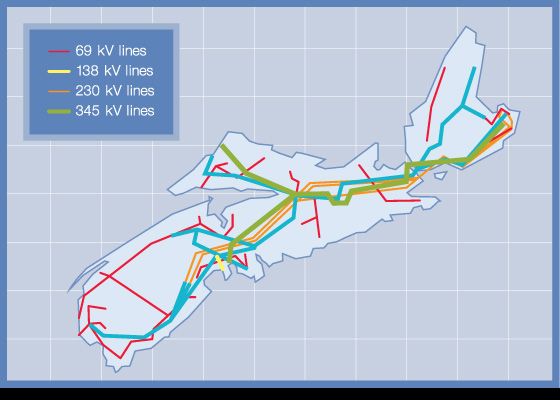
ENERGY INVESTMENT PLAN FOR WESTERN NOVA SCOTIA

Units
GHG emissions
1 ktCO e = 1,000 tCO e
      2              2

Energy
1 MJ= 0.0001 GJ
1 TJ= 1,000 GJ
1 PJ= 1,000,000 GJ
1 GJ= 278 kWh
1 MWh= 1,000 kWh
1 GWh=1,000,000 kWh

6
A ROADMAP FOR ADDRESSING CLIMATE CHANGE AND BUILDING THE CLEAN ENERGY ECONOMY
In the numbers, Western Region
Population, 2016 49,400
Population, 2050 48,300
Per capita GHG emissions, 2016 21.6 tCO2e
Per capita GHG emissions in 2050 if the low energy 2.7 tCO2e
scenario is implemented:
Total energy consumption 2016 10.28 PJ
Total energy consumption under the business as 8.71 PJ
usual scenario, 2050
Total energy consumption under the low energy 4.91 PJ
scenario, 2050
Total expenditures on energy, 2016 $326.8 million
Savings on energy expenditures under the low $1.8 billion
energy scenario, 2018-2050
Average energy expenditures per household in 2016 $5,842
(including transportation)
Average energy savings per household per year in $2,100
2050
Total investment required for the low energy $1.6 billion
scenario, 2021-2050
Person years of employment generated as a result of 4,600
the low energy investments, 2018-2050
Total GHG emissions, 2016 1.1 million tCO2e
Total GHG emissions in the absence of action: 2050 0.78 million tCO2e
Total GHG emissions if the region implements the 0.13 million tCO2e
low energy scenario, 2050
7ENERGY INVESTMENT PLAN FOR WESTERN NOVA SCOTIA
A Note on the Impact of
Coronavirus (COVID-19)
The analysis in this document was completed before COVID-19 began spreading rapidly in
Canada. Even so, the analysis continues to be relevant not only because the climate crisis
persists, but also because this document provides solutions that can stimulate the economy
during the pandemic-induced recession. The solutions the report recommends, ranging from
retrofits to investing in renewable energy, are designed to decrease emissions and increase
energy efficiency while creating jobs.
In the context of COVID-19, here are some key points to consider:
• A global health crisis: The pandemic has radically transformed societies and economies,
resulting in tragedy and disrupting work and home life everywhere.1
• The impacts of coronavirus are unclear: The negative impact of COVID-19 on people,
workplaces, and the economy, as well as the duration of those impacts, presents many
uncertainties. The recovery will be affected by a combination of factors such as public
health guidance for opening up society, the evolution of the pandemic, the design of
public policy responses and the continuing response by global institutions.
• The climate emergency remains an emergency: A decline in activity has resulted in a short
term reduction in GHG emissions but concentrations of GHG emissions in the atmosphere
continue to climb and global temperatures continue to increase.2 The pandemic has also
disrupted international efforts to address climate change.
• There are challenges and opportunities: In the short term, the impacts of COVID-19 both
challenge and reinforce actions outlined in the WREIP.
• Substantively addressing climate change is more relevant than ever: Investments made
now lock in emissions for decades. The WREIP identifies investments that stimulate the
economy and decarbonise the western region out until 2050.
• Alignment with green stimulus: As Canada initiates efforts to recover from the impact of
the coronavirus, there is an opportunity to stimulate the economy with investments that
simultaneously address the climate crisis. This Plan describes an investment opportunity
that will generate jobs, stimulate businesses, reduce GHG emissions, and provide benefits
for local communities and the Region.
1
World Health Organisation (2020). World health statistics 2020: monitoring health for the SDGs, sustainable development goals. Retrieved
from: https://apps.who.int/iris/bitstream/handle/10665/332070/9789240005105-eng.pdf
2
World Meteorological Organisation (2020). The Global Climate in 2015-2019. Retrieved from: https://library.wmo.int/doc_num.
php?explnum_id=10251
8A ROADMAP FOR ADDRESSING CLIMATE CHANGE AND BUILDING THE CLEAN ENERGY ECONOMY
Executive Summary
There are 10 years remaining to establish the systems and investments that will limit global
warming to 1.5°C – or risk an exponential increase in climate-related disasters.3 As a result, this
decade will be the most critical in the fight against climate change: the final decade to avoid
disaster.
The energy system is in the midst of a profound transformation with the increasing introduction
of decentralised electricity production storage, the electrification of transportation and the
advancement of policies at all levels of government to mitigate greenhouse gas emissions.
This report describes the role of, and opportunity for the Western Region of Nova Scotia
(“Western Region”). Using detailed modelling, the analysis explores a transition to a clean energy
economy, while simultaneously achieving multiple economic and social benefits.
The transition to a cleaner energy economy requires using energy more efficiently, moving from
fossil fuels to electricity wherever possible and generating electricity with low or zero carbon
emissions. This means extensive retrofits of the existing building stock, increasing the energy
performance of new buildings, building new sources of zero- and low-carbon energy, including
wind and solar, electrifying vehicles, heating systems, and many other products and processes.
These investments represent significant investment opportunities for the public and private
sector, generating both financial returns and improving quality of life.
The Western Region has a track record, and decades of experience, on which to build, including
renewable energy installations such as the 10 MW (total) Bear River Hydroelectric System, the 30
MW Digby Neck Wind Project, and the Annapolis Royal Generating Station.
The development of this investment plan involved three distinct components; an engagement
process with targeted stakeholders, the preparation of a baseline inventory and extensive
technical analysis exploring future scenarios.
The technical analysis provides an investment roadmap. The analysis began by considering the
drivers that determine the Region’s energy consumption and greenhouse gas (GHG) emissions,
answering the question “where are we now?” Analysis of future trajectories included a business
as usual (BAU) scenario, which evaluated what might happen if no additional policies or actions
are put in place. A Clean Energy scenario explored the implications of achieving deep GHG
reductions.
Six key opportunities are highlighted:
1. Building retrofits
2. Renewable energy
3. Renewable natural gas
4. Fuel switching in the marine fleet
5. Cellulose insulation
6. Electric vehicles
3
Intergovernmental Panel on Climate Change. (2018). Global warming of 1.5°C. http://www.ipcc.ch/report/sr15/
9ENERGY INVESTMENT PLAN FOR WESTERN NOVA SCOTIA Specific targets have been identified for each of these opportunities, and the size of the required investment and likely job creation is described. Due to grid constraints, It is recommended that new renewable generation such as wind, solar PV, and tidal integrate storage to address the intermittency of supply. Continuous sources of electricity such as small-scale CHP based on biomass should be considered only in locations where all or most of the electricity can be consumed locally rather than exported to the transmission system. Recommendations for implementation include four measures: 1. Regional Roundtable 2. Revolving Loan Fund 3. Renewable Energy Cooperative 4. Electric Vehicle Joint Venture 10
A ROADMAP FOR ADDRESSING CLIMATE CHANGE AND BUILDING THE CLEAN ENERGY ECONOMY

1. Introduction
The Western Regional Enterprise Network (Western REN) is an organisation composed of towns
and municipalities focused on fostering healthy rural and regional economic development. The
region has come together to develop the Western Region Energy Investment Plan (WREIP) in
order to explore and evaluate a path to a clean energy economy.
The World Meteorological Organization reported that 2010 to 2019 was the warmest decade
on record.4 The impacts of these changes in climate, such as increases in temperature extremes,
increases in severe weather events, ocean warming, rising sea levels, thinning glaciers, and
thawing permafrost, have been observed both in Canada and abroad. Past and predicted
warming for Canada, on average, is about double the magnitude of projected global warming.5
Climate risks are a direct function of cumulative emissions, so earlier action will significantly
decrease the cost of future adjustments. As Mark Carney, the former Head of the Bank of Canada
and Bank of England Governor points out, however, “Climate change is the Tragedy of the
Horizon.”6 The catastrophic impacts of climate change will be felt beyond the business cycle, the
political cycle, and the horizon of financial institutions like central banks, reducing the incentive
for substantive action.
To highlight the need for urgent action, Canada’s House of Commons declared a climate
emergency in June 2019, joining countries and major cities around the world, as well as nearly five
hundred Canadian municipalities.
COVID-19 has sent shock waves through society and the economy. As a result, governments are
likely to make a once-in-a-generation investment in the economy.
The WREIP describes an investment program that addresses the underlying climate emergency,
a strategy that diverges from investing public money in infrastructure and technologies that will
be outdated within a decade.7 Building on discussions framed around the notion of build back
better,8 this report provides a blueprint or roadmap for those investments.
The investments include widespread electrification of space heating and transportation,
continuation of the transition to zero-carbon electricity generation and an unprecedented focus
on energy efficiency. Combined, these three aspects will require an injection of capital in a
variety of sectors. This report describes the challenge and opportunity and possible strategies to
facilitate the opportunities.

4
    World Meteorological Organisation. (2020). WMO provisional statement on the state of the global climate in 2019. https://library.wmo.int/
    doc_num.php?explnum_id=10108
5
    For a review of the impacts of climate change in Canada, see: Canada, & Environment and Climate Change Canada. (2019). Canada’s changing
    climate report. http://publications.gc.ca/collections/collection_2019/eccc/En4-368-2019-eng.pdf
6
    Carney, M. (2015). Breaking the Tragedy of the Horizon – climate change and financial stability. bankofengland.
    co.uk/-/media/boe/files/speech/2015/breaking-the-tragedy-of-the-horizon-climate-change-and-financial-stability.
    pdf?la=en&hash=7C67E785651862457D99511147C7424FF5EA0C1A
7
    Hepburn, C., O’Callaghan, B., Stern, N., Stiglitz, J., & Zenghelis, D. (n.d.). Will COVID-19 fiscal recovery packages accelerate or retard progress
    on climate change? Oxford Review of Economic Policy. https://doi.org/10.1093/oxrep/graa015
8
    For example see the webinar series: https://www.corporateknights.com/

                                                                                                                                                          11
ENERGY INVESTMENT PLAN FOR WESTERN NOVA SCOTIA The WREIP includes: 1. An assessment of the current energy context in the region, including consideration of demographics, policies, geography, culture and economy; 2. Modelling of two different energy futures for the region; one aligned with current policies and one which advances the clean energy economy. 3. Identification of opportunities to stimulate and support the development of the local economy. 4. An evaluation of the economic impacts of the transition to a clean energy economy. 12
A ROADMAP FOR ADDRESSING CLIMATE CHANGE AND BUILDING THE CLEAN ENERGY ECONOMY

2. Method
The development of the WREIP involved a combination of energy and emissions modelling,
financial modelling, literature review, and engagement with stakeholders and community
members (Figure 1).

                                                                           Community                           Community
                                                                           Engagement                          Engagement

     Data                              Model                              Future                            Implementation                         Clean Energy
     Collection                        Calibration                        Scenario                          Approach                               Roadmap
                                                                          Development

Figure 1. Project approach

2.1 Scenario Development
Future scenarios for the energy system in the Western Region were developed to support:9
     • decision-making– “future proofing” a portfolio of activities and proposed actions;
     • prioritization – determining where and how to allocate finite resources;
     • ‘testing’ – using multiple “settings” to strengthen an existing strategy, innovation initiative,
       or priority;
     • integrated analysis – applying judgment to complexity for making sense of the world;
     • timing – reacting appropriately (i.e. neither overreacting nor underreacting);
     • scanning – monitoring for deeper shifts in the external environment;
     • anticipatory planning – combating reactive demands; taking affirmative steps to prepare for
       the future; and
     • conversation– talking about difficulties in a safe (hypothetical) way. Two scenarios were
       developed, informed by a situational analysis and an engagement process.
Scenario planning is a powerful method to explore the direct consequences of decisions made
today, which can be costly or in some cases impossible to undo. Figure 2 illustrates the ‘lock-in

9
 Smith, E. (2007). Using a scenario approach: From business to regional futures. Engaging the future: Forecasts, scenarios, plans, and projects,
 79–101.

                                                                                                                                                                  13
ENERGY INVESTMENT PLAN FOR WESTERN NOVA SCOTIA
effect’ as a result of the durability of different categories of investments. Once the investment is
made, it is difficult to undo financially, but also psychologically.
Building appliances
Cars
Industrial equipment
Power plants
Buildings
Urban form
10 20 30 40 50 60 70 80 90 100 100+
Approximate lifetime (years)
Figure 2. Lifetime of capital stocks
Consultation with community members, local businesses, and representatives of public utilities
provided essential input to the development of the scenarios, identifying the priorities, concerns,
and resources within the Western Region. The engagement process identified key industries that
are in flux, or in jeopardy, due to economic and environmental changes within the region and
within the province, and also highlighted the availability of a skilled workforce, and training and
innovation resources at local colleges and the university.
2.2 Modelling
The scenarios were analysed in CityinSight, an energy and emissions model. CityInSight is an
integrated, multi-fuel, multi-sector, spatially-disaggregated energy systems, emissions and
finance model for cities. The model enables bottom-up accounting for energy supply and
demand, including renewable resources, conventional fuels, energy consuming technology
stocks (e.g. vehicles, appliances, dwellings, buildings) and all intermediate energy flows (e.g.
electricity and heat).
CityInSight was populated with local data on energy generation, energy use, emissions
associated with energy consumption, and the costs associated with both the energy and
emissions.
Energy and GHG emissions are derived from a series of connected stock and flow models,
evolving on the basis of current and future geographic and technology decisions/assumptions
(e.g. the rate of adoption of electric vehicles. The model accounts for physical flows (i.e.
energy use, new vehicles by technology, vehicle kilometres travelled) as determined by stocks
(buildings, vehicles, heating equipment, etc).
For any given year out until 2050, CityInSight traces the flows and transformations of energy
from sources through energy currencies (e.g. gasoline, electricity, hydrogen) to end uses (e.g.
personal vehicle use, space heating) to energy costs and to GHG emissions. An energy
14A ROADMAP FOR ADDRESSING CLIMATE CHANGE AND BUILDING THE CLEAN ENERGY ECONOMY
balance is achieved by accounting for efficiencies, conservation rates, and trade and losses at
each stage in the journey from source to end use.
Figure 3. Representation of the integrated energy and emissions model
15ENERGY INVESTMENT PLAN FOR WESTERN NOVA SCOTIA Population and demographics Region-wide population is modelled using the standard population cohort-survival method, disaggregated by single year of age and gender. It accounts for various components of change: births, deaths, immigration and emigration. Residential buildings Residential buildings are spatially located and classified using a detailed set of 30+ building archetypes capturing footprint, height and type (single, double, row, apartment high, apartment low), in addition to year of construction. Coupled with thermal envelope performance and degree-days the model calculates space conditioning energy demand independent of any particular space heating or cooling technology and fuel. Energy service demand then drives stock levels of key service technologies (heating systems, air conditioners, water heaters). These stocks are modelled with a stock-turnover approach capturing equipment age, retirements, and additions - exposing opportunities for efficiency gains and fuel switching, but also showing the rate limits to new technology adoption and the effects of lock-in. Non-residential buildings Non-residential buildings are spatially located and classified by a detailed use/purpose-based set of 50+ archetypes, and the floorspace of these non-residential building archetypes can vary by location. Non-residential floorspace produces waste and demand for energy and water, and also provides an anchor point for locating employment of various types. Passenger Transportation The model includes a passenger transportation sub-model that responds to changes in land use, transit infrastructure, vehicle technology, travel behavior change and other factors. Trips are divided into four types (home-work, home-school, home-other, and non-home-based), each produced and attracted by a combination of spatial drivers (population, employment, classrooms, non-residential floorspace). Trip volumes are specified for each zone of origin and zone of destination pair. For each origin-destination pair trips are shared over walk/bike (for trips within the walkable distance threshold), public transit (for trips whose origin and destination are serviced by transit) and automobile. Following the mode share step, along with a network distance matrix, a projection of total personal vehicles kilometres travelled (VKT) is produced. The energy use and emissions associated with personal vehicles is calculated by assigning VKT to a stock-turnover personal vehicle model. Waste Households and non-residential buildings generate solid waste and wastewater, and the model traces various pathways to disposal, compost and sludge including those which capture energy from incineration and recovered gas. Emissions accounting is performed throughout the waste sub-model. Energy flow and local energy production Energy produced from primary sources (e.g. solar, wind) is modelled alongside energy converted from imported fuels (e.g. electricity generation, district energy, CHP). As with the transportation sub-model, the district energy supply model has an explicit spatial dimension and represents areas served by district energy networks. 16
A ROADMAP FOR ADDRESSING CLIMATE CHANGE AND BUILDING THE CLEAN ENERGY ECONOMY
Finance and employment
Energy related financial flows and employment impacts - while not shown explicitly in Figure
3 - are captured through an additional layer of model logic. Calculated financial flows include
the capital, operating and maintenance cost of energy consuming stocks and energy producing
stocks, including fuel costs. Employment related to the construction of new buildings, retrofit
activities and energy infrastructure is modelled.
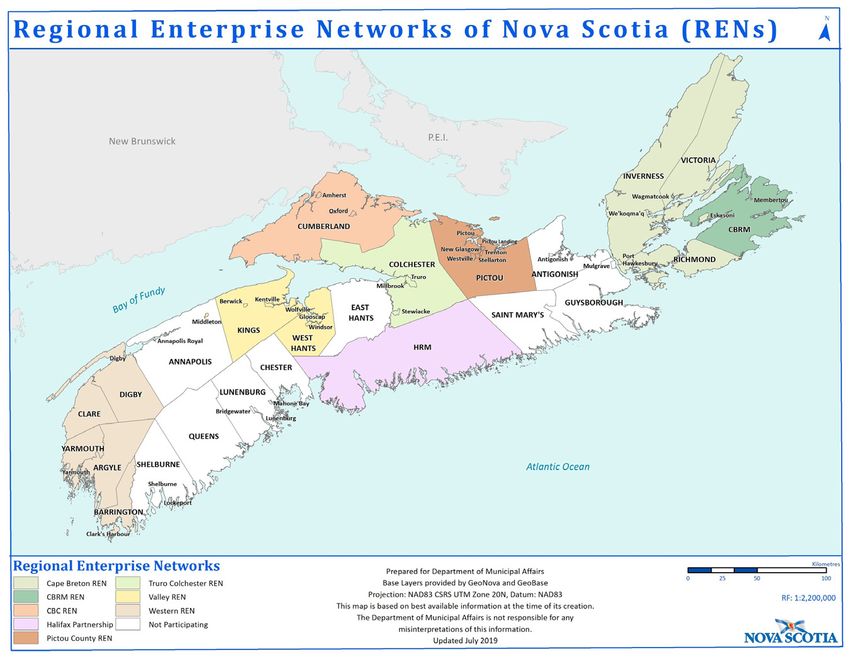
3. The Western Region
The Regional Enterprise Networks are a series of economic partnerships in Nova Scotia with
the goal of fostering sustainable economic development outside of the Halifax Core. The
Western REN is an inter-municipal corporation of seven (7) neighbouring municipal units – the
Municipalities of Argyle, Barrington, Clare, Digby, and Yarmouth, and the Towns of Digby
and Yarmouth. The Western REN receives its operational budget through a matching funding
partnership with the Province of Nova Scotia.
Figure 4. Current REN locations and boundaries.10
The municipalities and towns in the Western Region are predominantly along the coast of the
province, with smaller towns and villages in the Municipal Regions of Yarmouth and Digby more
inland. Due to the location, the Western Region faces climate impacts from sea level rise, storm
surges, flooding and increased precipitation, and strong storms. Flooding events in the region
are anticipated to increase due to sea level rise caused primarily by climate change.11
The communities within the Western Region are predominantly rural, characterised by low-
rise developments and detached housing with concentrations of more urban and dense
10
Department of Municipal Affairs, 2019. Regional Enterprise Networks of Nova Scotia (RENs) map.
11
Municipality of the District of Yarmouth. (2013) “Thriving amidst uncertainty” Municipal Climate Change action plan.
17ENERGY INVESTMENT PLAN FOR WESTERN NOVA SCOTIA
development in the towns of Digby and Yarmouth. Because of the variety of settlement types
included within the Western Region, delivery of services is not uniform across all regions of the
municipality.
Urban settlements are primarily focused around the waterfronts of the Western Region
communities. Urban settlement-designated areas have both municipal water and wastewater
systems. Urban reserve areas have been set aside to ensure a supply of land for urban settlement
with access to water and wastewater services.
Parks, open areas, lakes, agricultural lands, and rural settlements dominate the landscape of the
Western Region. Three major water bodies are adjacent to the Western Region which shape
the communities: The Bay of Fundy, the Gulf of Maine and the Atlantic Ocean. The Bay of Fundy
is directly adjacent to Digby and is the basis of economic and tourist activity. Physically, the Bay
of Fundy is noted as having the largest tides in the world, often draining to the sea bottom and
rising several metres in a single day.
Modest levels of new development occurs equally in rural areas and in larger town centres of
Yarmouth and Digby. Rural resource land use designations are prevalent in the region and are
used to protect natural resources, the culture and heritage of the rural areas, and to support
rural development. The waterfronts and harbours of Western Nova Scotia are a vital economic
resource for the fishery industry and food exports. There are a reported 1,100 companies
in Western Nova Scotia’s waterfront with a growing bio-science fisheries industry, and an
experienced boat building industry.12
The population of the Western Region has fallen from 66,876 people in 2011 to 64,305 in 2016,
a decline of -3.8%. The population centres in the region are the Towns of Yarmouth and Digby.
The Western Region is facing a shortage of young workers and families, and the fastest growing
age cohort is the 65+ year-old group. Because of the demographic trends, communities in the
Western Region are both looking for ways to bring new families to the region and are planning
for services for seniors.
12
Western REN. Why Western Nova Scotia? (2019). Retrieved from http://investinwesternns.com/
18A ROADMAP FOR ADDRESSING CLIMATE CHANGE AND BUILDING THE CLEAN ENERGY ECONOMY
4. The Energy System
4.1 Baseline
ELECTRICITY IN THE WESTERN REGION
The Western Region is supplied with electricity by the provincial electricity utility, Nova Scotia
Power Incorporated (‘NS Power’). NS Power is a private corporation and is regulated by the
Nova Scotia Utility and Review Board. NS Power generates electricity primarily through coal-
fired power plants, with a lesser amount produced through renewable sources. The Tusket
Combustion Turbine, located in the Western Region, has a capacity of 24 MW, and is fueled
by fuel oil, is part of the NS Power generating grid. The Province of Nova Scotia has articulated
its goals for reducing greenhouse gas emissions, in the Renewable Electricity Regulations and
in Bill 213 – The Sustainable Development Goals Act, which commits Nova Scotia to reducing
greenhouse gas emissions by 53% below 2005 levels by 2030, and to reaching a net-zero
carbon footprint by 2050.
The average GHG intensity for electricity generation in Nova Scotia is 600 gCO2 per kWh,
the fourth-highest carbon intensity amongst the provinces in Canada.13 The current fuel mix
for electricity production is dominated by coal and petcoke resulting in a high grid intensity.
Projections to 2021 show a decrease in fossil fuels and an increase in renewable or other sources
with lower GHG intensities as shown under, is shown in Figure 5.
80%
70%
60%
50% Coal and Petcoke
Natural Gas & Oil
40% Wind
Hydro & Tidal
30% Biomass
Other Renewables
20% Imports
10%
0%
2005 2018 2021
Figure 5. Actual 2007 and 2012 energy mix, and projected 2021 energy mix for electricity
generation in Nova Scotia.14
13
Canada Energy Regulator, 2019. Canada’s Energy Future 2019: Energy Supply and Demand Projections to 2040. Government of Canada.
14
Nova Scotia Utility and Review Board, 2018. Nova Scotia Power 10-Year System Outlook. 2018 Report- Revised.
19ENERGY INVESTMENT PLAN FOR WESTERN NOVA SCOTIA
NS Power is currently undertaking an Integrated Resource Plan (IRP), a long-term strategy for
the electricity system required by the NS Utility and Review Board.15 Two of the scenarios being
evaluated by NS Power achieve net zero emissions by 2050.16
RENEWABLE ENERGY
As part of an assessment for renewables, the Canadian Wind Energy Association (CanWEA)
found wind energy to be a major opportunity for the province of Nova Scotia because of strong
winds across the province, and higher rates of production which correlate to peak demand.
The Western Region also has some of the country’s highest-value wind resources making wind
energy the lowest-cost option for renewable electricity supply in Atlantic Canada.17 The Western
Region has several initiatives underway to make use of the wind resource 74.05 MW of energy
(Table 1).
Table 1. Current Wind Energy in the Western Region (2019)18
LOCATIONS # OF TURBINES POWER GENERATED (MW)
DIGBY 1 0.05
MOUNT PLEASANT 1 0.8
GULLIVERS COVE 20 30
UNIVERSITE
SAINTE-ANNE 2 0.1
GRAND PASSAGE 1 0.9
LITTLE BROOK 1 0.6
BRENTON 1 1.99
WELLINGTON 2 0.1
BLACK POND 1 1.99
LITTLE RIVER 1 1.99
WEDGEPORT 1 1.68
SHAG HARBOUR 2 3.2
BARRINGTON
PASSAGE 1 0.05
PUBNICO POINT 17 30.6
TOTAL 52 74.05
The Annapolis Royal Generating Station Tidal energy is the only functioning tidal generation
station in North America, with a capacity of 20 MW.19
15
For more information on the IRP, see: https://irp.nspower.ca/document-library/
16
NS Power (2020). April 28, 2020. Interim Modelling Update Workshop. Retrieved from: https://irp.nspower.ca/files/key-documents/
presentations/Interim-Modeling-Update-Workshop-2020-04-28.pdf
17
Western REN (2017) Investment Opportunities & Strategies.
18
Data provided by Western REN.
19
Nova Scotia Power Inc. 2019. Hydro and Tidal Power. Accessed May 2020. https://www.nspower.ca/clean-energy/renewable-energy-
sources/tidal-power
20A ROADMAP FOR ADDRESSING CLIMATE CHANGE AND BUILDING THE CLEAN ENERGY ECONOMY
A number of smaller hydroelectric generating stations are found in the Western Region, including
in Tusket (2.7 MW), Sissiboo (24 MW), and Bear River (13 MW), which all feed into the NSPI
electricity grid.
THE ELECTRICITY GRID
Several NS Power 69kV transmission lines (L5531, L5532 (which connects with L5541), L5533,
and L5026) converge at Bear River near Digby (Figure 6). It is understood that if one line becomes
overloaded, it is possible that protection and control equipment would cause the remaining two
lines to trip, resulting in a wide blackout of Western Nova Scotia. NS Power has stated that the
three lines are at or near the limit of their capacities.20
Figure 6. Electricity grid transmissions lines used by Nova Scotia Power, showing the capacity of
the lines in Western REN.21
In 2012, NS Power estimated that the cost of upgrading approximately seventy km of one of the
69kV lines was $7 million.22
20
Nova Scotia Power. March 2, 2012. Interconnection Feasibility Study Report GIP-IR378-FEAS-R1 Generator Information Request 378. 17pp
21
Nova Scotia Power, 2020. How we deliver electricity. Accessed May 2020. https://www.nspower.ca/about-us/electricity/delivering
22
Nova Scotia Power. March 2, 2012. Interconnection Feasibility Study Report GIP-IR378-FEAS-R1 Generator Information Request 378. 17pp.
21ENERGY INVESTMENT PLAN FOR WESTERN NOVA SCOTIA 5. The Energy Opportunity 5.1 Guiding principles This report identified the opportunities and investments available to the Western Region, emphasising those projects which support the local communities, economy, and environment. Community-based investment opportunities enable the region to become more financially independent and resilient. The guiding principles behind the development and investment plan include: 1. Local ownership and investment- by emphasizing opportunities within the local communities, employment opportunities will increase, and the communities will become more financially independent. 2. Economic diversity- by investing in a variety of industries and opportunities, the communities will be better able to withstand market fluctuations. 3. Innovation- The Western REN encompasses secondary education campuses, fertile options for renewable energy generation, and a workforce in transition from forest industries. By emphasizing innovation, the region can identify niches for economic growth within the region. 4. Social equity- Any economic strategy will best serve the communities if it emphasizes social equity as a key decision-making tool. Ensuring that vulnerable populations are included in community development will result in a more stable and resilient population. 5. Practical- By selecting opportunities that are practical, in terms of the technologies and economics, the project will be more likely to succeed, and thereby provide employment and stability to the region. 6. Locally appropriate- The local environment, culture, history, and people of western Nova Scotia must be at the heart of any development opportunities. 7. Consider climate- Climate change considerations, both in terms of mitigation of GHGs, and adaptation to projected climate impacts, must be central to all developments and opportunities for the region. 5.2 Scenarios Two scenarios were developed to evaluate the future energy system for the Western Region. A BAU scenario reflects the implementation of current plans, as defined in Table 2. A second scenario, the Clean Energy scenario, evaluates a wide range of zero emissions or low carbon investments in the Region. The actions and assumptions for each scenario are described in Table 2. A framework of reduce, improve and switch is used to help frame the actions in the Clean Energy scenario. This approach is adapted from similar approaches such as the well-known Reduce- Reuse-Recycle (from the waste sector), and Avoid-Shift-Improve (from the transportation sector). The focus is first on reducing or avoiding consumption of energy, secondly improving the efficiency of the energy system (supply and demand), and finally fuel switching to low carbon 22
A ROADMAP FOR ADDRESSING CLIMATE CHANGE AND BUILDING THE CLEAN ENERGY ECONOMY

or zero carbon renewable sources. This approach minimizes the cost of the energy transition
by avoiding installing capacity that is not subsequently required as a result of energy efficiency
measures, for example.
Through technical analysis, research, and input from stakeholders and the consulting team,
dozens of energy and emissions actions were vetted. The actions were modelled in CityInSight
and a final suite of 25 actions were evaluated for the Clean Energy scenario. The actions are
grouped into four general strategies:
  • Energy efficient buildings. Accounting for 51% of emissions in 2016, (29% of emissions in
    2050) and 32% of the total energy consumption in 2016 (38% by 2050), building retrofits
    are essential to reducing the energy demand of the Western Region. This strategy involves
    making deep energy retrofits to all buildings in the community and ensuring that new
    buildings are built to superior energy standards.
  • Low-carbon transportation for residents and visitors. On-land transportation accounts
    for 38% of the total energy consumption in 2016, and marine transportation accounts
    for a further 30% of energy consumption. This strategy focuses on vehicle electrification,
    increasing and improving public transit services, and fuel switching in marine vessels to
    reduce reliance on fossil fuels.
  • Local clean energy generation. Energy for buildings and vehicles can increasingly be
    produced locally. Waste represents 1% of the total GHG emissions shift in 2016. This
    strategy uses waste to generate energy, minimizes fugitive emissions, and provides locally
    generated electric and thermal power to reduce the use of natural gas and fossil fuel
    powered grid electricity.
  • Marine energy demands account for 38% of the total energy demand in 2050, and 38% of
    emissions.

Table 2. Actions modelled to reduce energy and emissions in the Region

                                                                         CLEAN ENERGY SCENARIO ACTIONS AND
                            BAU ACTIONS AND ASSUMPTIONS
                                                                         ASSUMPTIONS

 DEMOGRAPHICS

        Population and      No net growth, population and                No net growth, population and employment
        employment          employment projections held constant.        projections held constant.
 EXISTING BUILDINGS

                                                                                                                    23
ENERGY INVESTMENT PLAN FOR WESTERN NOVA SCOTIA
CLEAN ENERGY SCENARIO ACTIONS AND
BAU ACTIONS AND ASSUMPTIONS
ASSUMPTIONS
1 Retrofit single- Existing building stock efficiency unchanged; Energy for space heating decreases by 50% and
family residential efficiency held constant from 2016-2050 electricity demand decreases by 50% in 75% of
homes buildings by 2030. By 2050 an additional 15% of
buildings meet this standard.
2 Retrofit multi-
unit residential
buildings
3 Retrofit
commercial
buildings
4 Retrofit
institutional
buildings
5 Retrofit
municipal
buildings
6 Retrofit industrial
buildings
7 Industry Efficiency held constant Efficiency
process motors/
efficiency
improvements
8 Residential 99% of heat systems are replaced with the 50% of energy needed for space heating is electric
space heating same technology at end of life; 1% of heat (heat pumps) by 2030. Heat pumps also provide
systems are replaced with resistance heating cooling.
at end of life
9 Residential water 99% of water heaters are replaced with the 50% of water heating in residential buildings is
heating same technology at end of life;1% of water electric (using CO2 heat pump water heater) by 2030
heaters are replaced with electric tank water
heaters at end of life
10 Non-residential Fuel shares held constant 50% of space heating is electric (using heat pumps,
space heating split between 50% geothermal and 50% air source),
and 25% is by biomass boiler, by 2030.
50% of space cooling is electric (heat pumps) by
2030, with heat pumps replacing older AC units.
11 Non-residential Fuel shares held constant 50% of water heating is electric and 25% by biomass
water heating boiler by 2030
LOW OR ZERO CARBON ENERGY GENERATION (SITE/BUILDING SCALE)
12 Solar PV No solar PV on residential buildings Scale up solar rooftop pv generating capacity to
- existing match 30% of electricity demand in residential 2030
residential (a total of 44 MW installed by 2030)
13 Solar PV - No solar PV on non-residential buildings
existing non-res
14 Energy storage No battery storage in residential buildings 100% of installed solar PV on residential [above]
- residential includes storage, split between 50% thermal storage
and 50% batteries
24A ROADMAP FOR ADDRESSING CLIMATE CHANGE AND BUILDING THE CLEAN ENERGY ECONOMY
CLEAN ENERGY SCENARIO ACTIONS AND
BAU ACTIONS AND ASSUMPTIONS
ASSUMPTIONS
15 Energy storage No battery storage in non-residential 100% of installed solar PV on non-residential
- non-residential buildings buildings [above] includes storage, split between
25% thermal storage + 75% batteries
LOW OR ZERO CARBON ENERGY GENERATION (COMMUNITY SCALE)
16 Utility-scale No utility-scale ground mount solar Scale up ground mount solar pv from 2031 to 2050
solar PV - ground to match 33% of remaining imported electricity in
mount 2050 ( a total of 110 MW installed by 2050)
17 Onshore wind 5.734 kW COMFIT wind capacity Scale up ground mount solar pv from 2031 to 2050
to match 67% of remaining imported electricity in
2050 (a total of 221 MW installed by 2050)
20 Energy storage No utility scale storage 100% of installed ground mount solar PV includes
- utility ground battery storage
mount solar pv
21 Energy storage No utility scale storage 100% of installed wind includes battery storage
- wind
TRANSIT
22 Electrify transit No electric transit buses 100% electric by 2030
VEHICLES
23 Electrify No EVs in municipal fleet 100% electric by 2030
municipal fleets
24 Electrify By 2050 10% of new vehicles are EV or hybrid Scales up so that 30% of new vehicle sales are EVs by
personal 2030, and 80% by 2040
vehicles
25 Electrify No VKT allocated to EVs
commercial
vehicles
26 Marine vehicles All marine fuel use is diesel Ferries: Starting in 2025, scales up so that by 2030:
fuel switch 60,000 GJ of CNG displaces diesel
7,800 GJ/year of biodiesel displaces diesel
Fishing: Starting in 2035, scales up so that by 2045:
50% of diesel engines in fishing vessel fleet is
replaced by hydrogen
50% of diesel engines in fishing vessel fleet is
replaced by electric battery
WASTE
27 Waste diversion Waste diversion rate held constant 90% of residential and ICI waste diverted by 2030
WATER AND WASTEWATER
28 Water & WW Water and wastewater per capita rates Reduce water & WW treatment & pumping
energy
held constant energy use 25% by 2030
25ENERGY INVESTMENT PLAN FOR WESTERN NOVA SCOTIA
6. The Clean Energy Economy
Marine transportation, on-road transportation, and the residential sector shape the energy profile
of the Western Region, representing approximately 80% of consumption from 2016 to 2050.
Actions in the building sector include deep energy retrofits, fuel switching heating and water
systems to electricity, and improving industrial process energy use. These actions collectively
achieve a reduction of approximately 5,580 kilotonnes of carbon dioxide equivalent (ktCO2e)
from 2020 to 2050. In terms of energy consumption, there is a cumulative reduction of nearly
32,000 TJ as a result of the actions, and nearly 1,400 TJ reduction per year by 2050.
The electrification of transit, municipal, commercial and personal vehicles provides an additional
956 ktCO2e of cumulative emissions reductions by 2050 (“Electrify transportation” wedge in
Figure 7).
Marine transportation is projected to shift away from diesel fuel, replaced with compressed
natural gas in ferries, and hydrogen, electric batteries, and a small amount of biodiesel in fishing
vessels.
Energy consumption by ferries stays relatively constant, with a 10% decrease in GHG emissions
from 2016 to 2050. Fishing vessel fuel switching results in a 50% decrease in total energy
consumption, and a 99% decrease in GHG emissions.
The total impact of new renewable electricity generation reaches nearly 3,200 ktCO2e
cumulative reductions by 2050 (110 KtCO2e per year). This new carbon-free generation consists
of rooftop solar photovoltaics (PV), larger-scale solar and wind installations.
3
2.5
2
GJ (millions)
1.5 Local Electricity
Imported Electricity
1
0.5
0
2020 2025 2030 2035 2040 2045 2050
Figure 7. Local vs imported (grid) electricity in the Western Region, 2020-2050.
The following wedge diagrams illustrate the effect of the low carbon actions as they shape the
energy and GHG emissions profile of the Western Region.
26A ROADMAP FOR ADDRESSING CLIMATE CHANGE AND BUILDING THE CLEAN ENERGY ECONOMY
27ENERGY INVESTMENT PLAN FOR WESTERN NOVA SCOTIA
1,000
1,067 ktCO2e (2020)
900
800
700
600
KtCOe
500
400
300
200
100
0
2020 2025 2030 2035 2040 2045
Figure 8. The impact on GHG emissions of the actions in the Clean Energy scenario relative to the BAU,
2020- 2050
28A ROADMAP FOR ADDRESSING CLIMATE CHANGE AND BUILDING THE CLEAN ENERGY ECONOMY
Retrofit single-family homes, 2031-2050
Retrofit multi-Unit Residential B uildi ngs, 2031-2050
Retrofit commercial buil dings, 2031-2050
Retrofit institutional buildings, 2031-2050
Retrofit municipal buildings, 2031-2050
Retrofit industrial buildings, 2031-2050
Industrial process motor & efficiency improvements
Residential heat pumps for space cooling
Residential water heating efficiency
Non-residential space heating & space cooling efficiency improvements
Non-residential water heating - efficiency improvements
Add Solar PV to existing res. buildings
Add Solar PV to existing non-res. buildings
Electrify transit
Electrify municipal fleets
Electrify personal vehicles
Electrify commercial vehicles
Increase waste diversion
131 KtCO2e Increase water and wastewater pumping energy efficiency
(2050) Marine vessel fuel switching
Utility-scale Solar PV
Onshore wind Energy
2050
Carbon Gap
29ENERGY INVESTMENT PLAN FOR WESTERN NOVA SCOTIA
12,000
10,283 TJ (2020)
10,000
8,000
TJ
6,000
4,000
2,000
0
2020 2025 2030 2035 2040 2045
Figure 9. The impact on energy of the actions in the Clean Energy scenario relative to the BAU,
2020- 2050
30A ROADMAP FOR ADDRESSING CLIMATE CHANGE AND BUILDING THE CLEAN ENERGY ECONOMY
Retrofit single-family homes, 2031-2050
Retrofit multi-unit residential b u ildi ngs, 2031-2050
Retrofit commercial buil dings, 2031-2050
Retrofit institutional buildings, 2031-2050
Retrofit municipal buildings, 2031-2050
Retrofit industrial buildings, 2031-2050
Industrial process motor & efficiency improvements
Residential heat pumps for space cooling
Residential water heating efficiency
Non-residential space heating & space cooling efficiency improvements
Non-residential water heating - efficiency improvements
Add Solar PV to existing res. buildings
Add Solar PV to existing non-res. buildings
4,910 TJ (2050)
Electrify transit
Electrify municipal fleets
Electrify personal vehicles
Electrify commercial vehicles
Increase waste diversion
Increase water and wastewater pumping energy efficiency
Marine vessel fuel switching
Utility-scale Solar PV
Onshore wind Energy
2050
Energy Gap
31ENERGY INVESTMENT PLAN FOR WESTERN NOVA SCOTIA
Table 3. Cumulative reduction in energy consumption by action. Note that these reductions
are a result of the interaction between actions, so implementation of single actions would
result in less reduction in energy use.
CUMULATIVE ENERGY USE REDUCTIONS IN 5 YEAR
INTERVALS (TJ)
ACTION 2020 2025 2030 2035 2040 2045 2050
Retrofit single-family
residential homes 0 138 637 612 646 667 707
Retrofit multi-unit residential
buildings 0 4 16 16 17 17 18
Retrofit commercial buildings 0 73 319 309 316 326 339
Retrofit institutional buildings 0 6 27 28 29 30 32
Retrofit municipal buildings 0 5 23 24 25 25 26
Retrofit industrial buildings 0 11 23 24 25 26 27
Industry process motors/
efficiency improvements 0 29 56 61 61 61 61
Residential space heating 0 1 -1 -9 -7 -8 -8
Residential water heating 0 38 120 217 235 231 229
Non-residential space
heating 0 -4 5 17 13 18 16
Non-residential water
heating 0 3 18 21 21 20 20
Solar PV - existing residential 0 0 0 0 0 0 0
Solar PV - existing non-res 0 0 0 0 0 0 0
Energy storage - residential 0 0 0 0 0 0 0
Energy storage - non-res 0 0 0 0 0 0 0
Electrify transit 0 1 2 2 2 2 2
Electrify municipal fleets 0 0 2 5 6 6 6
Electrify personal vehicles 0 4 66 255 483 635 686
Electrify commercial vehicles 0 10 79 211 375 519 599
Waste diversion 0 0 0 0 0 0 0
Water & WW energy 0 5 12 12 12 12 12
Marine vehicles fuel switch 0 0 0 50 536 1022 1022
Utility-scale solar PV - ground
mount 0 0 0 0 0 0 0
Onshore wind 0 0 0 0 0 0 0
Energy storage - utility
ground mount solar pv 0 0 0 0 0 0 0
Energy storage - wind 0 0 0 0 0 0 0
32A ROADMAP FOR ADDRESSING CLIMATE CHANGE AND BUILDING THE CLEAN ENERGY ECONOMY
6.1 Energy Consumption
12
10.0
10
8.7
8
GJ (millions)
6 Clean Energy
4.9 BAU
4
2
0
2020 2025 2030 2035 2040 2045 2050
Figure 10. Total energy consumption, 2020-2050, for the BAU and Clean Energy scenarios
The results of the modelling indicate that by applying the actions described in section 5, overall
energy consumption decreases by 52% between 2020 and 2050.
Marine transportation represents the largest consumer of energy by 2050, accounting for 38%
of the energy use by 2050 in the clean energy scenario. On-road transportation accounts for a
further 25% of all energy use in the clean energy scenario.
Transportation, both land and marine, accounts for nearly two thirds of the energy consumption
in the Region in 2050.
12
10
8 Industrial
GJ (millions)
Commercial
6 Residential
Marine Transportation
4 OnRoad Transportation
BAU
2
0
2020 2025 2030 2035 2040 2045 2050
Figure 11. Projected energy consumption (million GJ) by sector in the Clean Energy scenario,
2050-2050.
33ENERGY INVESTMENT PLAN FOR WESTERN NOVA SCOTIA
12
Hydrogen
10 Other
RNG
8 Geothermal
GJ (millions)
Local Electricity
6 Propane
Wood
OnRoad Diesel
4
Fuel Oil
Imported Electricity
2
Gasoline
Marine Diesel
0
2020 2025 2030 2035 2040 2045 2050
Figure 12. Projected energy consumption (million GJ) by fuel in the Clean Energy scenario,
2050-2050.
Energy consumption decreases by 57% in the residential sector, 70% in the on-road
transportation sector, and 7% in the commercial sector. The building energy savings are primarily
due to building improvements from retrofits, as well as switching to more energy-efficient heating
systems. Conversion to EVs, and improvements in the efficiency of combustion vehicles account
for the reduction in energy use in the on-road transportation sector.
Local energy production replaces imported energy production, and this electricity is used in all
sectors.
Energy consumption is reduced by more than 50% in most sectors by 2050.
250
208
200
180
150
GJ/person
107
100
50
0
2016 2050 BAU 2050 LE
Figure 13. Energy consumption per capita in the BAU and Clean Energy scenarios (GJ/person),
2050 & 2050.
34A ROADMAP FOR ADDRESSING CLIMATE CHANGE AND BUILDING THE CLEAN ENERGY ECONOMY
The per capita energy consumption decreases by 49% between 2016 and 2050 in the LE
scenario.
The full breakdown of total energy consumption is shown in table A1.
6.2 GHG Emissions
Community emissions decrease by 88% between 2016 and 2050 in the low energy scenario,
with significant decreases across all sectors. This decrease is primarily due to building retrofits,
vehicle improvements, and fuel-switching to electricity and hydrogen. The electricity grid
improves over time as lower-carbon fuel sources come on line. Additionally, the Region switches
to locally-produced renewable electricity, reducing the dependence on the provincial grid, and
further reducing GHG emissions.
1
Waste
0.9
0.8 Industrial
tonnes CO2e (millions)
0.7
Commercial
0.6
Marine Transportation
0.5
0.4 On Road Transportation
0.3
Residential
0.2
BAU
0.1
0
2020 2025 2030 2035 2040 2045 2050
Figure 14. GHG emissions (MtCO2e) by sector in the Clean Energy scenario, 2020-2050.
Per capita emissions decrease over this same period by 87%, decreasing from 21.6 tCO2e/
person in 2016 to 2.7 tCO2e/person in 2050. The full details of the GHG emissions by sector and
fuel type are shown in Table A2.
1
0.9
0.8 Propane
0.7 Other
tonne CO2e (millions)
0.6 Wood
OnRoad Diesel
0.5
Gasoline
0.4 Marine Diesel
0.3 Fuel Oil
Imported Electricity
0.2
BAU
0.1
0
2020 2025 2030 2035 2040 2045 2050
Figure 15. GHG emissions (MtCO2e) in the Clean Energy scenario by source, 2020-2050.
35ENERGY INVESTMENT PLAN FOR WESTERN NOVA SCOTIA
30
21.6
20
tCO2e/person
16.2
10
2.7
0
2016 2050 BAU 2050 LE
Figure 16. GHG emissions per capita (tCO2e/person) in the Clean Energy and BAU scenarios.
Per capita GHG emissions decrease by 87% to 2.7 tCO2e by 2050.
6.3 Buildings
GHG emissions from buildings are a function of the total quantity of floor space (m2), the energy
intensity of building operations (MJ/m2), and the carbon intensity of the fuel and electricity supply
(GHG emissions/MJ).
Energy use in buildings accounts for 339 million GJ of energy in 2016, decreasing by 43% to 1.8
million GJ by 2050 in the low energy scenario. The largest decrease is seen in the residential
sector, as a result of building retrofits, and changing to more efficient space and water heating
systems (heat pumps).
3.5
3
2.5
Geothermal
Local Electricity
GJ (millions)
2
Propane
Wood
1.5
Fuel Oil
Imported Electricity
1 BAU
0.5
0
2020 2025 2030 2035 2040 2045 2050
Figure 17. Energy use in buildings (million GJ) by fuel in the Clean Energy scenario, 2020-2050.
36A ROADMAP FOR ADDRESSING CLIMATE CHANGE AND BUILDING THE CLEAN ENERGY ECONOMY
3.5
3
2.5 Space Cooling
Major Appliances
GJ (millions)
2 Lighting
Plug Load
1.5 Industrial Manufacturing
Water Heating
1 Space Heating
BAU
0.5
0
2020 2025 2030 2035 2040 2045 2050
Figure 18. Energy use in buildings (million GJ) by end use in the Clean Energy scenario,
2020-2050.
Space heating and water heating show the biggest declines between 2016 and 2050,
decreasing by 61% and 67%, respectively. This decrease is a result of building retrofits to reduce
heating needs, a decrease in heating degree days from a warming climate, and switching to heat
pumps and more efficient heating and water heating systems.
The proportion of primary energy consumed by households in the form of electricity has
increased from 23.5% in 1990 to 36.8% in 2017. This represents an increase of 33%.23 Locally-
produced renewable electricity is used within the region where it is generated. By switching to
electricity for space and water heating, the use of fuel oil and wood decreases.
Energy consumption declines across all building types in the Clean Energy scenario.
2.5
2
1.5 Wood
GJ (millions)
Propane
Local Electricity
1
Imported Electricity
Geothermal
0.5 Fuel Oil
0
2016 2050 2050 LE 2016 2050 2050 LE 2016 2050 2050 LE
BAU BAU BAU
Commercial Industrial Residential
Figure 19. Energy use in buildings (million GJ) by building type and fuel in the BAU and Clean
Energy scenarios.
23
Natural Resources Canada. National Energy Use Database. Residential Sector, Nova Scotia, Table 1: Secondary Energy
Use and GHG Emissions by Energy Source. http://oee.nrcan.gc.ca/corporate/statistics/neud/dpa/showTable.
cfm?type=CP§or=res&juris=ns&rn=1&page=0 accessed March 1, 2020.
37ENERGY INVESTMENT PLAN FOR WESTERN NOVA SCOTIA
2.5
2
Water Heating
1.5
GJ (millions)
Space Heating
Space Cooling
1 Plug Load
Major Appliances
Lighting
0.5 Industrial Manufacturing
0
2016 2050 2050 LE 2016 2050 2050 LE 2016 2050 2050 LE
BAU BAU BAU
Commercial Industrial Residential
Figure 20. Energy use in buildings (million GJ) by building type and end use in the BAU and Clean
Energy scenarios.
100
88.99
81.05
80
GJ/Household
60
38.24
40
20
0
2016 2050 BAU 2050 LE
Figure 21. Residential energy per household (GJ/household) in the Clean Energy and BAU
scenarios.
Residential energy consumption decreases 57% between 2016 and 2050 in the low energy
scenario. This is due to the reduction in space and water heating costs from home retrofits, and
conversion to efficient appliances and heating systems.
The full details of the building energy use can be seen in Table A3.
Household energy consumption declines by 57% by 2050.
38A ROADMAP FOR ADDRESSING CLIMATE CHANGE AND BUILDING THE CLEAN ENERGY ECONOMY
0.5
0.45
0.4
0.35
tonne CO2e (millions)
0.3 Propane
Wood
0.25
Fuel Oil
0.2 Imported Electricity
BAU
0.15
0.1
0.05
0
2020 2025 2030 2035 2040 2045 2050
Figure 22. GHG emissions (Mt CO2e) from buildings by source in the Clean Energy scenario,
2050-2050.
0.5
0.45
0.4
0.35 Space Cooling
tonne CO2e (millions)
Major Appliances
0.3 Lighting
0.25 Industrial Manufacturing
Plug Load
0.2
Space Heating
0.15 Water Heating
BAU
0.1
0.05
0
2020 2025 2030 2035 2040 2045 2050
Figure 23. GHG emissions (Mt CO2e) from buildings by end use in the Clean Energy scenario,
2050-2050.
GHG emissions from buildings decrease by 93% between 2016 and 2050 in the Clean
Energy scenario. This is a result of switching away from emission-intensive fuels like fuel oil and
woodstoves, as well as improvements to the provincial electricity grid. Coupled with this is the
switch to locally-generated renewable electricity, reducing the need for grid electricity.
Because of the fuel-switching to electricity, and then switching to locally-produced electricity,
GHG emissions from residential buildings are reduced dramatically in residential buildings, from
314 kt CO2e of GHG emissions in 2016 to 14.5 kt CO2e in 2050.
39You can also read