Energy Investor Presentation - September 2020 - ARC Resources
←
→
Page content transcription
If your browser does not render page correctly, please read the page content below

Creating
energy
   for the world

                   Investor
                   Presentation
                   September 2020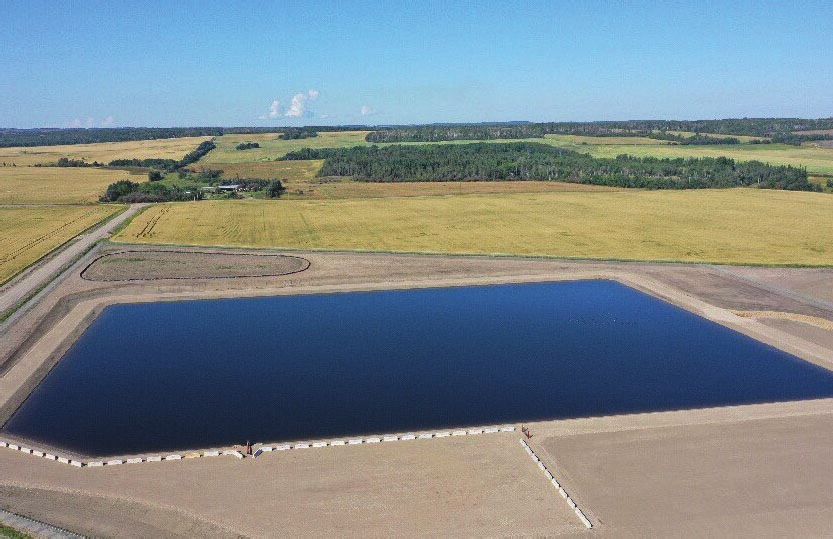
Advisory Statements
Forward-looking Information and Statements and Advisory Statements
This presentation contains forward-looking information as to ARC’s internal projections, expectations, or beliefs relating to future events or future performance and includes information as to ARC’s future well inventory in its core
areas, its exploration and development drilling and other exploitation plans for 2020 and beyond, and related production expectations, expenditures and cash flows, the Company’s plans for constructing and expanding facilities, the
volume of ARC's crude oil and natural gas reserves and the volume of ARC's crude oil and natural gas resources in the Montney, the recognition of additional reserves and the capital required to do so, the life of ARC's reserves, the
volume and product mix of ARC's crude oil and natural gas production, future results from operations, and operating metrics. These statements represent Management’s expectations or beliefs concerning, among other things,
future operating results and various components thereof or the economic performance of ARC. The projections, estimates, and beliefs contained in such forward-looking statements are based on Management's assumptions relating
to the production performance of ARC’s crude oil and natural gas assets, the cost and competition for services, the continuation of ARC’s historical experience with expenses and production, changes in the capital expenditure
budgets, future commodity prices, continuing access to capital, and the continuation of the current regulatory and tax regime in Canada, and necessarily involve known and unknown risks and uncertainties, such as changes in crude
oil and natural gas prices, infrastructure constraints in relation to the development of the Montney, risks associated with the degree of certainty in resource assessments, and including the business risks discussed in ARC’s annual
and quarterly Management’s Discussion and Analysis and other continuous disclosure documents, and related to Management’s assumptions, which may cause actual performance and financial results in future periods to differ
materially from any projections of future performance or results expressed or implied by such forward-looking statements. Accordingly, readers are cautioned that events or circumstances could cause actual results to differ
materially from those predicted. Other than the 2020 Guidance, which is discussed quarterly, ARC does not undertake to update any forward-looking information in this document whether as to new information, future events, or
otherwise except as required by securities laws and regulations.
ARC has adopted the standard of six thousand cubic feet (“Mcf”) of natural gas to one barrel (“bbl”) of crude oil ratio when converting natural gas to barrels of oil equivalent ("boe"). Boe may be misleading, particularly if used in
isolation. A boe conversion ratio of 6 Mcf:1 bbl is based on an energy equivalency conversion method primarily applicable at the burner tip and does not represent a value equivalency at the wellhead. Given that the value ratio
based on the current price of crude oil as compared to natural gas is significantly different than the energy equivalency of the 6 Mcf:1 bbl conversion ratio, utilizing the 6 Mcf:1 bbl conversion ratio may be misleading as an indication
of value.
Throughout this presentation, crude oil refers to tight, light, medium, and heavy crude oil product types as defined by National Instrument 51-101 Standards of Disclosure for Oil and Gas Activities (“NI 51-101”). ARC’s production of
heavy crude oil is considered to be immaterial. Natural gas refers to shale gas and conventional natural gas product types as defined by NI 51-101. ARC’s production of conventional natural gas is considered to be immaterial.
ARC’s core producing properties that are considered to be shale gas include Attachie, Dawson, Parkland (including parts of Tower), and Sunrise, and as such, natural gas, condensate, and natural gas liquids (“NGLs”) are
disclosed. ARC’s core producing properties that are considered to be tight oil include Ante Creek and parts of Tower, and as such, crude oil, natural gas, and NGLs are disclosed. ARC’s core producing property that is considered to
be light crude oil is Pembina, and as such, crude oil, natural gas, and NGLs are disclosed.
Throughout this presentation, when condensate is disclosed, it is done so as it is the product type that is measured at the first point of sale. As per the Canadian Oil and Gas Evaluation (“COGE”) Handbook, condensate is a by-
product of the NGLs product type. NGLs by-products include ethane, butane, propane, and pentanes-plus (condensate).

Non-GAAP Measures
Throughout this presentation, ARC uses the terms netback and return on average capital employed (“ROACE”) to analyze financial and operational performance. These non-GAAP measures do not have any standardized meaning
prescribed under International Financial Reporting Standards (“IFRS”) and therefore may not be comparable to similar measures presented by other issuers.
Netback
ARC calculates netback on a total and per boe basis as commodity sales from production less royalties, operating, and transportation expense. ARC discloses netback both before and after the effect of realized gain or loss on risk
management contracts. Realized gain or loss represent the portion of risk management contracts that have settled in cash during the period and disclosing this impact provides Management and investors with transparent measures
that reflect how ARC’s risk management program can impact its netback. Management believes that netback is a key industry benchmark and a measure of performance for ARC that provides investors with information that is
commonly used by other oil and gas producers. The measurement on a per boe basis assists Management with evaluating operational performance on a comparable basis.
Return on Average Capital Employed
ARC calculates ROACE, expressed as a percentage, as net income (loss) plus interest and total income tax expense (recovery) divided by the average of the opening and closing capital employed for the 12 months preceding
period end. Capital employed is the total of net debt plus shareholders’ equity. ROACE since inception is the annual average net income (loss) plus interest and total income tax expense (recovery) for the years 1996 to 2020 YTD
divided by the average of the opening and closing capital employed over the same period. Refer to the "Capital Management" note in ARC’s financial statements for additional discussion on net debt. ARC uses ROACE as a
measure of long-term operational performance, to measure how effectively Management utilizes the capital it has been provided and to demonstrate to shareholders the sustainability of its business model and that capital has been
invested profitably over the long term.

 Corporate Profile
                                             Corporate Summary                                                                                                       Asset Snapshot
                  H1 2020 Production                                2019 Proved + Probable Reserves
                                                                                                                                                      BC     AB                                         ARC holds ~1,000 net
                                                                                                                                                                                                           Montney sections
                             8% 5%                                                      9% 6%                                                                                                              (~636,000 acres)
                      10%                                                            9%
                                                                                                                                       Attachie

                      159 Mboe/day                                                   910 MMboe

                              77%                                                           76%
                                                                                                                                                             Greater
          Crude oil                                                    Crude oil                                                                           Dawson Area
          Condensate                                                   Condensate and pentanes plus                                      Greater
          NGLs                                                         NGLs                                                            Sunrise Area
          Natural gas                                                  Natural gas
                                                                                                                                                                                      Ante Creek
  Founded July 11, 1996
  Ticker symbol                                                                                     TSX : ARX
  Average daily trading volume (1)                                                                  4.3 million
  Shares outstanding                                                                                353 million
  Enterprise value (2)                                                                              $3.3 billion
  Net debt as at June 30, 2020 (3)                                                                  $961.1 million
  Net debt to funds from operations (3)(4)                                                          1.5 times
  Quarterly dividend                                                                                $0.06/share                                                                                                 Pembina
  Dividends paid since inception                                                                    $6.6 billion
  (1)   Average daily trading volume for the six months ended August 31, 2020.
  (2)   Market capitalization as at August 31, 2020 and net debt as at June 30, 2020.
  (3)   Refer to the “Capital Management” note in ARC’s financial statements.
  (4)   Based on net debt as at June 30, 2020 and annualized funds from operations for the six months ended June 30, 2020.

ARC Is a Canadian Oil and Gas Producer in Its 24th Year of Delivering on Its Disciplined, Returns-focused Value Proposition

08/31/2020                                                                                                                                                                                                                                     1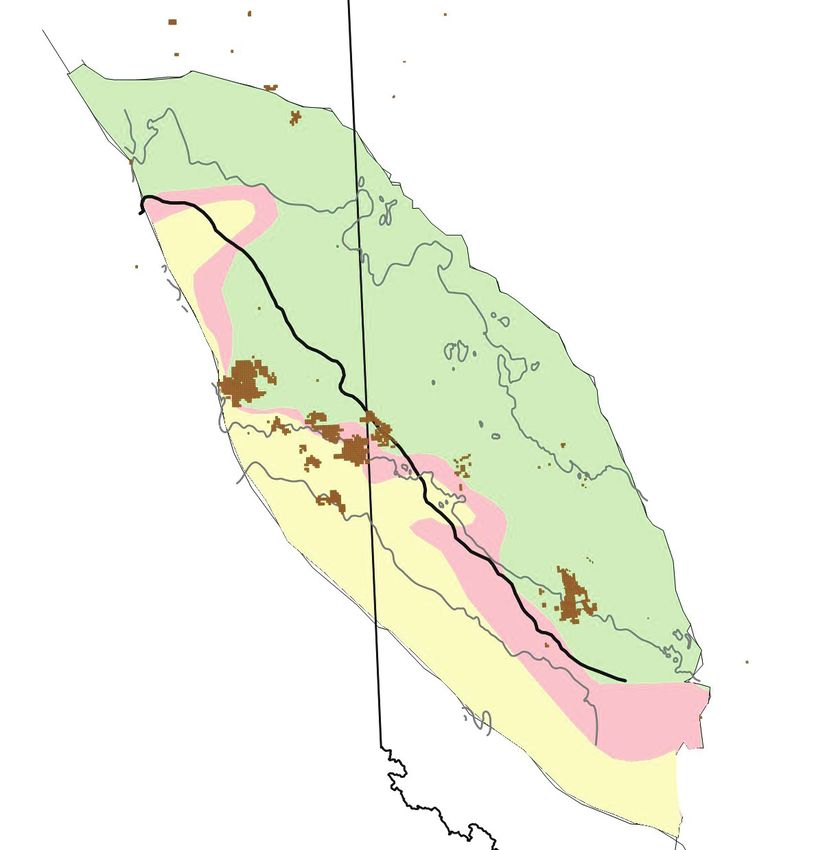
A Differentiated Investment
                                                       Guiding Principles

                              Sustainable Business Model

                                   Risk Management around All Aspects of the Business

                                    Superior Capital Discipline and Allocation

                                   Operational Excellence and Top-tier ESG Performance

                              Build Owned-and-operated Infrastructure

                                            ARC Is a Unique Long-term Investment

 Current Commodity Price Environment
                 Natural Gas Production Strategy                            Light Crude Oil & Liquids Production Strategy

                                                                             Majority of shut-in production brought
                  Brought Dawson Phase IV
                                                                                back online due to commodity
                  on-stream in early Q2 2020
                                                                                       price improvement

                    Focus H2 2020 capital
           program on natural gas development                                 Continue to monitor operational output
            activities at Dawson and Sunrise to                             from areas with higher operating expense
         maximize throughput during winter months

                      ~40% of anticipated                                              ~70% of anticipated
             natural gas production hedged for the                            crude oil and condensate production
                       remainder of 2020                                        hedged for the remainder of 2020

                   ARC Will Continue to Optimize Its Production Based on Prevailing Commodity Prices

08/31/2020                                                                                                                  2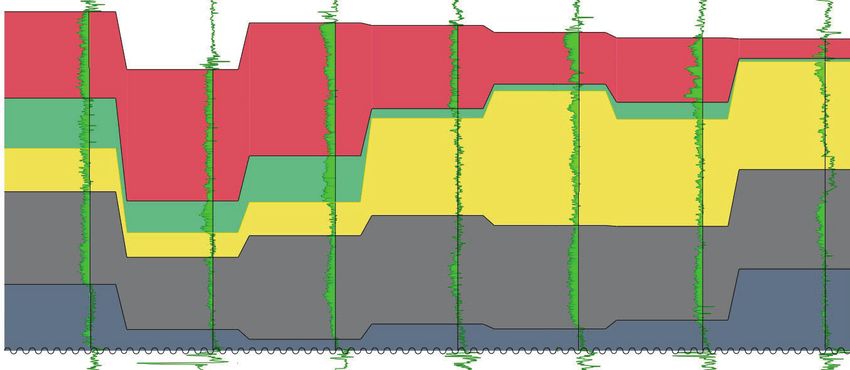
Capital Budget and Dividend
2020 Capital Budget Reduced by 40% Dividend Reduced by 60% Business Sustainability
Low cost structure and
operational flexibility
$0.05 per Share
$500 million (Monthly)
Commodity optionality
and robust market
diversification activities
$300 million
$0.06 per Share
(Quarterly) Strong balance sheet
with ample liquidity
Invest in profitable
growth when it makes
Original Budget Reduced Budget Original Dividend Reduced Dividend
sense to do so
ARC Is Positioned to Endure This Period of Economic Uncertainty and Remain in a Position of Financial Strength
Maintaining Financial Strength
Canadian Benchmarking: 2020E Year-end Net Debt / 2020E Cash Flow (1)
Group Average
11.6 12.0
9.6
7.2 7.4
6.4
5.4 5.4 5.8
5.0 5.0 5.2
3.7 4.0 4.1
3.3 3.4
2.0 2.3 2.4
1.7 1.8 1.8
ARC
US Benchmarking: 2020E Year-end Net Debt / 2020E Cash Flow (1)
Group Average
8.9 9.0
7.7
6.7
5.3 5.9 5.9
4.3 4.4 4.6 5.0
3.6 3.6 4.1
2.7 2.8 2.9 3.3
1.8 1.9 2.0 2.2 2.4
0.8 1.3 1.4
0.6
ARC
(1) Source: RBC Capital Markets. Consensus estimates as per FactSet on July 15, 2020.
ARC Has One of the Strongest Balance Sheets in the Sector
and Targets Its Net Debt to Funds from Operations to Be between 1.0 and 1.5 Times over the Long Term
08/31/2020 3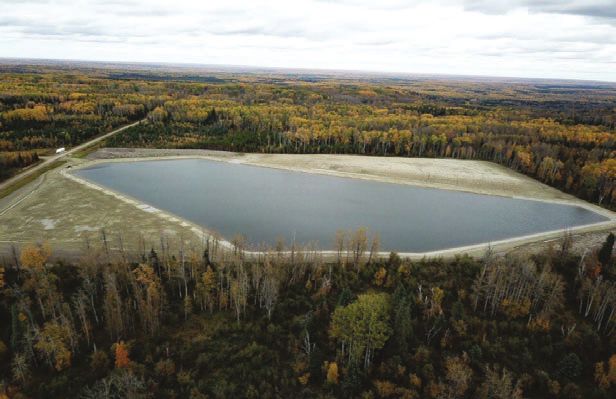
Significant Liquidity
Cash & Existing Credit Capacity
$2.1 Billion Total Cash & Existing Credit Capacity
($1.1 Billion Available) (1)(2)(3)(4)
Drawn Credit Facility Undrawn Master
$169.7MM Shelf
$306.7MM Bank Credit Facility
• $950 million committed credit facility plus $40
million ZRUNLQJFDSLWDOIDFLOLW\
•
PLOOLRQGUDZQDW-XQH
Long-term Notes
$571.4MM • EDQNVLQFOXGHGLQV\QGLFDWH
• Credit facility PDWXUHVLQ
Long-term Notes & Master Shelf
• 86PLOOLRQ0DVWHU6KHOIDJUHHPHQW
Undrawn Credit • Private Placement market
Facility
$820.3MM • Notes are rated NAIC 2-
Drawn Master
Shelf • Repayments structured to mature over a number of years
$203.9MM
to reduce financing risk
(1) As at June 30, 2020.
(2) Assumes Cdn$/US$ exchange rate of 1.36155.
(3) Credit Facility includes $40 million working capital facility.
(4) Non-cash working capital not included.
ARC Has Ample Liquidity to Sustain Its Business
Long-term Corporate Profitability
Return on Average Capital Employed (1) Delivering Full-cycle Asset Level Returns
30%
15%
After-tax Rate of Return
0%
Proportional
(15%) Facility and
Appropriate
Timing Included:
Project
Economics
(Full-cycle) Target
(30%) Double-digit
2020 YTD
1996
1997
1998
1999
2000
2001
2002
2003
2004
2005
2006
2007
2008
2009
2010
2011
2012
2013
2014
2015
2016
2017
2018
2019
Return on Average
Single-well Capital Employed
Economics Corporate Costs
ROACE Trailing Three-year ROACE (Half-cycle)
(1) Non-GAAP measure that does not have any standardized meaning under IFRS and therefore may not be comparable to similar measures presented by other issuers. Refer to “Non-GAAP Measures” in the Advisory Statements to this presentation.
ARC Has Delivered a ~9% ROACE since Inception
08/31/2020 4
Capital Allocation Priorities and Principles
                         Capital Allocation Priorities                                                        Capital Allocation Principles

                                                                                                                Manage net debt to funds from
                                                                                                               operations ratio within 1.0 to 1.5x

                                                           •Debt Reduction
                                                           •Long-term
                                                            Development                                       Pay sustainable dividend and grow
                                                            Investments                                        funds from operations per share
                                                           •Share Buybacks
                                                           •Dividend
                                                            Increases
                                                                                                               Maintain a low cost structure and
     Funds from
                                                                                                                    corporate decline rate
     Operations

                                          Capital
                                        Expenditures
                                                                                                                    Develop profitable projects

                        Dividend
                       $85MM/year
                                                                                                               Continue to implement physical
   Sources  of Cash
       Inflows          Dividend      Sustaining Capital
                                          Outflows          Discretionary                                    and financial diversification strategy
                                                              Outflows

Protect the Balance Sheet, Support the Dividend, Prioritize Capital Investments That Drive Long-term Value and Profitability

 Historical Capital Allocation and Outlook
                       2016 to 2019 Capital Allocation                                                    2020 Forecasted Capital Allocation

                      Inflows                          Outflows                                           Inflows                      Outflows

                                              Funds from Operations         Net A&D Proceeds   Dividend   Capital Expenditures

                                    ARC Anticipates to Generate Sufficient Funds from Operations in 2020
                                    to Fund Its Dividend and Capital Requirements and to Reduce Net Debt

08/31/2020                                                                                                                                            5
ARC’s Vision for the Future
                                                                                                            Production (Mboe/day)

                                                                                                                                              150 to 155

                                                                                                          139
                                                                  133
                          123

                         2017                                    2018                                    2019                                    2020F                                                                     Production Base

                                                                                                   Capital Expenditures ($ millions)
                          830

                                                                  679                                     692

                                                                                                                                                  300

                         2017                                    2018                                    2019                                    2020F                                                                  Capital Expenditures

                                       ARC Has Moved Towards a Larger Production Base with Lower Capital Expenditures

 2020 Guidance (1)
                        Invest                                                                                                                to bring Dawson Phase IV and
                        $300 million                                                                                                          Ante Creek expansion on-stream in Q2 and
                                                                                                                                              to focus on natural gas development

  33,000 – 37,500 bbl/day
  of liquids production                                                                               to produce                                                                                   and drill
  705 – 710 MMcf/day                                                                                  150,000 – 155,000                                                                            31 gross
  of natural gas production (2)
                                                                                                      boe/day (2)                                                                                   operated wells

                        with low operating expense                                                                                                    While ensuring the safe and responsible
                        of $4.55                    – $4.95/boe                                                                                       execution of the capital program

                                                                Maintain Balance Sheet Strength
                           Allowing                             Create Shareholder Value
                           ARC to:                              Advance Strong ESG Performance including Recent Publication of ESG Report
 (1)   Given ongoing uncertainty, continued market volatility, and the potential for both voluntary and involuntary production curtailments over the coming months, there is considerable uncertainty embedded into ARC’s 2020 guidance items.
 (2)   Does not incorporate the potential impact that third-party transportation restrictions may have on ARC’s natural gas production.

                        Reducing Capital Expenditures by 57% and Delivering 10% Increase in Production Relative to 2019

08/31/2020                                                                                                                                                                                                                                       6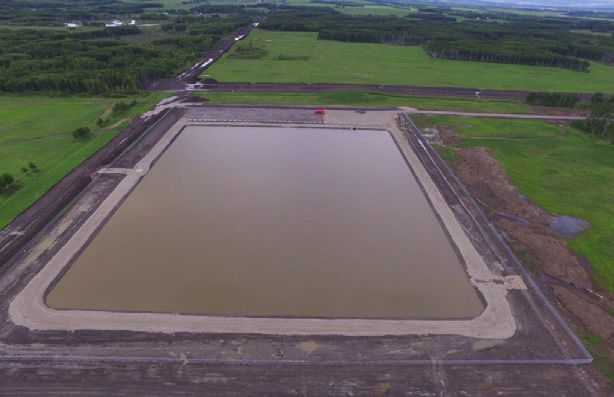
2020 Budget of $300 Million
Attachie
BC AB
Tower
Pouce Coupe
Septimus Parkland
Attachie Sunset
Sunrise Dawson Sunrise
$30MM
~5,000 boe/day $35MM • 7 wells
Sundown
Optimize pad profitability ~36,000 boe/day
with implementation of next Ensure maximum throughput
generation of well design during winter months
Ante Creek to capitalize on strong Ante Creek
natural gas prices $65MM • 7 wells
~17,000 boe/day
Expansion at Ante Creek facility
brought on-stream in
Parkland/Tower Q2 2020
$63MM • 8 wells
~27,500 boe/day
Drilling activities deferred Dawson
as liquids prices recover Pembina
$87MM • 9 wells
~56,000 boe/day $8MM
Phase IV facility brought on- Pembina ~10,000 boe/day
stream in Q2 2020; ensure Preserve light oil production
maximum throughput during as liquids prices recover
winter months to capitalize on
strong natural gas prices
Note: Well counts denote wells drilled in calendar year; number of wells with completion activities in calendar year may vary.
Dawson Phase IV and Ante Creek Facility Expansion Brought On-stream in Q2 2020
Majority of Remaining Capital Being Directed at Dawson and Sunrise
World-class Montney Resource
Montney Optionality Significant Montney Inventory (1)
BC AB 6,400
• Geographic Optionality
• Egress Optionality
• Commodity Optionality
• Multi-layer Optionality
4,800
Number of Locations
Oil & Liquids
3,200
Dry Gas
1,600
Condensate-rich
Gas
0
Wells Drilled to YE 2019 2P Booked Locations Internal Inventory Estimate
(1) Subject to change based on technology and economic environment.
ARC Has Identified over 4,500 Future Drilling Locations across Its Montney Assets
08/31/2020 7
Multiple Layers to Develop
                                    Attachie                       Septimus                        Sunrise                          Tower                        Parkland                        Dawson                    Pouce Coupe

                        Montney
  Upper Montney

                        A

                         Montney
                         B

                         Montney
                         C

                         Montney
  Lower Montney

                         D

                         Montney
                         E

                                        Existing Horizontal Wells, Development                                 Existing Horizontal Wells, Pilots                      Potential Horizontal Wells

                                     Up to 1,000 Feet Thick, ARC’s Montney Assets Have Significant Future Delineation Opportunities

 Top-tier Montney Economics
                             Montney Natural Gas Break-evens (Cdn$/Mcf) (1)(2)                                                                                       Montney Liquids Break-evens (US$/bbl) (1)

            2.40                                                                                                                               40.00
                                                 H1 2020 Average Realized Natural Gas Price
                                          including Gain on Risk Management Contracts: $2.08/Mcf

                                                                                                                                                                            H1 2020 Average Realized Condensate Price: $31/bbl
                                          H1 2020 Average Realized Natural Gas Price: $1.98/Mcf
            1.80                                                                                                                               30.00                          H1 2020 Average Realized Crude Oil Price: $28/bbl

            1.20                                                                                                                               20.00

            0.60                                                                                                                               10.00

            0.00                                                                                                                                0.00
                                              Parkland-Dawson
                                             Parkland-Dawson     Dawson
                                                                 Dawson         Sunrise
                                                                                Sunrise
                                               Lower Montney
                                                     Montney  Upper Montney  Upper Montney
                                                                                                                                                                                 Ante
                                                                                                                                                                                 Ante Creek     Tower               West
                                                                                                                                                                                                           Attachie West
                                              Lower           Upper Montney Upper  Montney                                                                                     Upper Montney Upper Montney Upper
                                                                                                                                                                               Middle                      Upper Montney
                                                                                                                                                                                                                 Montney

 (1)              Break-even prices are Cdn$ per Mcf or US$ per barrel as indicated. Break-even analysis is run on a single commodity and is defined as the price at which NPV10 is equal to zero. Montney natural gas break-evens run with WTI oil held constant at
                  US$40 per barrel and Montney liquids break-evens run with AECO natural gas held constant at Cdn$2.00 per GJ.
 (2)              Parkland-Dawson Lower Montney and Dawson Upper Montney break-evens denote the midpoint of a range of outcomes depending on the liquids ratio.

                                                       Low Cost Structure Supports Strong Economics in Stable Pricing Environment

08/31/2020                                                                                                                                                                                                                                                             8
Cost Management and Decline Rate
   Three-year PDP FD&A Costs ($/boe) (1)(2)(3)                                          Q1 2020 Operating Expense ($/boe) (4)(5)                                  2021E Corporate Decline Rates (6)

  32                                                                              16                                                                        40%
                                                                                                                                                                     Canadian Producers
                                                                                                                                                                     US Producers
                                                                                                                                                                   Group Average

  24                                                                              12                                                                        30%

          Group Average                                                                       Group Average

  16                                                                                8                                                                       20%

                                                                                                           ARC NE BC Oil & Gas
   8                                                                                4    ARC Sunrise Gas                                                    10%

                                                                                                                                 ARC Dawson
   0                                                                                0                                                                        0%
                     ARC                                                                                                                      ARC                       ARC

 (1)   Source: Peters & Co. 2019 E&P Reserves Comparative (April 7, 2020).
 (2)   Refer to ARC’s Annual Information Form for information pertaining to ARC’s finding and development costs.
 (3)   Three-year PDP FD&A Costs peer group includes: BTE, CPG, ERF, PEY, POU, TOU, VET, VII, WCP.
 (4)   Q1 2020 Operating Expense from company reports and represent data for the three months ended March 31, 2020.
 (5)   Q1 2020 Operating Expense peer group includes: BTE, CPG, ERF, PEY, POU, TOU, VET, VII, WCP.
 (6)   Source: Peters & Co. Limited E&P Overview Tables (July 27, 2020). Peer group includes APA, AR, COG, DVN, EOG, FANG, OVV, PEY, PXD, TOU, VII.

                                        Low-cost Producers with a Low Decline Rate Deliver Superior Returns over Time

 Best-in-class Operational Performance
            Dawson Drilling and Completions Costs ($/lateral metre)                                                                                       Operational Performance

   2,600

                                                                                                                                                      60% reduction in drilling and
                                                                                                                                                      completions costs since 2014
   2,300

                                                                 60%                                                                                   Drilling times reduced from
                                                                Reduction                                                                                   25 days to
Risk Management Program
Realized Gain (Loss) on Risk Management Contracts (1)(2)
300
Crude Oil
Natural Gas
Foreign Exchange & Power
200 Total
$ millions
100
0
(100)
2009 2010 2011 2012 2013 2014 2015 2016 2017 2018 2019 2020F 2021F 2022F 2023F 2024F
WTI (3) $62 $80 $95 $94 $98 $93 $49 $43 $51 $65 $57
US$/bbl
AECO (3) $3.91 $3.79 $3.44 $2.27 $3.00 $4.19 $2.63 $1.98 $2.30 $1.45 $1.54
Cdn$/GJ
(1) 2020 Forecast values based on actuals for the six months ended June 30, 2020 and forecast for July through December 2020 based on the forward strip pricing curve as at June 30, 2020 (net of credit adjustment). 2021 to 2024 Forecast values based
on the forward strip pricing curve as at June 30, 2020 (net of credit adjustment).
(2) Refer to the “Financial Instruments and Market Risk Management” note in ARC’s financial statements and the section entitled, “Risk Management” contained within ARC’s MD&A.
(3) Realized pricing is based on annual average settlements.
Program Executed with a Long-term View
Financial Price Management
~70% of Crude Oil & Condensate Hedged for the Balance of 2020 ~40% of Natural Gas Hedged for the Balance of 2020
20,000 320,000
Crude Oil & Condensate Production Hedged (bbl/day)
Natural Gas Production Hedged (MMBtu/day)
15,000 240,000
10,000 160,000
5,000 80,000
0 0
Q3 2020 Q4 2020 Q1 2021 Q2 2021 Q3 2021 Q4 2021 Q3 2020 Q4 2020 Q1 2021 Q2 2021 Q3 2021 Q4 2021
Hedging Program Continues to Mitigate Volatility in Funds from Operations
08/31/2020 10Natural Gas Financial and Physical Price Management
WCSB Demand & Export Capacity Growth (1) ARC’s Natural Gas Price and Diversification (2)(3)(4)
4.00
3.34
3.18
3.00 0.78 2.56
0.81
5.6 Bcf/day Demand & Export Capacity 2.14 2.03
Cdn$/Mcf
0.39 0.44
Growth Expected by 2025 2.00 0.72 0.40
0.09 0.11
Realized Gain on Risk
1.00 2.17 2.13 2.07 Management Contracts
1.65 1.72
Diversification Activities
LNG Canada Phase 1 0.00 (0.08) (0.15) Average Price before
Diversification Activities
+2.1 Bcf/day by 2025
(1.00)
2017 2018 2019 Q1 2020 Q2 2020
Intra-Alberta Demand
+1.5 Bcf/day by 2025
100% 2% 2% 2%
Enbridge T-South Capacity 4% 6% 6% 5% 5%
10% 7% 7%
+0.2 Bcf/day by 2021 NGTL East Gate Capacity 7% 11%
Empress Floating
8% 10%
+1.3 Bcf/day by 2022 75%
13% 17% 8%
Dawn Floating
% of Total Production
17% 15% 13%
18% 13% Malin Floating
NGTL West Gate Capacity
11% 14% 15% Henry Hub Floating
+0.5 Bcf/day by 2023 50%
14% 15%
16% 14% Midwest US Floating
22% 33% Station 2 Floating
25% 28%
AECO Floating
34% 34%
18% Hedged
13% 13%
0%
Bal 2020 Cal 2021 Cal 2022 Cal 2023 Cal 2024
(1) Source: ARC Risk Research, TC Energy, Enbridge, company reports.
(2) Realized gain on risk management contracts is not included in ARC’s realized natural gas price.
(3) Based on internal production assumptions and adjusted for ARC’s heat content.
(4) “Hedged” includes all physical and financial fixed price swaps and collars at AECO, Station 2, and Henry Hub.
ARC Is Increasing Its Exposure to Local Pricing Given Structural Improvements to WCSB
ARC’s ESG Excellence
ESG Ratings by Major Oil Producing Country (1)(2) Oil and Gas Companies’ Relative ESG Rankings (1)
100 500 70
Africa
Asia
Canada
64 Europe
75 375
Latin America
Social and Governance Score
Average ESG Score
Middle East
Reserves (Bboe)
Russia
ARC
58 United States
50 250
52
25 125
46
0 0
40
40 46 52 58 64 70
Environmental Score
Average ESG Score (LHS) Reserves (RHS)
(1) Source: BMO Capital Markets; Yale Environmental Performance Index (EPI); Social Progress Imperative; Worldbank Worldwide Governance Indicators, BMO Capital Markets; Bloomberg; CSRHub. For presentation, an equal weight (1/3) of each
index is represented.
(2) Source: BP “Statistical Review of World Energy” (2020). Reserves as at December 31, 2019.
Canadian Energy Sector Is Regulated by Some of the Highest Standards and Is a Clean, Ethical Energy Source
ARC Ranks among the Highest in the World on Sustainability Performance
08/31/2020 11Emissions Management Strategy
Emissions Management Strategy GHG Emissions Performance (Scope 1 and 2)
1,200 0.04
Proactively focus on reducing GHG intensity
Set GHG emissions intensity reduction target
GHG Emissions Intensity (tCO2e/boe)
900 0.03
Incorporate emissions management
GHG Emissions (tCO2e)
solutions into project planning
2019 GHG Emissions Intensity Benchmarking (1) 600 0.02
0.12
0.09
tCO2e/boe
300 0.01
0.06
20% reduction
target relative to
0.03 2019 baseline
0.00 0 0.00
2015 2016 2017 2018 2019 2025
ARC 2019
ARC 2018
Target
Direct Emissions Indirect Emissions GHG Emissions Intensity
(1) Peer group includes: BNP, BTE, CNQ, CPG, CVE, ERF, MEG, NVA, OVV, PEY, SU, TOU, VET, VII, WCP.
ARC Delivered a 47 Per Cent Reduction in Its GHG Emissions Intensity Compared to Its 2017 Baseline
A New Target Has Been Set to Reduce ARC’s GHG Emissions Intensity by an Additional 20 Per Cent by 2025
Water Management Strategy
Water Management Strategy Water Storage Reservoirs
Responsibly manage water use in operations
Evaluate technologies and procedures to
implement best practices
Sunrise Parkland
Water strategy key in long-term planning
Water Management Strategy in Action
• $55 million of water infrastructure investments in ARC’s
Montney operations since 2017 to add 700,000 m3 of water
storage capacity
• Nearly 90 per cent of water used in ARC’s operations is
recycled Ante Creek Dawson
ARC’s Water Management Strategy Is Centred around Responsibility, Sustainability, and Profitability
08/31/2020 12Strong Safety Performance
Contractor Total Recordable Incident Frequency
2.0
60%
Reduction
Total Recordable Incident Frequency
1.5
1.0
0.5
0.0
2014 2015 2016 2017 2018 2019 2020 YTD
• Strong safety performance is the result of well-planned and executed operations and alignment with strong service providers
ARC Employees Have Gone over Six Years Without a Lost-time Incident
Owned-and-operated Infrastructure
Ante Creek 2-26
NE BC
Ante Creek 10-7
Parkland/Tower Phase I
Ante Creek 10-36
Dawson Phase III & IV AB
Dawson Phase I & II
Sunrise Phase I & II Corporate Sales Capacity:
• >800 MMcf/day of Natural Gas Capacity
Over 90% Owned and Operated
• >50 Mbbl/day of Liquids Capacity
Owned-and-operated Infrastructure Affords ARC Greater Control over Its Cost Structure and Liquids Recoveries
08/31/2020 13Resource Potential and Scalability
Attachie ARC has:
• ~1,000 net Montney sections (~636,000 acres)
• Over 4,500 future drilling locations identified across the Montney
• Commodity, geographic, and multi-layer optionality
Greater
Dawson Area
Greater
Sunrise Area
Ante Creek
Future Development Projects
~139 Mboe/day
Dawson Phase IV & Ante Creek Expansion
Base Production (Montney & Cardium)
2019
Scalability Allows for Profitable Growth to Generate Sustainable Funds from Operations and Maintain Financial Strength
Sunrise Overview
Snapshot Development Plan
• Ensure maximum throughput during winter months at Sunrise Phase I and II
facilities, which have combined processing capacity of 240 MMcf per day
• Area’s operating expense is less than $0.30 per Mcf
Sunset
2020 Development Focus
Capital Budget Planned Wells Expected Production
$35 million 7 wells ~36 Mboe/day
(12%) (23%) (24%)
$300 million (1) 31 wells (1) 150 to 155 Mboe/day (1)
(1) Denotes corporate total for capital budget, planned wells, and expected production for 2020.
Phase I & II
Gas Plants Infrastructure Build-out
Montney Natural Gas Processing Capacity
Sunrise
Phase II
Sunrise
Phase II
Sunrise Sunrise
Phase I
2015 2018 2019
H2 2020 Capital Program Focused on Natural Gas Development Activities at Sunrise
08/31/2020 14Greater Dawson Area Overview
Snapshot Development Plan
• Brought Dawson Phase IV on-stream in Q2 2020
• Recommenced drilling activities in Q3 2020 to capture strong natural gas prices
2020 Development Focus
Capital Budget Planned Wells Expected Production
$150 million 17 wells ~83.5 Mboe/day
(50%) (55%) (55%)
Tower $300 million (1) 31 wells (1) 150 to 155 Mboe/day (1)
Phase I & II
Gas Plants
Phase III & IV
(1) Denotes corporate total for capital budget, planned wells, and expected production for 2020.
Gas Plants
Parkland
Phase I & II Infrastructure Build-out
Gas Plants Montney Natural Gas Processing Capacity Dawson
Phase IV
Montney Crude Oil & Liquids Processing Capacity Dawson
Dawson Parkland
Dawson Phase I & II
Upgrade
Phase III
Tower
Parkland
Battery
Tower
Upgrade
Phase I
Dawson
Pembina & Enbridge Dawson Phase II
Phase I
TCPL
Parkland-Dawson Interconnect Pipeline
2010 2011 2013 2015 2017 Q4 2019 Q2 2020
Large Integrated Network of Owned-and-operated Infrastructure
Lower Montney Development and Liquids Growth
Greater Dawson Area Lower Montney Development
• 23 Tcf (1) of resources in lower
Montney
Large Resource
in Place • 105 MMbbl of contingent resource
NGLs, of which 71 MMbbl is
condensate (1)(2)
100
• North Dawson & Parkland Phase II & IV
CGR: ~150 bbl/MMcf Gas Plants
• Core Dawson CGR: ~40 bbl/MMcf
Tiered Inventory Parkland
• 300+ drilling locations at Dawson
250+ drilling locations at
Parkland/Tower Phase I & II
Gas Plants
• Prioritize wells based on return on Dawson
Strong Return on investment
Investment • Lower Montney wells have strong
IRR and one-year payout
Free Condensate-to-gas Ratio (bbl/MMcf)
2019 Lower Montney Wells
2020 Lower Montney Wells
(1) Total Petroleum Initially-in-Place as at December 31, 2018.
(2) NGLs volumes are Unrisked Best Estimate Economic Contingent Resource as at December 31, 2018. Lower Montney Wells to Be Drilled into 2021
Integrated Approach to Development in Greater Dawson Area Allows ARC
to Optimize Infrastructure Capacities to Maximize Profitability
08/31/2020 15Greater Dawson Area Strong Condensate Results
Greater Dawson Area Condensate Performance
200,000 Lower Montney Range
Upper Montney Range
NGLs Natural
Cumulative Condensate Production (bbl)
[C2,C3,C4] Condensate Gas
150,000 Type Curve EUR (Mbbl) EUR (Mbbl) EUR (Bcf)
Upper Montney Low End 10 30 7.3
Upper Montney High End 105 85 5.9
100,000
Lower Montney Low End 110 100 6.0
Lower Montney High End 80 240 2.4
50,000
0
0 12 24 36 48 60
Months on Production
Strong Range of Condensate Outcomes from Both Upper and Lower Montney Development
Optimizing Dawson Lower Montney Development
Estimated Ultimate Recovery Capital Efficiency
1,500 10,000
Estimated Ultimate
Capital Efficiency
Recovery (Mboe)
1,125 7,500
($/boe/day)
750 5,000
375 2,500
0 0
2017 2018 2019 2017 2018 2019
Well Costs Finding and Development Costs
5,500 8
Finding & Development
5,000 6
Costs ($/boe)
($ millions)
Well Costs
4,500 4
4,000 2
3,500 0
2017 2018 2019 2017 2018 2019
Technology Has Enhanced Profitability through Improved EURs, Better Capital Efficiency, and Lower F&D Costs
08/31/2020 16Dawson Phase IV On-stream
Dawson Phase IV Project Checklist
Commercial and Development Execution
Regulatory Approval Secured
Takeaway Secured
Economics Robust
Facility Execution
Project Cost On budget
Safety 0 LTIs
On-stream April 2020
Commissioning Activities Completed in Q1 2020 and Facility Brought On-stream in Q2 2020
Wells to Initially Fill Facility Are Meeting Type Curve Expectations
Ante Creek Overview
Snapshot Development Plan
• Brought Ante Creek facility expansion on-stream in Q2 2020
2020 Development Focus
Capital Budget Planned Wells Expected Production
2-26
$65 million 7 wells ~17 Mboe/day
Gas Plant (22%) (23%) (11%)
2-26
Gas Plant
$300 million (1) 31 wells (1) 150 to 155 Mboe/day (1)
10-7
10-7 Plant
Gas
Gas Plant
(1) Denotes corporate total for capital budget, planned wells, and expected production for 2020.
10-36
10-36 Infrastructure Build-out
Gas Plant
Gas Plant Montney Natural Gas Processing Capacity
Montney Crude Oil & Liquids Processing Capacity
Ante Creek
Ante Creek Expansion
Phase I
Existing Infrastructure 2012 Q2 2020
Low-risk Montney Light Oil Development
08/31/2020 17Attachie Overview
Snapshot Development Plan
• Optimize pad profitability with implementation of next generation of well design
• Prepare Attachie West Phase I for execution as next major infrastructure project
2020 Development Focus
Capital Budget Planned Wells Expected Production
$30 million 0 wells ~5 Mboe/day
(10%) (0%) (3%)
$300 million (2) 31 wells (2) 150 to 155 Mboe/day (2)
Phase I
(1)
Gas Plant (2) Denotes corporate total for capital budget, planned wells, and expected production for 2020.
Infrastructure Build-out
Phase I Montney Natural Gas Processing Capacity
Gas Plant
4-20 Montney Crude Oil & Liquids Processing Capacity
Battery Attachie West Phase I
(3.5 Mbbl/day)
ARC Acreage Pembina
COP Acreage North Montney Mainline
COP Acreage Acquired from KEL (1)
(1) ConocoPhillips acquired Kelt’s acreage in Q3 2020. Existing Infrastructure
Newest Wells on Production Have Verified Type Curve Expectations
Continuous Improvement in Pad and Well Design
Pad and Well Design Evolution Cumulative Condensate Production
300
2016
13-26 Well
Unconstrained
Cumulative Oil & Condensate Production (Mbbl)
225
2017
B13-26 Well
Unconstrained
02-27
J2-27
300 m 300 m 150
2018 16-16 Well
13-26 Well
13-14 Pad 45 m
B13-26 Well
150 metre Spacing 13-14 Pad Average
300 m 300 m 300 m
2-27 Pad Phase I (1)
600 m B2-27 Attachie Type Curve
75
2019
2-27 Pad Phase I 45 m
300 metre Spacing
600 m A2-27
400 m 400 m
2019 0
0 350 700 1,050 1,400
2-27 Pad Phase II 45 m
Days on Production
200 metre Spacing
400 m 400 m
(1) Facility constraints relieved in Q2 2020; three of four wells on 2-27 Pad Phase I produced consistently prior to this. Over 190 days of production, the four wells have produced approximately 360,000 barrels of condensate and approximately 1,150 MMcf of natural gas.
Well Results from Newest Pad Have Validated Pad and Well Design Changes
08/31/2020 18Advancing Attachie towards Commercialization
Technical Commercial Funding
Strong liquids deliverability Commodity egress Balance sheet
Improved capital efficiencies Regulatory Maximize profitability
Competitor activity Support infrastructure Project readiness
ARC Is Progressing the Technical, Commercial, and Funding Aspects of Attachie West Phase I
Pembina Overview
Snapshot Development Plan
• Preserve light oil production as liquids prices recover further
2020 Development Focus
Capital Budget Planned Wells Expected Production
$8 million 0 wells ~10 Mboe/day
(3%) (0%) (7%)
$300 million (1) 31 wells (1) 150 to 155 Mboe/day (1)
Berrymoor
NPCU Lindale
(1) Denotes corporate total for capital budget, planned wells, and expected production for 2020.
Buck H1 2020 Production Split
MIPA Creek
74%
PCU7
SPCU
9.8 Mboe/day
Crude oil
2% Condensate
4% NGLs
20%
Blue boundaries denote units. Natural gas
High Interest Light Oil Production
08/31/2020 19Additional Information
2020 Guidance (1)
2020 2020 YTD
Guidance Actuals
Production
Crude oil (bbl/day) 14,000 - 16,000 15,992
Condensate (bbl/day) 11,000 - 13,000 12,251
Crude oil and condensate (bbl/day) 25,000 - 29,000 28,243
Natural gas (MMcf/day) (2) 705 - 710 732.7
NGLs (bbl/day) 8,000 - 8,500 8,779
Total production (boe/day) (2) 150,000 - 155,000 159,146
Expenses ($/boe)
Operating 4.55 - 4.95 3.83
Transportation 3.10 - 3.30 2.87
G&A expense before share-based compensation expense 1.00 - 1.20 1.13
G&A - share-based compensation expense (3) 0.30 - 0.45 0.17
Interest and financing (4) 0.65 - 0.80 0.74
Current income tax expense (recovery) as a per cent of funds from operations (5) (2) - 3 (11)
Capital expenditures before land and net property acquisitions (dispositions) ($ millions) 300 213.9
(1) Given ongoing uncertainty, continued market volatility, and the potential for both voluntary and involuntary production curtailments over the coming months, there is considerable uncertainty embedded into ARC’s 2020 guidance items.
(2) Guidance does not incorporate the potential impact that third-party transportation restrictions may have on ARC's natural gas production.
(3) Comprises expense recognized under the Restricted Share Unit and Performance Share Unit Plans, Share Option Plan, and Long-term Restricted Share Award Plan, and excludes compensation expense under the Deferred Share Unit Plan.
In periods where substantial share price fluctuation occurs, G&A expense is subject to greater volatility.
(4) Excludes accretion of asset retirement obligation.
(5) The current income tax estimate varies depending on the level of commodity prices.
2020 Capital Program Was Reduced to Protect ARC’s Strong Balance Sheet
08/31/2020 20Asset Details
Sunrise Dawson Parkland/Tower Ante Creek Attachie Pembina
Net production – Q2 2020
Crude oil & liquids (bbl/day) 12 10,454 10,592 7,598 1,817 7,066
Natural gas (MMcf/day) 243.9 342.3 121.0 40.4 7.3 11.4
Total (boe/day) 40,662 67,510 30,757 14,329 3,034 8,973
Land
Net sections (1) 32 137 94 206 308 217
Working interest ~89% ~100% ~90% / ~94% ~100% ~99% ~89%
PDP Reserves (MMboe) 66 79 46 20 6 38
Liquids (MMbbl) 0.3 10.4 14.6 9.6 2.8 32.7
Gas (Bcf) 396 410 186 62 17 35
Reserves life index (Years) (2) 5 4 4 3 3 11
2P Reserves (MMboe) 234 300 153 78 39 60
Liquids (MMbbl) 2.5 51.2 48.9 38.6 20.5 49.9
Gas (Bcf) 1,390 1,494 627 239 112 61
Reserves life index (Years) (2) 18 14 14 12 22 17
(1) Denote Montney or Cardium sections only.
(2) Reserve life index based on 2020 guided production.
Diversified Commodity Mix across Asset Portfolio Provides Optionality
ARC’s Business
Production Net Debt to Funds from Operations Dividends (1)
180,000
1,600 2.50 8 120%
Dividends as a % of Funds from Operations
2.00
135,000
6 90%
Cumulative Dividends ($ billions)
1,200
1.50
$ millions
boe/day
Ratio
90,000
800 4 60%
1.00
45,000 2 30%
400
0.50
0 0 0.00 0 0%
2020 YTD
1996
1997
1998
1999
2000
2001
2002
2003
2004
2005
2006
2007
2008
2009
2010
2011
2012
2013
2014
2015
2016
2017
2018
2019
2020 YTD
1996
1997
1998
1999
2000
2001
2002
2003
2004
2005
2006
2007
2008
2009
2010
2011
2012
2013
2014
2015
2016
2017
2018
2019
2020 YTD
1996
1997
1998
1999
2000
2001
2002
2003
2004
2005
2006
2007
2008
2009
2010
2011
2012
2013
2014
2015
2016
2017
2018
2019
Montney Natural Gas (boe/day)
Net Debt (LHS)
Non-Montney Natural Gas (boe/day)
Montney Crude Oil & Liquids (bbl/day) Annualized Funds From Operations (LHS) Cumulative Dividend (LHS)
Non-Montney Crude Oil & Liquids (bbl/day) Net Debt to Annualized Funds from Operations (RHS) Dividends as a % of FFO (RHS)
(1) Dividends as a per cent of funds from operations calculated as dividends before Dividend Reinvestment Plan and Stock Dividend Program.
ARC Manages a Profitable Business through Commodity Price Cycles
with Its Efficient Montney Production Base and Strong Balance Sheet
08/31/2020 21Note Repayment Schedule
Long-term Notes Principal Repayment Schedule (1)
200
3.72% US$ Note
8.21% US$ Note
5.36% US$ Note
3.31% US$ Note
150
3.81% US$ Note
4.49% Cdn$ Note
Cdn$ millions
100
50
0
Bal 2020 2021 2022 2023 2024 2025 2026 2027 2028 2029
(1) Assumes Cdn$/US$ exchange rate of 1.36155 at June 30, 2020.
Long-term Note Repayments Structured to Mature over a Number of Years to Reduce Financing Risk
Risk Management Contract Positions
Risk Management Contracts Positions at June 30, 2020 (1) Q3 2020 to Q4 2020 2021 2022 2023 2024
Crude Oil – WTI US$/bbl bbl/day US$/bbl bbl/day US$/bbl bbl/day US$/bbl bbl/day US$/bbl bbl/day
Ceiling 55.70 8,500 57.29 7,992 - - - - - -
Floor 47.35 8,500 50.35 7,992 - - - - - -
Sold Floor 41.92 6,500 40.23 7,992 - - - - - -
Swap 45.16 4,000 35.05 1,000 - - - - - -
(2)
Sold Swaption - - 54.32 3,008 - - - - - -
(3)
Crude Oil – Cdn$ WTI Cdn$/bbl bbl/day Cdn$/bbl bbl/day Cdn$/bbl bbl/day Cdn$/bbl bbl/day Cdn$/bbl bbl/day
Ceiling 86.38 6,500 - - - - - - - -
Floor 75.38 6,500 - - - - - - - -
Sold Floor 60.38 6,500 - - - - - - - -
Total Crude Oil Volumes (bbl/day) 19,000 8,992 - - -
(4)
Crude Oil - MSW (Differential to WTI) US$/bbl bbl/day US$/bbl bbl/day US$/bbl bbl/day US$/bbl bbl/day US$/bbl bbl/day
Ceiling (7.00) 1,000 - - - - - - - -
Floor (10.20) 1,000 - - - - - - - -
Swap (8.01) 6,989 - - - - - - - -
(5)
Natural Gas - Henry Hub US$/MMBtu MMBtu/day US$/MMBtu MMBtu/day US$/MMBtu MMBtu/day US$/MMBtu MMBtu/day US$/MMBtu MMBtu/day
Ceiling 2.94 125,108 3.02 110,000 3.11 45,000 2.74 10,000 2.74 10,000
Floor 2.56 125,108 2.55 110,000 2.55 45,000 2.50 10,000 2.50 10,000
Sold Floor 2.17 125,108 2.10 110,000 2.18 45,000 2.10 10,000 2.10 10,000
Swap 1.86 13,405 - - - - - - - -
Natural Gas – AECO 7A Cdn$/GJ GJ/day Cdn$/GJ GJ/day Cdn$/GJ GJ/day Cdn$/GJ GJ/day Cdn$/GJ GJ/day
Ceiling 3.06 50,162 2.41 120,000 2.40 90,000 2.40 90,000 2.40 90,000
Floor 2.56 50,162 1.95 120,000 1.87 90,000 1.87 90,000 1.87 90,000
Swap 2.23 90,324 1.99 40,000 2.06 10,000 2.06 10,000 2.06 10,000
(2)
Sold Swaption - - - - 2.00 20,000 - - - -
Total Natural Gas Volumes (MMBtu/day) 271,669 261,651 139,782 104,782 104,782
Natural Gas - AECO Basis (Differential to Henry Hub) US$/MMBtu MMBtu/day US$/MMBtu MMBtu/day US$/MMBtu MMBtu/day US$/MMBtu MMBtu/day US$/MMBtu MMBtu/day
Sold Swap (0.85) 83,297 (0.93) 69,192 (0.88) 35,000 (0.91) 70,000 (0.91) 70,000
Total AECO Basis Volumes (MMBtu/day) 83,297 69,192 35,000 70,000 70,000
Natural Gas – Other Basis (MMBtu/day)
(6)
(Differential to Henry Hub) MMBtu/day MMBtu/day MMBtu/day MMBtu/day MMBtu/day
Sold Swap 100,000 120,000 110,000 80,000 4,973
Ceiling Floor
Foreign Exchange Contract
Settlement Date Notional Amount (US$ millions) (Cdn$/US$) (Cdn$/US$)
(7)
Variable Rate Collar August 24, 2020 24 1.2771 1.3231
(1) The prices and volumes in this table represent averages for several contracts representing different periods. The average price for the portfolio of options listed (4) MSW differential refers to the discount between WTI and the mixed sweet crude grade at Edmonton calculated on a monthly weighted average basis in US$.
above does not have the same payoff profile as the individual option contracts. Viewing the average price of a group of options is purely for indicative purposes. (5) Natural gas prices referenced to NYMEX Henry Hub Last Day Settlement.
All positions are financially settled against the benchmark prices. (6) ARC has entered into basis swaps at locations other than AECO.
(2) The swaption allows the counterparty, at a specified future date, to enter into a swap with ARC at the above-detailed terms. These volumes are not included in the (7) Variable rate collar whereby if the Cdn$/US$ spot rate is below $1.2771 at expiry, the ceiling will readjust to $1.3058.
total commodity volumes until such time that the option is exercised.
(3) Crude oil prices referenced to WTI, multiplied by the WM/Reuters Intra-day Cdn$/US$ Foreign Exchange Spot Rate as of Noon Eastern Standard Time.
08/31/2020 22Produced Reserves Replacement
Annual Produced Reserves Replacement (1)
160
Growth through Acquisition Organic Growth
120
80
MMboe
40
0
(40)
1997 1998 1999 2000 2001 2002 2003 2004 2005 2006 2007 2008 2009 2010 2011 2012 2013 2014 2015 2016 2017 2018 2019
Reserves Replacement - Development Reserves Replacement - Net Acquisitions & Dispositions Reserves Replacement - Total Production
• Strong 2019 development 2P reserve adds, with 164 per cent of produced reserves replaced
• Finding and development costs of $4.82/boe for proved plus probable reserves and $9.74/boe for total proved reserves (2)
(1) 1997 to 2002 reserves data is based on company interest established reserves (proved plus 50 per cent of probable reserves). 2003 to 2019 reserves data is based on gross interest proved plus probable reserves.
(2) Includes future development capital.
150 Per Cent Reserves Replacement or Greater for 12th Consecutive Year
Key Reserve Information (1)
Proved Producing 258 MMboe YE 2019 2P Reserves
Total Proved 595 MMboe
Proved plus Probable 910 MMboe
Crude and Tight Oil 83 MMbbl PDP
Probable
NGLs 134 MMbbl 35% 28%
Natural Gas 4.2 Tcf
PNP 2%
2P Reserve Life Index (2) 15.8 years
TPIIP (1)(3)
PUD
Tight Oil 14.3 billion barrels 35%
Shale Gas 101.8 Tcf
1,000
Natural Gas
Crude Oil & Liquids Condensate &
2P Reserves (MMboe)
Oil
750 Pentanes Plus
9%
9%
500 NGLs
6%
250 Natural Gas
76%
0
2010 2011 2012 2013 2014 2015 2016 2017 2018 2019
(1) Reserves data effective December 31, 2019; TPIIP resources data effective December 31, 2018.
(2) Based on 2020 original production guidance midpoint of 158,000 boe per day.
(3) Independent Resources Evaluation conducted by GLJ effective December 31, 2018. For resources disclosure, refer to the February 7, 2019 news release entitled, “ARC Resources Ltd. Announced 118 MMboe of Total Proved Plus Probable Reserve
Additions in 2018, Replacing 245 Per Cent of Production, and Delivers Record Proved Producing Reserve Additions of 82 MMboe”.
Year-end 2019 Reserves Added 83 MMboe of 2P Reserves through Development Activities
08/31/2020 23ESG Recognitions and Rankings
Member of MSCI Global Sustainability Index
MSCI ESG Rating: AAA Member of FTSE Russell’s FTSE4Good Index Series since 2018
Voluntary participant since 2007 Member of the 30% Club since 2018
2019 Climate Change Score: B
2019 Water Security Score: B
Member of Sustainalytics’ Jantzi Social Index
Please View ARC’s 2020 ESG Report at www.arcresources.com/responsibility
Reserves and Resources Disclosure
All reserves in this presentation are, unless indicated otherwise, as at December 31, 2019 as evaluated by GLJ Petroleum Consultants Ltd. (“GLJ”) in accordance with the
definitions, standards, and procedures contained in the COGE Handbook and NI 51-101. Resources volumes for the Montney are as at December 31, 2018 as evaluated
by GLJ in accordance with the definitions, standards, and procedures contained in the COGE Handbook and NI 51-101 .
TPIIP, DPIIP, and UPIIP have been estimated using a one per cent porosity cut-off for shale gas and tight oil.
Reserves volumes for ARC’s Montney assets and elsewhere in this presentation are, unless indicated otherwise, Proved plus Probable, while the resource categories for the
Montney in this presentation are “Best Estimates”.
All reserves and resources volumes for the Montney and elsewhere in this presentation are company gross.
Gas volumes are “sales” for reserves and resource and raw gas for DPIIP and TPIIP.
The tight oil DPIIP is a stock tank barrel.
All DPIIP and TPIIP other than cumulative production, reserves, Contingent Resources, and Prospective Resources have been categorized as unrecoverable.
The amount of natural gas and liquids ultimately recovered from ARC’s the Montney resource will be primarily a function of the future price of both commodities.
08/31/2020 24Definitions of Reserves and Resources
Reserves are estimated remaining quantities of crude oil and natural gas and related substances anticipated to be recoverable from known accumulations, as of a given
date, based on the analysis of drilling, geological, geophysical, and engineering data; the use of established technology; and specified economic conditions, which are
generally accepted as being reasonable. Reserves are classified according to the degree of certainty associated with the estimates as follows:
Proved Reserves are those reserves that can be estimated with a high degree of certainty to be recoverable. It is likely that the actual remaining quantities recovered will
exceed the estimated proved reserves.
Probable Reserves are those additional reserves that are less certain to be recovered than proved reserves. It is equally likely that the actual remaining quantities
recovered will be greater or less than the sum of the estimated proved plus probable reserves.
Resources encompasses all petroleum quantities that originally existed on or within the earth’s crust in naturally occurring accumulations, including Discovered and
Undiscovered (recoverable and unrecoverable) plus quantities already produced. "Total Resources" is equivalent to "Total Petroleum Initially-in-Place". Resources are
classified in the following categories:
Total Petroleum Initially-in-Place ("TPIIP") is that quantity of petroleum that is estimated to exist originally in naturally occurring accumulations. It includes that quantity
of petroleum that is estimated, as of a given date, to be contained in known accumulations, prior to production, plus those estimated quantities in accumulations yet to be
discovered.
Discovered Petroleum Initially-in-Place ("DPIIP") is that quantity of petroleum that is estimated, as of a given date, to be contained in known accumulations prior to
production. The recoverable portion of DPIIP includes production, reserves, and contingent resources; the remainder is unrecoverable.
Contingent Resources are those quantities of petroleum estimated, as of a given date, to be potentially recoverable from known accumulations using established
technology or technology under development but which are not currently considered to be commercially recoverable due to one or more contingencies.
Economic Contingent Resources ("ECR") are those Contingent Resources which are currently economically recoverable.
Project Maturity Subclass Development Not Viable is defined as a Contingent Resource that is not viable in the conditions prevailing at the effective date of the
evaluation, and where no further data acquisition or evaluation is planned and therefore has not been assigned a low chance of development.
Project Maturity Subclass Development Pending is defined as a Contingent Resource that has been assigned a high chance of development and the resolution of final
conditions for development are being actively pursued.
Project Maturity Subclass Development Unclarified is defined as a Contingent Resource that requires further appraisal to clarify the potential for development and has
been assigned a lower chance of development until contingencies can be clearly defined.
Definitions of Reserves and Resources
Undiscovered Petroleum Initially-in-Place ("UPIIP") is that quantity of petroleum that is estimated, on a given date, to be contained in accumulations yet to be
discovered. The recoverable portion of UPIIP is referred to as "prospective resources" and the remainder as "unrecoverable".
Prospective Resources are those quantities of petroleum estimated, as of a given date, to be potentially recoverable from undiscovered accumulations by application of
future development projects.
Unrecoverable is that portion of DPIIP and UPIIP quantities which is estimated, as of a given date, not to be recoverable by future development projects. A portion of
these quantities may become recoverable in the future as commercial circumstances change or technological developments occur; the remaining portion may never be
recovered due to the physical/chemical constraints represented by subsurface interaction of fluids and reservoir rocks.
Uncertainty Ranges are described by the COGE Handbook as low, best, and high estimates for reserves and resources. The Best Estimate is considered to be the best
estimate of the quantity that will actually be recovered. It is equally likely that the actual remaining quantities recovered will be greater or less than the best estimate. If
probabilistic methods are used, there should be at least a 50 per cent probability that the quantities actually recovered will equal or exceed the best estimate.
08/31/2020 25Contact Information
Kris Bibby
Senior Vice President and Chief Financial Officer
403.503.8675
KBibby@arcresources.com
Martha Wilmot
Investor Relations Analyst
403.509.7280
MWilmot@arcresources.com
General Investor Relations Enquiries
403.503.8600
1.888.272.4900
IR@arcresources.com
Please Visit Our Website at www.arcresources.com
08/31/2020 26Notes
____________________________________________________________________________
____________________________________________________________________________
____________________________________________________________________________
____________________________________________________________________________
____________________________________________________________________________
____________________________________________________________________________
____________________________________________________________________________
____________________________________________________________________________
____________________________________________________________________________
____________________________________________________________________________
____________________________________________________________________________
____________________________________________________________________________
____________________________________________________________________________
____________________________________________________________________________
____________________________________________________________________________
____________________________________________________________________________
____________________________________________________________________________
____________________________________________________________________________
____________________________________________________________________________
____________________________________________________________________________
____________________________________________________________________________
____________________________________________________________________________
____________________________________________________________________________
____________________________________________________________________________
08/31/2020 27____________________________________________________________________________
____________________________________________________________________________
____________________________________________________________________________
____________________________________________________________________________
____________________________________________________________________________
____________________________________________________________________________
____________________________________________________________________________
____________________________________________________________________________
____________________________________________________________________________
____________________________________________________________________________
____________________________________________________________________________
____________________________________________________________________________
____________________________________________________________________________
____________________________________________________________________________
____________________________________________________________________________
____________________________________________________________________________
____________________________________________________________________________
____________________________________________________________________________
____________________________________________________________________________
____________________________________________________________________________
____________________________________________________________________________
____________________________________________________________________________
____________________________________________________________________________
____________________________________________________________________________
____________________________________________________________________________
____________________________________________________________________________
08/31/2020 28You can also read


