Energy Retail Report 2012 - Utility Regulator
←
→
Page content transcription
If your browser does not render page correctly, please read the page content below
Energy Retail Report
       2012

         1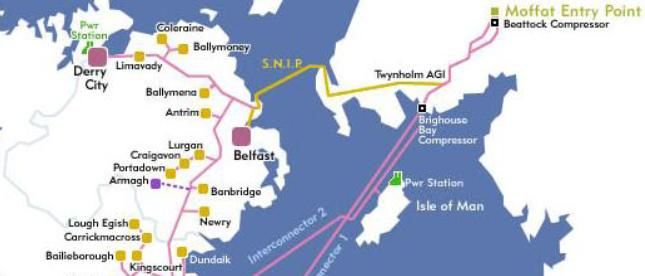
Table of Contents

Introduction ........................................................................................................................................................................................................... 3
PART ONE: BACKGROUND ................................................................................................................................................................... 7
1.          Overview of the electricity and gas sectors ......................................................................................................................... 7
            1.1. The Utility Regulator ............................................................................................................................................................. 7
            1.2. Price controls - A key function in protecting energy consumers................................................................ 8
            1.3. Structure of the Northern Ireland energy sector ............................................................................................... 11
            Wholesale market ....................................................................................................................... 14
            Networks .................................................................................................................................... 18
PART TWO: CORE RETAIL INFORMATION ............................................................................................................................ 23
2.          Retail orientated parameters ..................................................................................................................................................... 23
            2.1. Retail electricity parameters.......................................................................................................................................... 23
            2.2. Retail gas parameters....................................................................................................................................................... 36
3.          Energy prices ...................................................................................................................................................................................... 43
            3.1. Make up of a typical domestic bill.............................................................................................................................. 43
            3.2. Electricity prices: evolution and comparisons .................................................................................................... 46
            3.3. Gas prices: evolution and comparisons................................................................................................................. 49
PART THREE: KEY RETAIL WORK AREAS ............................................................................................................................. 52
4.          Monopoly regulation........................................................................................................................................................................ 56
5.          Market monitoring............................................................................................................................................................................. 57
6.          Customer protection........................................................................................................................................................................ 59
7.          Social issues ........................................................................................................................................................................................ 60
Glossary .............................................................................................................................................................................................................. 62
List of figures .................................................................................................................................................................................................... 63
List of tables ...................................................................................................................................................................................................... 64

                                                                                                           2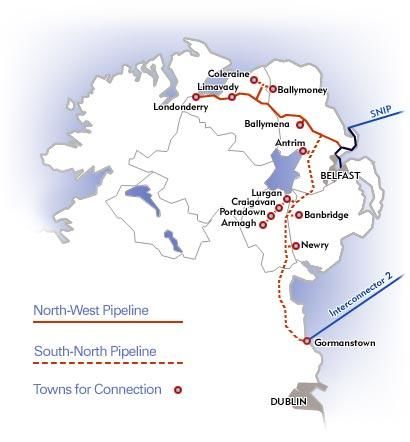
Energy Retail Report 2012
         Introduction
         This series of annual reports details information on the regulated energy sector in Northern
         Ireland. We thank our stakeholders, particularly in the regulated companies, for providing helpful
         information to complete our retail reports – both annually and quarterly – which enables us to
         continue to maintain the related database that we use for monitoring.
         The annual energy retail report is a live document. We intend to keep improving and adapting its
         content and coverage to the needs of our readers, and at the same time use it as a monitoring
         and information tool alongside the Quarterly Transparency Reports1 (QTRs). To that end, we
         welcome comments and views from readers and stakeholders in terms of how the report might be
         improved and new data sets or sources that would be useful to add to future editions. Comments
         are very welcome and should be sent to:
                Elena Ardines
                Retail and Social Directorate
                Utility Regulator
                Queens House
                14 Queen Street
                BELFAST
                BT1 6ED
                elena.ardines@uregni.gov.uk

         Purpose of the document
         Through this report we intend to deliver transparency for stakeholders and customers. The
         purpose of the report is to provide readers with readily accessible information on the work of the
         Utility Regulator (UR) and the energy sectors we regulate. It specifically focuses on the evolution
         and performance of Northern Ireland regulated retail energy markets: electricity and natural gas.
         With the arrival of energy supply competition at household level in 2010, transparency and
         information around the workings of our energy supply markets is more important than ever and as
         the number of participants to the market increase, this strengthens the need for transparency.
         The annual report is structured as follows:
         PART ONE: Background. This part covers general aspects of the Northern Ireland regulated
         energy sector. It gives a high level overview of how the energy sector functions, who the main
         companies are and the role of the UR.
         PART TWO: Core retail information. In this section we present information and data that will give
         information to stakeholders interested in Northern Ireland retail markets. It also helps us to
         monitor the functioning of the retail sectors as supply competition emerges.
         This section is complemented with the QTRs, which allow closer monitoring of competition
         development on a more frequent basis.

1
    http://www.uregni.gov.uk/publications/view/utility_regulator_publishes_retail_energy_market_monitoring_report/

                                                                3
PART THREE: Key retail work areas. This section provides a general overview of some key
       areas/projects we have progressed over the last year, or intend to progress, in the Retail and
       Social Directorate within the UR.

       Policy background to energy retail competition development
       In theory, effective competition can achieve better outcomes for customers than regulation. The
       benefits from greater energy retail competition might include:
             -   Innovation. New suppliers, with experience in other markets, are likely to bring to
                 market different products that extend consumer choice.
             -   Service standards. Competitive pressures, combined with effective industry systems,
                 should enable high service standards to be delivered flexibly and cost effectively.
                 Regulation can only effectively set a single standard which might be the average of
                 consumers‟ wishes, while competition can allow different supplier and product offerings
                 to differentiate service levels, with prices varying accordingly.
             -   Downward cost pressures. In the short term, from creating competitive pressure to
                 reducing costs in supply, and to be more efficient in the procurement of wholesale
                 energy. In the long- term, from dynamic efficiencies and improvements driven by
                 competition at both the firm and sectoral levels.
       EU law is explicit about the central role of competition to deliver consumer benefit. EU packages
       of energy legislation require Member States to achieve a “competitive, secure and
       environmentally sustainable market”. Energy Directives2 continue the pursuit of effective
       competition as an EU-wide policy goal and focus also on consumer rights and roles within retail
       markets ‘in order to allow consumers to take full advantage of the opportunities of a liberalised
       internal market’ in electricity and natural gas.
       Following all the above, we have actively pursued a policy of creating a fertile environment for
       greater electricity and gas supply3 competition. Also, the statutory remit given to us places a high
       value on effective competition as a means to deliver consumer benefits.
       Whilst there has been a demonstrable level of competition in the electricity market for business
       customers, household-level customers had no choice of electricity suppliers for many years. The
       only supplier in the domestic sector was Power NI until June 2010, when Airtricity entered this
       market offering electricity supply first to the credit segment and, a year later, to the keypad
       segment. During 2011 two more suppliers, Budget Energy and Electric Ireland, entered the
       domestic electricity market.
       The gas market in the Greater Belfast and Larne area has been open to competition since 2007
       for all customers. In this distribution licensed area there are currently four active gas suppliers in
       the non-domestic sector: Airtricity Gas Supply (AGS, previously Phoenix Supply Limited, PSL
       until mid 2012, when it was purchased by AGS), firmus energy, Energia and VAYU.
       Competition in the gas domestic sector in the Phoenix Natural Gas distribution area started in
       November 2010, with firmus entering the market.
       For the ten towns4 connected to the gas network outside of the Greater Belfast and Larne area,
       firmus energy currently retains the exclusive rights to supply gas to all customers. In October
       2012, the ten towns market opened to competition for the large non-domestic customers5.
2
  Directive 2009/72/EC concerning common rules for the internal market in electricity; and Directive 2009/73/EC concerning
common rules for the internal market in natural gas.
3
  The UR currently regulates the electricity and natural gas supply markets; not the home heating oil market.

                                                              4
The table below shows when competition effectively started in each of the energy market
segments, and when the areas still supplied by one incumbent supplier will be open to
competition.
Table 1 Energy Competition Opening
Electricity Gas (Greater Belfast and Larne area)
Domestic June 10: Airtricity entered the domestic credit Domestic Nov 10: firmus entered this market
segment. segment.
Oct 10: firmus started supplying Ulster Non- Four active gas suppliers since
Farmers' Union members. domestic 2007: Airtricity Gas Supply6 (AGS),
May 11: Airtricity entered the domestic keypad firmus energy, Energia and VAYU.
segment.
Gas (Ten Towns)
June 11: Budget Energy entry.
Oct 11: ESB/Electric Ireland entered the Domestic Apr 2015
domestic sector. and non-
domestic
small users
Non- Industrial electricity customers become eligible Large non- Oct 2012
domestic to change supplier from 1999. From 2005, domestic
small and medium businesses became eligible Users
too.
Feb 12: VAYU enters the non-domestic market
Apr 12: LCC enters the non-domestic market
This table shows a welcome development of early competition in our energy markets in both
electricity and gas, and we are hopeful of further entry into our energy markets by other suppliers
in the short to medium term.
However to further policy development, we believe that strong regulatory frameworks should
remain in place until we think that customers in Northern Ireland can realistically benefit from
effective competition. As we go forward we need to try to ensure that all customer groups benefit
from competition and switching opportunities, especially now that switching constraints in
electricity have been removed (following the implementation of the Enduring Solution in May
2012). Where they do not, we need to ensure that the regulatory structure continues to offer
customer protection to the same level as it affords customers today.
In that vein, in May 2012 we published our high level policy position7 in relation to the regulation
of energy supply markets over the next two to three years. The actions and projects resulting
from this decision paper will be taken forward as necessary and will be included in subsequent
forward work plans. They include the following:
- Retain maximum retail tariff setting and price controls on dominant incumbent suppliers.
- No „automatic‟ triggers to removal of current supply price controls.
4
Antrim, Armagh, Ballymena, Ballymoney, Banbridge, Coleraine, Craigavon, L‟Derry, Limavady and Newry.
5
http://www.uregni.gov.uk/uploads/publications/2011-02-21_Decision_paper_firmus_exclusivity.pdf
6
Formerly called Phoenix Supply Ltd (PSL)
7
http://www.uregni.gov.uk/uploads/publications/Regulatory_Approach_to_Energy_Supply_Competition_in_Northern_Ireland.pdf
5- Undertake further more disaggregated analysis on retail market sub-sectors for
monitoring purposes.
- Continue with quarterly retail market monitoring and gradually evolve scope of this
monitoring work.
- Revisit our Strategic Regulatory Approach as required given the market monitoring work
we are undertaking.
- Continue to explore options to improve the relationship between wholesale and retail
markets.
- Deliver effective competition from a consumer‟s perspective.
6PART ONE: BACKGROUND
1. Overview of the electricity and gas sectors
1.1. The Utility Regulator
The UR is an independent non-ministerial government department. Our role is to ensure that the
utility industries in Northern Ireland are regulated and developed within the strategic policy
parameters set out by the Northern Ireland Executive and the relevant legislation. We have a
broad range of functions carried out in line with statutory duties set out mainly in the Energy
(Northern Ireland) Order 2003 and the Water and Sewerage Services (Northern Ireland) Order
2006.
At the core of our duties and functions is the protection of the interests of present and future
water, sewerage, gas and electricity consumers in Northern Ireland.
The UR has four regulatory directorates:
Electricity Figure 1 Utility Regulator‟s internal structure
Gas Board & Senior
Executive Team
Retail and Social
Water
The directorates are responsible for the Water Gas
economic and consumer service regulation
of the three regulated sectors. Corporate Affairs
They are supported by a Corporate Affairs Electricity Retail &
directorate responsible mainly for finance Social
and administration, strategy development,
legal and communications.
The protection of consumer interests through effective regulation of the three regulated sectors is
achieved by:
- Protecting the interests of Northern Ireland consumers by effective and transparent scrutiny
and regulation of regulated companies.
- Protecting vulnerable consumers of the regulated companies.
- Ensuring that these companies comply with the relevant legislation and licence obligations.
- Encouraging regulated companies to be more efficient and responsive to consumers.
- Controlling the prices these companies charge to consumers.
- Working to encourage competition in the gas and electricity markets.
- Setting and monitoring standards of service which these companies provide to consumers.
- Acting as an adjudicator on certain consumer complaints, disputes and appeals.
- Carrying out our duties with the environment and sustainability in mind.
7There are many similarities in the work issues that we deal with in relation to each of the
regulated sectors, and to some degree that allows us to be more efficient and to adopt cross-
sectoral thinking and approaches to problems. However, there are also many work issues that
arise that are specific to an individual regulated sector. This can be the result of the individuality
of the sectors with which we interact; but to a significant degree it is also a symptom of the fact
that the maturity of the three sectors in the Northern Ireland context is different.
To find more about us, please visit: http://www.uregni.gov.uk/ .
1.2. Price controls – a key function in protecting energy consumers
It is argued that effective competition is the best mechanism to protect the interests of
consumers. However, there are areas of the gas and electricity industries where companies
retain an effective „natural monopoly‟ and where it may not be possible to introduce competition.
This applies to the transportation of electricity and gas to customers over national and local
networks of pipes and wires. Here incentive regulation, such as network price controls, is applied
to protect consumers' interests.
The standard price control is normally applied to natural monopoly network businesses (pipes
and wires), however, due to lack of competition in certain electricity and gas supply customer
categories (including domestic customers), a „supply‟ price control is in place in Northern Ireland
for the dominant gas (Airtricity Gas Supply (NI)) and electricity (Power NI) supply companies.
The main objectives of a price control are:
To ensure that monopolies do not abuse their position (i.e. an unregulated monopoly might
charge too high prices and/or provide too low level of quality, resulting in poor value for
money for consumers).
To provide companies with a future level of revenue and appropriate incentives to meet their
statutory duties and licence obligations.
At the same time, price control regulation provides incentives so companies can:
Manage and operate their networks in an economic, efficient and co-ordinated manner.
Offer a good quality of service to customers.
Invest in their networks in a timely and efficient manner.
Help ensure that the long-term security of supply is maintained.
Make any necessary changes to the networks, for example, helping development of
distributed generation and increasing reductions in the amount of electricity lost on the
distribution networks.
Price control methodology
A price control determines the allowed annual expenditure for the utility company. In order to
make this determination, the UR analyses each element of the costs submitted from the
company. We take into consideration historic costs, demand forecasts for the period of the
control, any changes in the gas or electricity industry, cost drivers and comparisons with GB and
8RoI. We also consult with the companies, DETI, the CCNI and other interested parties before
making a final determination8.
The amount of money that a monopoly network business can earn on its regulated business is
restricted by a Retail Price Index (RPI) - X price control that is reviewed every few years. It
controls prices, not profits, and encourages efficiency within the company. The RPI - X price
control takes the retail price index (the rate of inflation) as its benchmark and subtracts X (an
efficiency factor) from it. For example, at a time when annual inflation was three per cent, an X of
two would allow the company to raise prices by no more than one per cent 9.
The price control also includes incentive mechanisms to encourage companies to deliver what
customers require. For example, companies can be rewarded or penalised depending on the
quality of service they deliver.
Price controls provide a company with a level of revenue that is adequate to finance an efficient
business. This is based on an estimate of the costs companies face in running their business
including:
Operating expenditure: this covers the day-to-day costs of running the network, such as staff
costs, repairs and maintenance, overhead costs, etc.
Capital expenditure: this covers spending on assets, such as overhead lines, underground
cables, etc. The benefits of capital expenditure are expected to last over several years so
companies recover these costs over the assumed life of the asset.
Financing costs: this covers the costs in providing a reasonable return to the investors who
provide the capital and other financial facilities it requires. The rate of return on investment
assets is usually applied through the Weighted Average Cost of Capital (WACC) methodology
for network price controls, while supply price controls would apply an allowed margin on
turnover.
In WACC methodology the efficient The allowed margin on turnover is
level of the costs of the sources of judged by historical precedent and by
financing of a company (basically considering the margins obtained by
debt and equity), are weighted by its other businesses with similar risk
respective use in the situation of the characteristics.
price controlled company.
Taxation: the price control must provide sufficient cash flow to cover the tax liabilities, taking
into account, for example, the current rate of corporation tax.
What we price control in the energy sector
In the energy sector, we regulate through price control those companies that transport and, in
some cases also those that supply, gas and electricity (Power NI, NIE T&D, Phoenix Natural Gas,
Airtricity Gas Supply (NI) Ltd and firmus energy).
SEMO and SONI are also price controlled companies.
As the liberalisation process has evolved, some of the supply activities have previously been
taken out from the regulatory price control scrutiny, such as the energy supply to larger non
8
http://www.uregni.gov.uk/uploads/publications/Notes_-_Gas_price_controls_outcome_080409.pdf
9
http://www.ofgem.gov.uk/Media/FactSheets/Documents1/6610-factsheet39_march04.pdf .
9domestic customers. However, we believe that at least the existing regulatory frameworks should
remain in place at this time until contestability/competition is firmly evidenced, and until we
believe that customers in Northern Ireland can realistically expect to be protected by competition.
This is what our statutory duties require. Therefore, we intend to continue to monitor the whole
energy retail market to understand how competition is affecting different sub-sectors of
customers.
In the electricity sector, price control remains over all customers using less than 150 MWh/year.
For those customers, Power NI, the former incumbent electricity supplier, must offer the same
regulated retail tariffs to particular sectors of customers.
In the gas sector, price control remains over the domestic sector and I&C (industrial and
commercial) customers who consume less than 25,000 therms per annum.
Table 2 Current electricity price controls
Document Implementation Link to our website
Power NI Price Control 2011 – 2013 http://www.uregni.gov.uk/uploads/publicatio
ns/Decision_Paper_for_Power_NI_Price_C
ontrol_V1_0.pdf
SEMO Revenue and Tariffs 2010 - 2013 http://www.uregni.gov.uk/uploads/publicatio
(Consultation Paper) ns/SEM-10-0501.pdf
Power NI (Formerly NIE) Energy Ltd 2012 - 2015 http://www.uregni.gov.uk/publications/ppb_
– Power Procurement Business price_control_decision
(PPB) Price Control
Decision Paper
NIE T&D Price Control 2007-2012 http://www.uregni.gov.uk/news/regulator_pu
blishes_nie_td_price_control_final_determi
nation
SONI Price Control Decision Paper 2010-2015 http://www.uregni.gov.uk/uploads/publicatio
ns/SONI_Price_Control_decision_Paper_-
_FINAL.pdf
Table 3 Current gas price controls
Document Implementation Link to our website
firmus energy Price Control 2009 - 2013 http://www.uregni.gov.uk/uploads/publicatio
ns/Determination_for_firmus_energy_mark
et_development_review_summary_(2).pdf
Phoenix Supply Price Control 2012 - 2016 http://www.uregni.gov.uk/uploads/publicatio
Determination (now assigned to ns/PSL_PC03_Determined_to_Position.pdf
Airtricity Gas Supply)
Phoenix Distribution Price Control 2012 – 2013 http://www.uregni.gov.uk/uploads/publicatio
ns/PNGL12_Final_Decisions_FINAL.pdf
BGE (NI) Ltd Price Control 2012-
2012 – 2017 http://www.uregni.gov.uk/publications/bge_
2017 Determination
ni_2012_2017_price_control_determination
101.3. Structure of the Northern Ireland energy sector
Northern Ireland energy sector’s main agents
The Northern Ireland energy sector consists of the wholesale market, the networks and the retail
market.
The electricity wholesale market is where the generators and suppliers trade with each other.
Key regulatory issues are electricity generator issues and licenses, SEM, economic purchasing
obligations, hedging and wholesale energy purchasing strategies.
The networks are the pipes and wires used for the transportation of gas and electricity to
customers. Regulating networks consists mainly of effectively regulating natural monopolies and
incentivising efficient behaviour, guarding against market abuse by dominants, establishing a
level playing field and third party access to monopoly networks, price controls and taking into
account safety and environmental issues.
Retail markets are where suppliers trade with each other. Key regulatory issues in the retail
sector are developing effective competition that can benefit all customers, price control of the
former incumbent supplier (as monopolistic attributes remain and competition is insufficient to
fully protect customers) and customer protection in terms of price and service quality.
The figure below shows an overview of the main agents with a role in the gas and electricity
sectors in Northern Ireland. Some of them are also active participants in the RoI or GB energy
markets.
11Figure 2 Main agents in the energy sector in Northern Ireland
Viridian ESB Scottish and Bord Gáis Mutual Phoenix Companies
Group Southern non related
Group Éireann Energy Natural
Energy to a wider
(BGE) Gas group
ESBIg
Wholesale
BGE (UK)
Networks
LCC
Retail
Companies in the Northern Ireland energy sector
Source: UR
Note that Airtricity Energy Supply (Northern Ireland) Ltd purchased Phoenix Supply Ltd in June
2012. Phoenix Supply was subsequently renamed Airtricity Gas Supply (NI) Ltd (AGS) and now
trades under the Airtricity banner.
For information on electricity licences, please visit: http://www.uregni.gov.uk/electricity/
12Main energy assets
The table below shows a summary of the main energy assets located (totally or partially) in
Northern Ireland and their owners and how they are regulated.
Table 4 Main energy assets
OPERATOR & HOW THE UR PRICE
ACTIVITY ASSETS
OWNER REGULATES? CONTROL
Power station Ballylumford CCTG (1,213 AES Electricity Generation NO
MW) Licence. SEM from 1/11/2007
Power station Coolkeeragh CCTG (455 ESBIE Electricity Generation NO
MW) Licence
Power station Kilroot (Coal, Heavy Fuel AES Electricity Generation NO
618 MW) Licence
Interconnector Moyle Interconnectors Mutual Energy Moyle Interconnector NO
Transmission licence
Transmission North/South tie-lines NIE T&D Transmission licences YES
lines Tandragee - Louth Operated by SONI
Strabane-Letterkenny
Enniskillen-Corraclassy
Transmission 275 kV and 110 kV NIE T&D Transmission licences YES
system network Operated by SONI
Distribution 33 kV, 11 kV, 6.6 kV and NIE T&D Transmission Licence YES
System 400 V network
Transmission SNIP PTL (Premier Gas Transmission Licence NO[1]
pipeline Transmission
Limited)
Pipeline BGTP Belfast Gas Gas Transmission Licence NO
Transmission
Pipeline
Transmission NW (Northwest) & SN Owned by BGE Gas Transmission Licence YES
pipelines (South North) pipeline (UK)
Distribution PNG network Phoenix Natural Gas Distribution Licence YES
pipelines firmus network Gas
firmus energy
[1]
To improve the rate at which the SNIP and BGTP could be financed the normal regulatory control over any allowed
operational expenditure accrued by both PTL and BGTL has been removed. The resulting transfer of risk onto consumers,
through potential inefficient operating costs, can be limited through corporate governance licence conditions contained within
the conveyance licences held by both PTL and BGTL. One of which is a condition that, in the form of a shadow price control,
allows the Utility Regulator to review the level of operating expenditure forecast to be incurred by PTL and BGTL.
13System Operator (SONI) www.soni.ltd.uk
SONI Ltd is the Transmission System Operator (TSO) in Northern Ireland, owned by Eirgrid plc,
the TSO in the Republic of Ireland. Its role is to ensure the safe, secure and economic operation
of the high voltage electricity grid in Northern Ireland. As electricity cannot currently be stored in
any meaningful quantity, SONI must balance the generation with the demand in real time.
In conjunction with Eirgrid, SONI is the SEMO, the responsible for the operation of the Single
Electricity Market on the island of Ireland.
Market Operator (SEMO) www.sem-o.com
SEMO is the Single Electricity Market Operator, responsible for the administration of the
wholesale electricity market. SEMO is a joint venture between EirGrid PLC, the transmission
system operator for the RoI, and SONI.
It is licensed and regulated cooperatively by the CER and the UR since 2004, when a
memorandum of understanding was signed by both regulatory authorities.
Consumer Council for Northern Ireland (CCNI) www.consumercouncil.org.uk/
The Consumer Council is an independent statutory body funded by the DETI. It aims to promote
and safeguard the interests of all consumers in Northern Ireland. It has statutory responsibilities
for energy (including natural gas, electricity and coal), passenger transport and food. From April
2007 it also became the consumer representative body for water and sewerage services.
They provide free, impartial information, and handle complaints on behalf of consumers who have
been unable to resolve problems directly with their energy supplier or meter operator. They
provide consumer advice in relation to energy issues, liaise with customers, energy companies,
the UR and other relevant parties.
They also undertake research and produce publications on issues such as fuel poverty, energy
efficiency, renewable energy and fuel prices.
Wholesale market
The Single Electricity Market (SEM) was created in 2007 and represents the first market of its
kind in the world as a gross mandatory pool, operating with dual currencies and in multiple
jurisdictions.
All electricity produced on the island is sold into one large pool, while supply companies buy their
power out of this pool with equal access for all suppliers. Generators with a capacity greater than
10 MW must have a licence to operate and must sell their entire output into the Single Electricity
Market. Generators with a capacity below 10 MW are able to sell their power directly to suppliers
and can decide their own production schedule.
The SEM ensures that the price of electricity charged to consumers is reflective of the costs
incurred by the generators to actually produce the electricity, with the most efficient generators
that are available to meet demand being used on an all-island basis. The market is specifically
designed to set the cheapest possible price for electricity at all times, and to ensure that no
company has an undue influence over electricity prices.
14The SEM is regulated by the SEM Committee and monitored by the UR‟s Market Monitoring Unit.
It can be considered an important development for the energy sector on the island, with benefits
to all customers such as improving choice across the island and enhancing electricity security of
supply.
For further information on the SEM, please visit www.allislandproject.org.
Figure 3 Structure of the electricity sector in Northern Ireland
Renewable
Generation NIEES (Regulated)
Single
Electricity Electricity
Market Customers
Conventional
Generation Other suppliers
Wholesale Networks Supply
Source: UR
Conventional generation
Northern Ireland has three major electricity generating stations.
The largest one is Ballylumford power station which is a natural gas-fired power plant. It
consists of a 587 MW CCGT10 station, a conventional 510 MW thermal plant; and two OCGT11
units which provide an additional 116 MW nominal capacity for grid support and emergency
response. Coolkeeragh power station is a natural gas fired combined cycle power plant and a
OCGT, with total capacity of 455 MW. Kilroot power station (618 MW) is the only coal fired plant
(dual coal and oil fired) left in Northern Ireland.
In Northern Ireland, electricity is also obtained from GB through the Moyle Interconnector, the
undersea link between the electricity grids of Northern Ireland and Scotland. It was opened in
2002. The link has an importing capacity of 500 MW and an exporting capacity of 80 MW.
In relation to the overall SEM on the island of Ireland, the generation fuel mix include gas, coal,
peat, etc. Most of the generation capacity is gas-fired, with more than 4,000 MW of combined
cycle plant and around 1,500 MW of other gas-fired plant including open cycle. For further
information on generation capacity, please visit http://www.eirgrid.com/media/All-
Island%20GCS%202012-2021.pdf .
10
Combined Cycle Gas Turbine (CCGT): a unit whereby electricity is generated by a gas powered turbine and also a second
steam-powered turbine. The hot exhaust gases expelled from the first turbine are fed into the heat exchanger to generate
steam which powers the second turbine.
11
Open Cycle Gas Turbine (OCGT): a unit whereby electricity is generated by a gas powered turbine and no use is
made of the hot exhaust gases.
15Renewable Energy Sources (RES)
In 2011 (April 11 – April 12) 14.71% of electricity supplied in Northern Ireland was generated from
RES and CHP12. In the same period of 2010, the percentage was 9.16%. The figure below
compares the total electricity distributed in Northern Ireland against the generation of electricity
through renewable energy and CHP.
The Strategic Energy Framework for Northern Ireland13 restated the current target of 12% of
electricity consumption from renewable resources by 2012. The new additional target agreed by
the Executive is 40% of electricity consumption from renewable resources by 2020.
Figure 4 Renewable and CHP generation vs. total electricity distributed
RES and CHP Generation compared to
MWh
Total Electricity Distributed
900,000
Total
800,000 Electricity
700,000 Distributed
600,000 (MWh)
500,000
400,000 Total
300,000 Renewable
Energy inc
200,000
Snugborough
100,000
Wind Farm
0
Apr-10
Apr-11
Apr-12
Apr-09
Oct-09
Oct-10
Oct-11
Jan-10
Jan-11
Jan-12
Jul-09
Jul-10
Jul-11
Source: NIE
12
Combined Heat and Power (CHP): The simultaneous generation of electricity and heat for use within buildings or processes,
by recovery of the heat produced in the power generation process. As such, CHP represents the highest efficiency means of
generating electricity.
13
Strategic Energy Framework www.detini.gov.uk/strategic_energy_framework__sef_2010_.pdf
16Figure 5 shows the breakdown
of RES and CHP production for Figure 5 Renewable and CHP generation
the current year and the prior RES and CHP generation
year. Wind generation has
100%
experienced a slight increase, 3% 3%
98% Snugborough (Wind)
from 89% to 91%. On the
96% PV
contrary, landfill gas production 5%
94% CHP
has suffered a small decrease, 7%
from 7% to 5% in Jun 11 to May 92% 1% Landfill Gas
12. 90% Biomass
1%
88% Tidal
The Renewables Obligation is a 86% 91%
89% Hydro
statutory requirement on
84% Wind
electricity suppliers to source an
82%
increasing portion of their Jun 10-May11 Jun 11-May12
electricity from renewable
Source: NIE
sources. In Northern Ireland the
obligation was set at 4.27 ROCs
per 100 MWh. The total Renewables Obligation in Northern Ireland in 2010/11 was 354,759
MWh.
For further information on the Renewables Obligation, please visit Ofgem‟s website:
http://www.ofgem.gov.uk/Sustainability/Environment/RenewablObl/Pages/RenewablObl.aspx
Gas sources
There are no indigenous sources of gas in Northern Ireland, it all comes via undersea pipelines
from GB. Natural gas arriving to Northern Ireland is bought on the UK National Balancing Point,
and then transported throughout pipelines. The UR has no direct regulatory control over the
wholesale gas market, and prices tend to be set based on national and international
demand/supply factors.
Gas arrived in Northern Ireland in 1996 with the completion of the Scotland-Northern Ireland
Pipeline (SNIP), and pipelines of Belfast Gas Transmission Limited which delivered gas to the
Ballylumford power station and to the Phoenix distribution network in Greater Belfast. The North-
West and South-North pipelines were completed in 2004 and 2006 respectively, allowing the
development of distribution networks.
Natural gas is the least polluting fossil fuel and it provides a further fuel choice for industry.
Natural gas also provides domestic customers with the opportunity to convert from inefficient
central heating systems to highly efficient gas condensing boilers and in due course to domestic
combined heating power. Since its arrival, it has brought environmental, economic and social
benefits.
CCGT technology is used to produce electricity from natural gas combustion. It offers lower cost
and the least environmentally damaging form of fossil-fuelled electricity generation.
However, the availability of natural gas is desirable because of the environmental and social
benefits. Natural gas as an energy option has the following advantages:
17 Less atmospheric pollution: the use of natural gas as a fuel creates less CO 2 emissions
than traditional generation (natural gas produces 25% less carbon dioxide emissions
than other fossil fuels).
Efficiency: the combined cycle power plants have an approximate efficiency of 55%,
while in coal or fuel generation plants the comparative figure is approximately 30-35%.
Security of supply: through diversification of energy sources.
Networks
The networks are the pipes and wires used for the transportation of gas and electricity to
customers.
Figure 6 Structure of the gas sector in Northern Ireland
UK Gas Phoenix Supply /firmus (Regulated)
Market
(National Gas
Balancing Customers
Point) Other suppliers
Wholesale Networks Supply
Source: UR
Electricity transmission and distribution networks
The Northern Ireland electricity grid comprises approximately 2,100km of transmission network
and 42,900km of distribution network, including overhead lines and underground cables.
There are more than 840,000 customers connected to the distribution system, which links the
three power stations and external interconnectors to 30 main substations. SONI directs the output
of each generating unit on the Northern Ireland system to match supply to demand.
The transmission and distribution assets belong to NIE who are responsible for planning,
developing and maintaining the transmission system in Northern Ireland. They are under the UR
Price Control.
The transmission and distribution business derives its revenue principally through Use of System
(UoS) charges levied on suppliers that use the transmission and distribution systems. The
Statement of Charges for Use of the Northern Ireland Electricity plc Transmission System and
Statement of Charges for Use of the Northern Ireland Electricity plc Electricity Distribution System
are annually published by SONI after receiving the UR‟s approval. Charges are also applied for
the System Support Services (SSS).
18Interconnectors
Northern Ireland‟s electricity grid is linked to the Republic of Ireland through one major
interconnector between the two grids. The current Louth to Tandragee interconnector consists of
a 275kV double circuit overhead line and it has an approximate capacity of 500 MW. The SEM
High Level Design Decision Paper sets out that the North-South interconnector should be treated
as a transmission line for the purposes of congestion management by the TSOs.
There are current plans to expand cross-border interconnection between Northern Ireland and the
RoI. Increasing and expanding cross border interconnection through the building of the second
North-South tie-line will help facilitate a more stable, secure and efficient all-island system. In the
absence of the second tie-line consumers are facing higher costs due to a less than optimal
dispatch of generators resulting in higher production costs and the requirement for a larger overall
amount of installed generation capacity to meet the security of supply standards in both
jurisdictions. Eirgrid and SONI have estimated the benefits currently being lost by the absence of
a second North-South line to be in the order of €20m per annum. Any delays to the
implementation of the additional tie-line will increase security of supply risks in NI.
There are also two small 110kV standby North-South interconnectors (Strabane - Letterkenny
and Enniskillen – Corraclassy) which allow SONI and Eirgrid to provide mutual short term
technical assistance.
In addition, there is the Moyle Interconnector, which holds the Moyle Interconnector Transmission
licence. This transmission asset is treated as an interconnector for the purposes of SEM
permitting capacity holders on Moyle to trade power between the SEM and BETTA markets.
Figure 7 Northern Ireland Electricity Transmission System
Source: SONI and Eirgrid
19Gas transmission and distribution pipelines
In 1996 the original gas pipeline connecting
Scotland and Northern Ireland was built (SNIP). Figure 8 Moyle interconnector
Subsequently, two further transmission pipelines
were built.
The North-West Pipeline was completed in 2004
to transport gas from Belfast to L/Derry, serve the
Coolkeeragh power station and also enable the
development of gas networks adjacent to the
route. The South-North Pipeline was completed in
2006, running from Gormanstown, in the RoI, to
Belfast, where it links into the North-West
pipeline.
These pipelines have allowed the development of
distribution and supply networks servicing a
number of towns along the routes, known as the
ten towns.
Source: SONI
Currently all Northern Ireland demand is supplied
(http://www.soni.ltd.uk/interconnector_moyle.asp).
via the SNIP, however, arrangements are in place
to facilitate the use of the South-North Pipeline in
the event of an emergency in Northern Ireland or
in the RoI.
Figure 9 The gas transmission network in Northern Ireland
20Source: Joint Capacity Statement 2011
Northern Ireland has three gas TSOs, Premier Transmission Limited (PTL), Belfast Gas
Transmission Limited (BGTL) and BGÉ (UK) Ltd. The transmission companies are required under
their conveyance licences to prepare plans for the operation, development and maintenance of
the transportation system.
Planning and development of the distribution network is the responsibility of the respective
distribution system operators with development and capacity obligations set out in the respective
licences. The Northern Ireland distribution system is comprised of two networks:
The Phoenix Natural Gas network in the Greater Belfast and Larne area, which had
around 145,000 connections at the end of 2011.
The firmus energy network in the ten towns along the South-North Pipeline and North-
West Pipeline which had about 13,000 connections at the end of 2011.
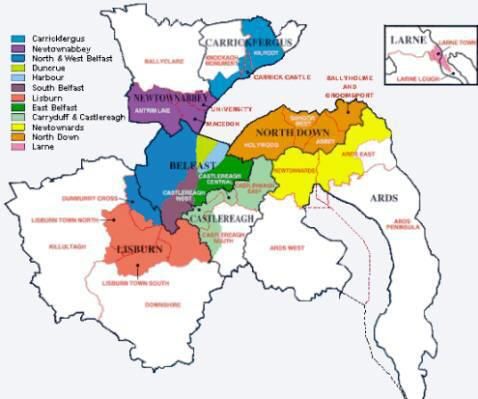
Figure 10 Maps of Northern Ireland gas distribution systems
Map of the Phoenix Area (all areas shown in colour) Map of the BGE and firmus area
Source: Phoenix Natural Gas Limited Licence for the Source: firmus energy
conveyance of gas in NI14
For information on gas licences, please visit the following link: http://www.uregni.gov.uk/gas/
14
PNG‟s licensed area includes also some other areas not shown in the map above. Those are detailed in the licence
(http://www.uregni.gov.uk/uploads/licenses/GAS_Phoenix_Natural_Gas_Limited_Distribution.pdf).
21Other gas developments: extending the gas network
Following an initial feasibility study and public consultation, the Department of Enterprise Trade
and Investment (DETI) has continued to make progress on potential network extension. During
the summer of 2012 the Department commissioned an Outline Business case which will form the
basis of an approach to the Department of Finance and Personnel for government subvention in
support of network extension. Any subvention will require approval by the Northern Ireland
Executive Committee. Following Executive Committee approval the Utility Regulator will be
responsible for carrying out a competitive process to award the necessary license(s).
22PART TWO: CORE RETAIL INFORMATION
Introduction
As part of our ongoing monitoring of the retail energy markets, we quarterly collect, analyse and
publish some key basic supply energy market information which we publish on our website
through the Quarterly Transparency Reports (QTRs)15. These provide useful information on both
Northern Ireland gas and electricity sector, related to the number of active suppliers in the market,
switching activity, market shares of every supplier, and domestic price comparisons.
In this section of the annual report we show annual figures for those key elements. We have used
the calendar year (January to December 2011) for ease of comparison between both electricity
and gas sector, and also to RoI and GB. We have also included most recent information where
available for some parameters (i.e. switching).
2. Retail orientated parameters
2.1. Retail electricity parameters
(i) Customer numbers (electricity)
By the end of 2011, there were more Figure 11 Northern Ireland electricity customers
than 828,000 electricity customers in
Northern Ireland (in comparison to Evolution in electricity
824,655 at the end of 2010). By June Number of
customer numbers
customers
2012 this number has increased more 840,000
steadily to 842,574. Approximately 93%
of these are domestic customers, while 800,000
the non-domestic customers are around
7% of the total Northern Ireland 760,000
electricity customer base. The evolution
in the number of customers per calendar 720,000
year is shown in the opposite figure.
680,000
Further breakdown of customer numbers 2003 2004 2005 2006 2007 2008 2009 2010 2011
at the end of 2011 by market segment is
shown below, in absolute figures and Source: NIE T&D
percentages. Within the domestic sector,
the split shows that 33% of customers use keypad meters and that 60% of domestics are
standard credit customers. In the non-domestic sector the largest number of customers are in the
Small and Medium Enterprises (SME) category, which includes businesses with demand below
1MW per annum. This category further splits into those who consume less and more than 70
kVA, which aligns with the Statement of Charges for Use of the Electricity Distribution System 16.
15
http://www.uregni.gov.uk/publications/view/utility_regulator_publishes_retail_energy_market_monitoring_report/
16
http://www.nie.co.uk/suppliers/pdfs/DUoS_Statement_Oct10%20-%20Sept11.pdf
23Figure 12 Customer numbers by market segment at the end of 2011
Electricity customer numbers by
market segment (Dec 2011)
0.59%
2011 Customer numbers 0.02%
6.57%
Domestic Credit 494,154
Domestic Keypad 275,178
SME 70kVA 4,849 33.20%
Domestic Credit
LEU >1MW 172 59.62% Domestic Keypad
Total 828,787 SME 70kVA
LEU >1MW
Source: NIE T&D
The percentages above showing the customer split by market segment have remained relatively
stable over the last number of years.
Figure 13 below shows the evolution in customer numbers over the last two calendar years by
customer segment. A very slight increase is noticeable in the percentage of keypad customers in
comparison to other payment methods which may be attributable to the marketing of discounts
offered.
Figure 13 Evolution in customer numbers by market segments
Market segment evolution in customer
numbers
900,000
800,000
700,000
600,000
500,000
400,000 LEU >1MW
300,000 SME >70kVA
200,000 SMEannum. However, the last years have shown smaller increases and even decreases, probably
due to generally poor economic conditions. The consumption in 2010 was 8,286.5 GWh, while
consumption in 2011 was lower totaling 8,085.5 GWh.
Figure 14 Northern Ireland electricity consumption
GWh Evolution in electricity consumption
9,000.0
8,000.0
7,000.0
6,000.0
5,000.0
4,000.0
2008 2009 2010 2011
Source: SONI
A more detailed breakdown of consumption between the different market segments in the current
year is shown below. During 2011, the electricity consumption was 39% in the domestic sector
and 61% in the non-domestic sector, in comparison to a spilt of 40% and 60% in the previous
year.
Figure 15 Consumption by market segment in 2011
Electricity consumption by market
Consumption segment in 2011
2011
(GWh)
Domestic Credit 2,132.39
19.35%
Domestic Keypad 1,036.29 26.37%
SME 70kVA 2,062.61
25.51% 12.82%
LEU >1MW 1,564.77 Domestic Credit
Total consumption 8,085.49 Domestic Keypad
15.95% SME 70kVA
LEU >1MW
Source: NIE T&D
25Figure 16 below shows consumption evolution over the last three years. It is noticeable that there
has been a slight decrease on total consumption, across all categories except for keypad where
there has been a slight increase.
Figure 16 Evolution in consumption by market segments
Market segment evolution in consumption
GWh
9,000
8,000
7,000
6,000
5,000
LEU >1MW
4,000
SME >70kVA
3,000
SMEFigure 17 Domestic credit market shares, by customer numbers
and consumption
2011 Customer Market share Consumption Market share
Domestic credit numbers (customers) (GWh) (consumption)
Power NI 431,276 87.28% 1,900.49 89.12%
Airtricity 61,221 12.39% 223.65 10.49%
Electric Ireland 74 0.01% 0.04 0.00%
firmus 252 0.05% 6.85 0.32%
Budget Energy 1,331 0.27% 1.36 0.06%
Total 494,154 100% 2,132.39 100%
Domestic credit market share Domestic credit market share
(consumption) (customers)
100% 100%
80% 80%
Budget Energy Budget Energy
60% 60%
firmus firmus
40% Electric Ireland 40% Electric Ireland
Airtricity Airtricity
20% 20%
Power NI Power NI
0% 0%
Q1 Q2 Q3 Q4 Q1 Q2 Q1 Q2 Q3 Q4 Q1 Q2
2011 2012 2011 2012
Source: NIE T&D
From the start of effective competition in the domestic market in June 2010, the share of the
previously incumbent electricity supplier, Power NI, has been decreasing progressively. The table
above shows Northern Ireland suppliers‟ market shares for 2011 and the graphs also show the
shares for the first quarter of 2012.
In terms of trends in market shares, at the end of 2011, Power NI‟s share in the domestic credit
sector by customer numbers and consumption was 87.3% and 89.12% respectively, in
comparison to 96.1% and 98.7% in the prior year. As the graph in figure 17 shows, this share
continues to diminish by the second quarter of 2012 to 83.2% by customer numbers and 83.1%
by consumption.
Despite the developing competition from new suppliers, Power NI remains very dominant in this
sector – and hence as described in earlier sections, UR retains the price controls.
27Figure 18 Domestic keypad market shares, by customer numbers
and consumption
2011 Customer Market share Consumption Market share
Domestic keypad numbers (customers) (GWh) (consumption)
Power NI 259,581 94.33% 1,014.64 97.91%
Airtricity 10,391 3.78% 15.39 1.49%
Electric Ireland 2 0.00% 0.00 0.00%
firmus 0 0.00% 0.00 0.00%
Budget Energy 5,204 1.89% 6.26 0.60%
Total 275,178 100% 1,036.29 100%
Domestic keypad market share Domestic keypad market share
(customers) (consumption)
100% 100%
80% 80%
Budget Energy
60% Budget Energy 60%
firmus
firmus
40% 40% Electric Ireland
Electric Ireland
Airtricity
20% Airtricity 20%
Power NI
Power NI
0% 0%
Q1 Q2 Q3 Q4 Q1 Q2 Q1 Q2 Q3 Q4 Q1 Q2
2011 2012 2011 2012
Source: NIE T&D
Competition in the prepayment electricity sector began in May 2011, when Airtricity launched their
tariff offerings to keypad customers. A few months later, Budget Energy entered the domestic
market including the keypad segment.
The presence of Power NI is still very strong, as the graphs above in figure 18 illustrate. In spite
of this, new suppliers continue to increase their market share. By the end of 2011, new entrant
suppliers represented 5.67% of market share (by customer) and 2.09% of market share (by
consumption). By the second quarter of 2012 these new suppliers have continued to increase
their market share representing 11.1% of market share by customers and 16.3% of market share
by consumption. Budget Energy and Airtricity are quickly increasing their presence in this
particular market segment. Most recent figures show that by the end of Q2 2012, they had a
customer numbers share of 4.0% and 7.0% and by consumption 5.7% and 10.5% (respectively).
28Figure 19 SME < 70kVA market shares, by customer numbers and
consumption
2011 Customer Market share Consumption Market share
SMEFigure 20 SME > 70kVA market shares, by customer numbers and
consumption
2011 Customer Market share Consumption Market share
SME>70kVA numbers (customers) (GWh) (consumption)
Power NI 1,190 24.54% 291.13 14.11%
Airtricity 1,284 26.48% 464.91 22.54%
Energia 1,085 22.38% 631.70 30.63%
Electric Ireland 1,258 25.94% 655.43 31.78%
firmus 29 0.60% 17.76 0.86%
Quinn Energy 3 0.06% 1.68 0.08%
Budget Energy 0 0.00% 0.00 0.00%
Total 4,849 100% 2,062.61 100%
SME>70kVA market share (customers) SME>70kVA market share (consumption)
100% LCC 100% LCC
90% Vayu 90%
Vayu
80% 80%
Budget Energy
70% 70% Budget Energy
60% Quinn Energy 60% Quinn Energy
50% firmus 50%
40% firmus
Electric Ireland 40%
30% 30% Electric Ireland
Energia
20% 20%
Airtricity Energia
10% 10%
0% Power NI 0% Airtricity
Q1 Q2 Q3 Q4 Q1 Q2 Q1 Q2 Q3 Q4 Q1 Q2 Power NI
2011 2012 2011 2012
Source: NIE T&D
There were six active suppliers in the I&C customers over 70 kVA sector in 2011. By Q2 2012,
the number of active suppliers has increased to eight, with the entrance of Vayu and LCC.
Over 2011, shares of the four main suppliers are very similar in terms of customer numbers,
ranging from 22.4% to 26.5%. The distribution of shares in this market segment seems to be
relatively stable over the last four quarters. The interval has a much wider spread when referring
to the market shares by consumption (ranging from 14.1% to 31.8%) due to the fact that
customer usage is much higher in this category.
In the SME > 70 kVA market segment, the combined market share for Power NI and Energia, the
suppliers who both belong to the Viridian Group, were 46.92% by customer numbers, and
44.74% by consumption in 2011.
30Figure 21 LEU > 1 MW market shares, by customer numbers and
consumption
2011 Customer Market share Consumption Market share
LEU > 1MW numbers (customers) (GWh) (consumption)
Power NI 9 5.23% 63.80 4.08%
Airtricity 42 24.42% 346.88 22.17%
Energia 59 34.30% 433.92 27.73%
Electric Ireland 59 34.30% 596.78 38.14%
firmus 3 1.74% 20.40 1.30%
Quinn Energy 0 0.00% 103.00 6.58%
Total 172 100% 1,564.77 100%
LEU>1MW market share (customers) LEU>1MW market share (consumption)
100% 100%
90% 90%
80% 80%
70% Quinn Energy 70% Quinn Energy
60% firmus 60% firmus
50% 50%
Electric Ireland Electric Ireland
40% 40%
30% Energia 30% Energia
20% Airtricity 20% Airtricity
10% 10%
0% Power NI Power NI
0%
Q1 Q2 Q3 Q4 Q1 Q2 Q1 Q2 Q3 Q4 Q1 Q2
2011 2012 2011 2012
Source: NIE T&D
In 2011 the LEU market segment represented 0.6% of the total customer base in NI, with 172
customers, while their consumption was 19.4% of the total Northern Ireland electricity
consumption in that year. Most recent figures show that by Q2 2012, the number of customers in
this size band has increased to 187.
In 2011 there were six active suppliers in this market segment. (Quinn Energy withdrew from the
market at the start of 2012, leaving five active suppliers in this category). The shares of three of
the suppliers (Airtricity, Energia and Electric Ireland) in this segment have been quite stable over
the year in terms of both customer numbers and consumption. Over the first half of 2012, Power
NI‟s market share by customer numbers increased from 5.2% at the end of 2011 to 11.2%.
Meanwhile, their share on consumption increased from 4.1% at the end of 2011 to 4.6% at Q2
2012.
firmus has also increased their market share over time. Their customer numbers at the end of
2011 was 1.7%, while their share by consumption was 1.3%. By the end of Q2 2012, their shares
were 3.2% and 8.0% respectively.
Switching data (electricity)
We classify a switch when a customer changes supplier, and it is a free choice a customer makes
to move from one supplier to another. For clarity, it can include the following:
31You can also read