ENERGY SCENARIOS FOR URBAN SOUTH AFRICA: Exploring the implications of alternative energy futures up to 2050 - (V-LED) project
←
→
Page content transcription
If your browser does not render page correctly, please read the page content below
ENERGY SCENARIOS FOR URBAN SOUTH AFRICA:
Exploring the implications of alternative energy futures up to 2050

January 2016

                                Produced by

                             With the support of

                                                                      Page 1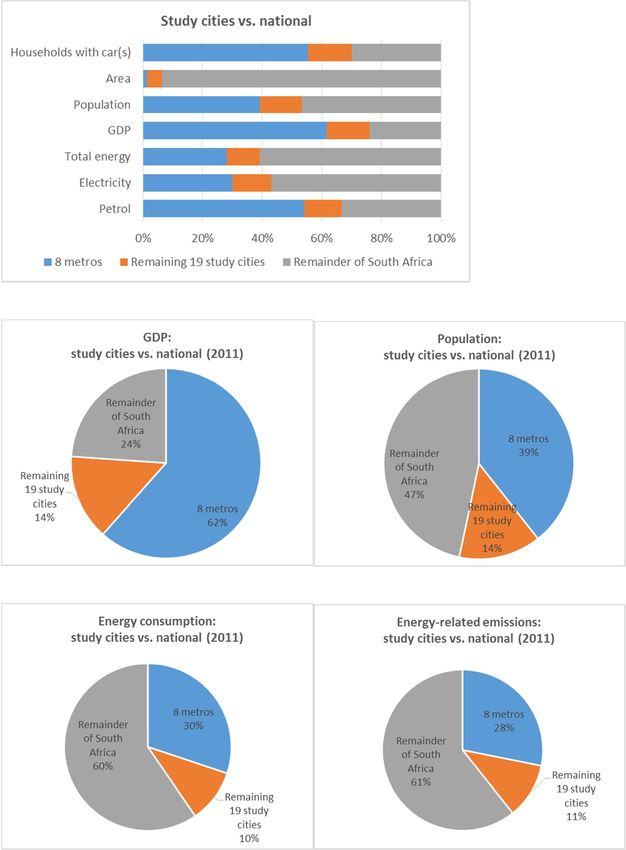
Table of Contents
1.     Acronyms and Terms .................................................................................................................... 3
2.     Figures........................................................................................................................................... 3
3.     Tables ............................................................................................................................................ 4
4.     Introduction .................................................................................................................................. 5
     4.1.     Background and Purpose ...................................................................................................... 5
     4.2.     Study Scope ........................................................................................................................... 6
     4.3.     Overview of Municipalities.................................................................................................... 6
5.     Methodology .............................................................................................................................. 12
     5.1.     Overview.............................................................................................................................. 12
     5.2.     Data Problems and Limitations ........................................................................................... 13
     5.3.     Key Inputs and Drivers......................................................................................................... 14
     5.4.     Energy Supply ...................................................................................................................... 15
     5.5.     Calculating Electricity Supply for LEAP ................................................................................ 20
     5.6.     Residential Sector ................................................................................................................ 21
     5.7.     Commercial and Institutional Sector................................................................................... 24
     5.8.     Industrial Sector .................................................................................................................. 25
     5.9.     Agricultural Sector ............................................................................................................... 25
     5.10.       Transport Sector .............................................................................................................. 26
     5.11.       Demand-Side Interventions ............................................................................................. 28
     5.12.       Supply-Side Interventions ................................................................................................ 34
6.     Baseline Energy and Emissions ................................................................................................... 36
     6.1.     Context ................................................................................................................................ 36
     6.2.     Energy and Emissions Overview .......................................................................................... 39
     6.3.     Transport ............................................................................................................................. 40
     6.4.     Built Environment................................................................................................................ 43
7.     Energy Futures Results ............................................................................................................... 45
     7.1.     Business as Usual................................................................................................................. 45
     7.2.     Sensitivity Test..................................................................................................................... 48
     7.3.     Demand-Side Interventions ................................................................................................ 49
     7.4.     Supply-Side Interventions ................................................................................................... 55
     7.5.     Other Scenarios ................................................................................................................... 61

                                                                                                                                                 Page 2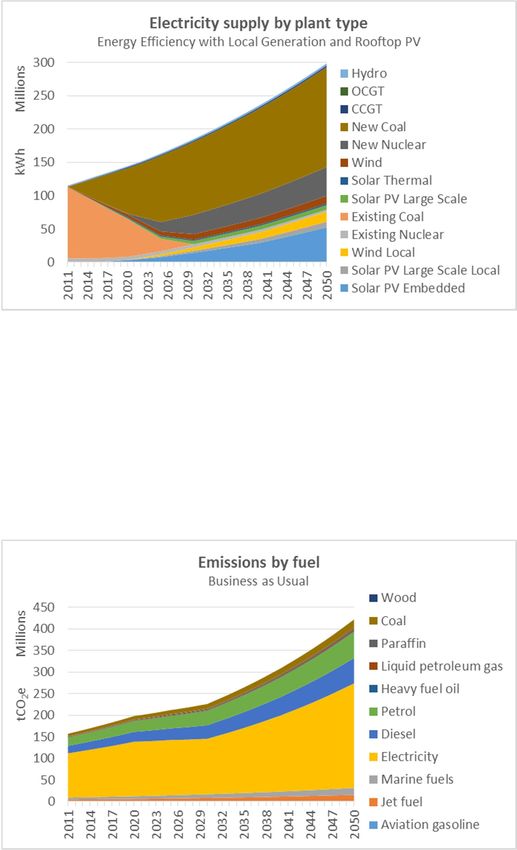
1. Acronyms and Terms
BAU Business as Usual Scenario
BRT Bus Rapid Transit
CCGT Combined Cycle Gas Turbine
CFL Compact Fluorescent Light
COUE Cost of Unserved Energy
CPI Consumer Price Index
CSP Concentrated Solar Power
DoE National Department of Energy
ERC Energy Research Centre
ETE Electricity and Transport Efficiency Scenario
GDP Gross Domestic Product
GHG Greenhouse Gas
GJ Gigajoule
GVA Gross Value Added
HVAC Heating, Ventilation and Cooling
IPCC Intergovernmental Panel on Climate Change
IPP Independent Power Producer
IRP Integrated Resource Plan
kWh Kilowatt-hour
LEAP Long-Range Energy Alternatives Planning
LED Light-Emitting Diode
MWh Megawatt-hour
NERSA National Energy Regulator of South Africa
NMT Non-Motorised Transport
O&M Operations and Maintenance
OCGT Open Cycle Gas Turbine
Pass-km Passenger-kilometre
PV Photo-Voltaic
PWR Pressurised Water Reactor
SEA Sustainable Energy Africa
SSEG Small-Scale Embedded Generation
SWH Solar Water Heater
tCO2e Tonnes of Carbon Dioxide Equivalent
2. Figures
Figure 1: GVA by sector for study cities ............................................................................................... 7
Figure 2: Emissions per capita in study cities vs. South Africa, Sub-Saharan Africa and the world .. 37
Figure 3: Emissions per economic unit in study cities vs. South Africa, Sub-Saharan Africa and the
world .................................................................................................................................................. 37
Figure 4: Various indicators of study cities (including metros) as a proportion of national ............. 38
Figure 5: GDP and population of study cities (including metros) as a proportion of national .......... 38
Figure 6: Energy consumption and energy-related emissions of study cities (including metros) as a
proportion of national ....................................................................................................................... 39
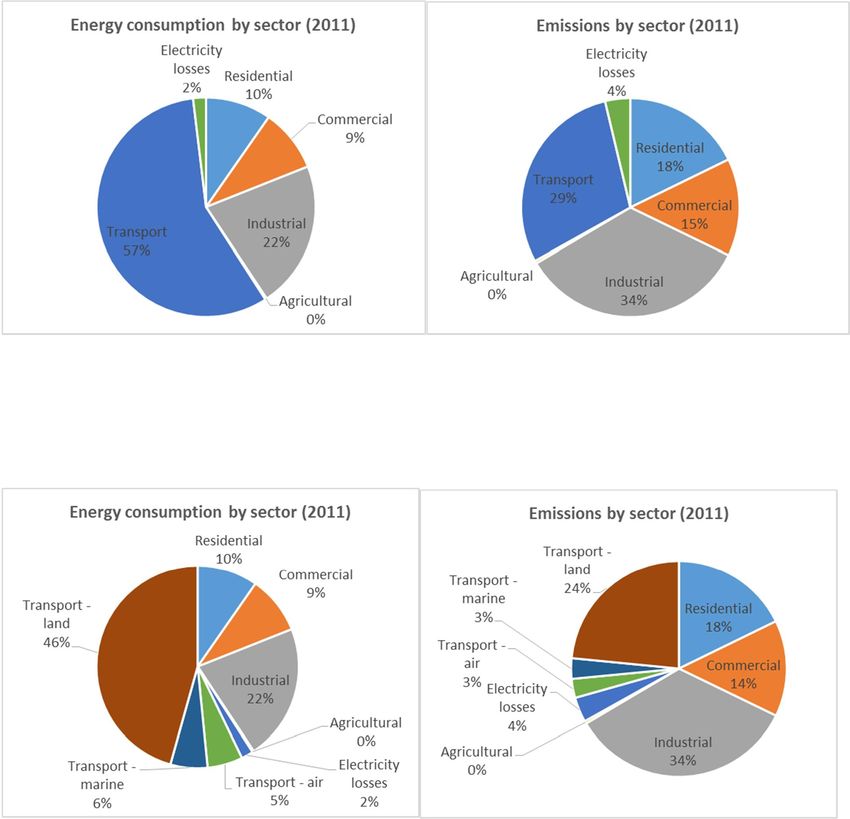
Figure 7: Energy consumption and emissions by sector.................................................................... 39
Figure 8: Energy consumption and emissions by sector with transport detail ................................. 39
Figure 9: Energy consumption and emissions by fuel ....................................................................... 40
Page 3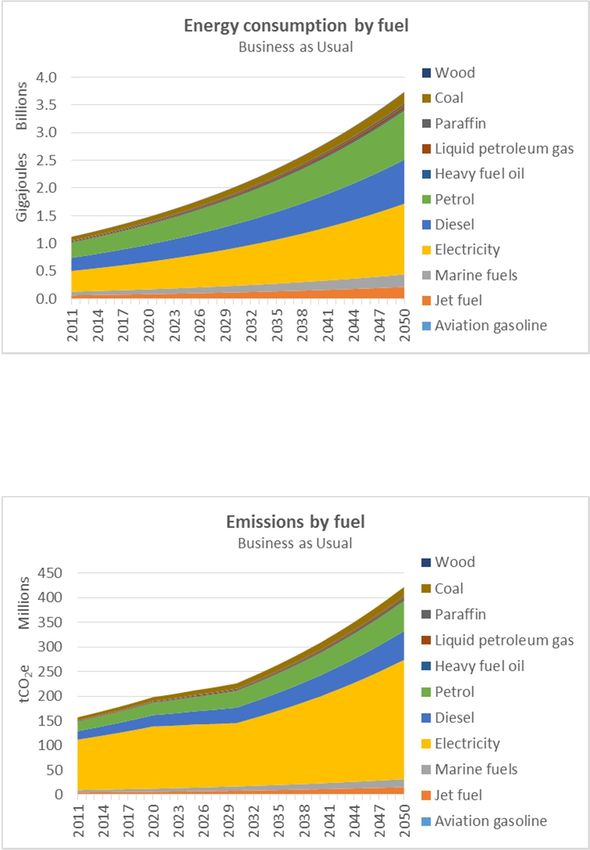
Figure 10: Energy consumption by all transport sub-sectors ............................................................ 40
Figure 11: Energy consumption by land-based transport (excludes aviation and marine)............... 41
Figure 12: Passenger-km and energy consumption by passenger transport mode .......................... 41
Figure 13: Passenger transport mode energy intensities .................................................................. 42
Figure 14: Household car ownership in study cities .......................................................................... 42
Figure 15: Household car ownership in study cities vs. national....................................................... 43
Figure 16: Petrol and diesel consumption of study cities (including metros) as a proportion of
national .............................................................................................................................................. 43
Figure 17: Energy consumption and household numbers of high- vs. low-income households....... 44
Figure 18: Energy consumption by end-use in different income bands ............................................ 44
Figure 19: Energy consumption by fuel type in industrial and commercial sectors ......................... 45
Figure 20: Energy consumption by end-use in industrial and commercial sectors ........................... 45
Figure 21: Energy consumption by sector in a Business as Usual scenario ....................................... 46
Figure 22: Emissions by sector in a Business as Usual scenario ........................................................ 46
Figure 23: Energy consumption by fuel in a Business as Usual scenario ........................................... 47
Figure 24: Emissions by fuel in a Business as Usual scenario ............................................................ 47
Figure 25: Electricity supply in a Business as Usual scenario............................................................. 48
Figure 26: Impact of high and low economic growth on a Business as Usual scenario .................... 48
Figure 27: Energy consumption by sector of ETE scenario vs. BAU scenario .................................... 50
Figure 28: Emissions by sector of ETE scenario vs. BAU scenario ..................................................... 51
Figure 29: Energy savings by sector of ETE scenario ......................................................................... 52
Figure 30: Emissions savings by sector of ETE scenario ..................................................................... 52
Figure 31: Energy savings through various transport interventions ................................................. 53
Figure 32: Energy consumption by the transport sector in ETE scenario vs. BAU scenario .............. 54
Figure 33: Energy consumption by the residential sector in ETE scenario vs. BAU scenario ............ 55
Figure 34: Impact of Weathering the Storm supply-side electricity mix on total (all energy-related)
costs ................................................................................................................................................... 56
Figure 35: Impact of Weathering the Storm supply-side electricity mix on emissions ..................... 57
Figure 36: Cleaner local electricity supply vs. BAU scenario ............................................................. 58
Figure 37: Impact of demand- and supply-side interventions on emissions ..................................... 59
Figure 38: Demand and supply-side emissions savings ..................................................................... 59
Figure 39: Impact of SSEG and local large-scale cleaner electricity generation on emissions .......... 60
Figure 40: Emissions reduction vs. Peak, Plateau, Decline trajectory ............................................... 60
Figure 41: Impact on costs of a carbon tax ........................................................................................ 61
Figure 42: Impact of peak oil on BAU and ETE scenarios .................................................................. 62
Figure 43: Additional costs of peak oil on BAU and ETE scenarios .................................................... 62

3. Tables
Table 1: Economy snapshot of study cities .......................................................................................... 7
Table 2: List of study cities with key indicators ................................................................................. 10
Table 3: Economic drivers .................................................................................................................. 14
Table 4: Household growth by dwelling type .................................................................................... 15
Table 5: Dwelling type classification .................................................................................................. 15
Table 6: Example of how liquid fuel trade category is used to assign sales to sectors ..................... 16
Table 7: Liquid fuel consumed by Acacia and Ankerlig ...................................................................... 16
Table 8: Break-down of fuel type by sector ....................................................................................... 16

                                                                                                                                                 Page 4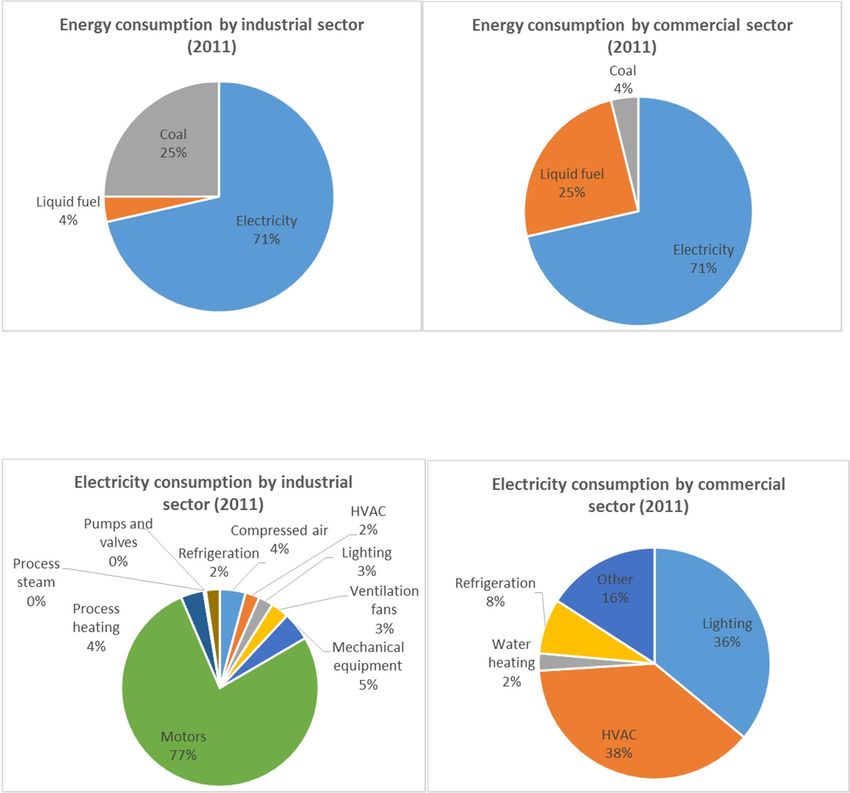
Table 9: Liquid fuel price over time in 2005 ZAR ............................................................................... 17
Table 10: Liquid fuel price (2011 ZAR) used in LEAP baseline ........................................................... 18
Table 11: Electricity supply power plant variables ............................................................................ 19
Table 12: Coal cost ............................................................................................................................. 19
Table 13: Wood cost .......................................................................................................................... 20
Table 14: Household income bands ................................................................................................... 21
Table 15: Household electrification status ........................................................................................ 21
Table 16: Main fuel used for lighting by income band ...................................................................... 22
Table 17: Main fuel used for cooking by income band...................................................................... 22
Table 18: Main fuel used for space heating by income band ............................................................ 22
Table 19: Main fuel used for water heating by dwelling type and electrification............................. 23
Table 20: Main fuel used for water heating by income and electrification status............................ 23
Table 21: Fridge ownership................................................................................................................ 23
Table 22: Household device costs used in LEAP ................................................................................ 24
Table 23: Electricity intensity by floor area for inefficient buildings ................................................. 24
Table 24: Electricity use by end-use in commercial buildings ........................................................... 25
Table 25: Electricity use by end-use in the industrial sector ............................................................. 25
Table 26: Electricity use by end-use in the agricultural sector .......................................................... 25
Table 27: Freight energy intensities................................................................................................... 26
Table 28: Main modes of transport for work and education (trips per 100,000 population, 2013). 26
Table 29: Passenger transport trip length assumptions .................................................................... 26
Table 30: Modal split of passenger transport .................................................................................... 27
Table 31: Split of diesel and petrol vehicles ...................................................................................... 27
Table 32: Passenger transport occupancy and energy intensity assumptions.................................. 27
Table 33: Vehicle costs per passenger-km ......................................................................................... 28
Table 34: Residential sector demand-side interventions .................................................................. 28
Table 35: Commercial sector demand-side interventions ................................................................. 31
Table 36: Industrial sector demand-side interventions ..................................................................... 31
Table 37: Industrial sector efficient technology savings potential compared to conventional
technology.......................................................................................................................................... 32
Table 38: Agricultural sector demand-side interventions ................................................................. 32
Table 39: Transport sector demand-side interventions .................................................................... 33
Table 40: Rooftop PV system capacity by sector ............................................................................... 34
Table 41: Rooftop solar PV penetration ............................................................................................ 34
Table 42: Electricity supply in scenario with demand-side efficiency interventions and local large-
scale renewable supply ...................................................................................................................... 35
Table 43: Electricity supply in scenario with demand-side efficiency interventions, local large-scale
renewable supply and rooftop PV ..................................................................................................... 35
Table 44: Supply mix in Weathering the Storm Scenario .................................................................. 36
Table 45: High and low economic growth rates in comparison to Business as Usual ....................... 48
Table 46: Summary of supply-side scenarios modelled .................................................................... 55

4. Introduction

4.1.       Background and Purpose

                                                                                                                                            Page 5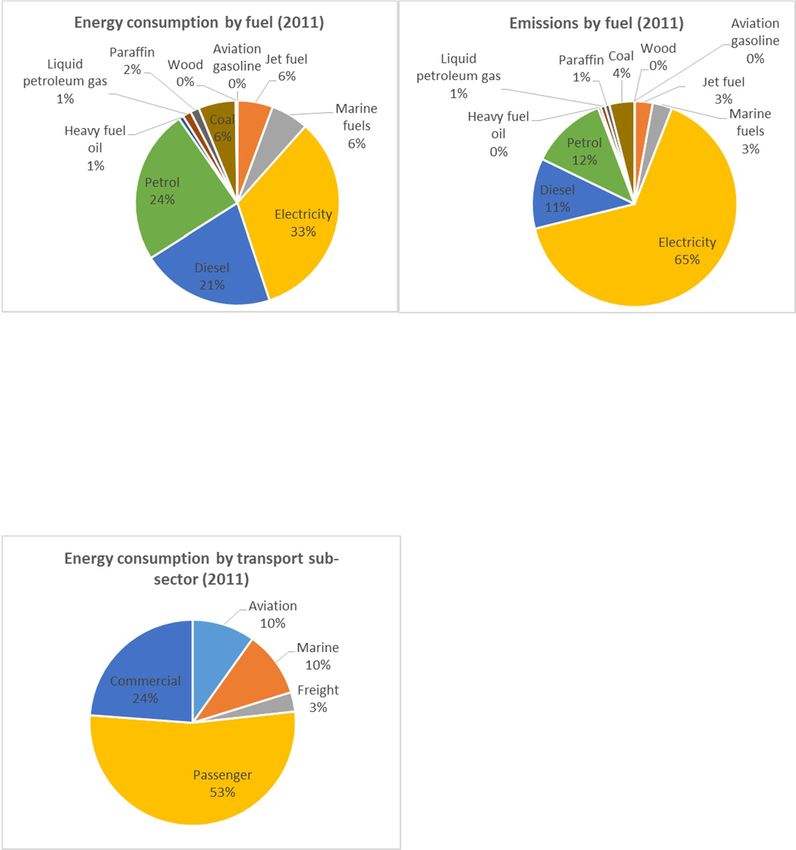
Urban centres are the areas where the majority of energy is consumed in South Africa,1 hence the
focus on these areas with regards to energy-related emissions mitigation potential.

Energy and emissions modelling of 27 urban South African municipalities was undertaken in order
to highlight the largest emissions sources and energy-consuming sectors, and to identify the
mitigation measures that would have the most impact with regards to reducing energy consumption
and emissions production.

This study forms part of a 4-year project, funded by the International Climate Initiative of the
German Federal Ministry for the Environment, Nature Conservation, Building and Nuclear Safety.
The relevant project goals are on-going support for low-carbon modelling, strategy development,
capacity building and implementation for municipalities.

4.2.       Study Scope

It is difficult to set an energy data-collection boundary for each city, therefore energy consumption
was collected at the municipal level. Emissions reported are emissions from energy consumption
only and do not include emissions from waste, land use change and other non-energy sources.

Energy-related data was already available for 18 municipalities through Sustainable Energy Africa's
(SEA's) State of Energy in South African Cities 2015 report. These 18 municipalities were included,
as well as any other municipality with an urban population over 150,000, as defined by the StatsSA
Census 2011.2 This came to a total of 27 municipalities, including the country's 8 metropolitan
municipalities.

Only two municipalities within the State of Energy in South African Cities report, which were
included in this study, had urban populations lower than 150,000: Saldanha at 96,000 and
Mbombela at 104,000.

4.3.       Overview of Municipalities

Most municipalities have an economy that is focused around community services and finance, but
there are a few exceptions, notably the municipalities where mining, electricity generation and/or
smelting processes take place, such as Emalahleni, Rustenburg, Steve Tshwete, Merafong,
Mathjabeng, etc (Figure 1). Table 1 provides a narrative snapshot of the economy of each
municipality.

1
    Source: State of Energy in South African Cities reports (2006, 2011, 2015)
2
    StatsSA assigns one of three geography types to each person: urban, rural or farm
                                                                                              Page 6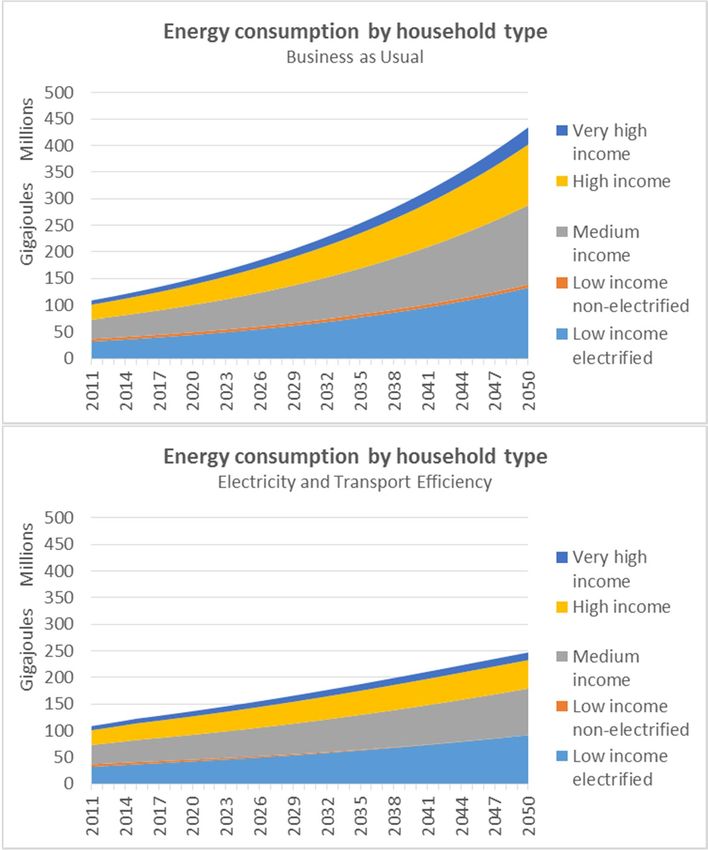
Economic breakdown of study cities (2011)
    100%
                                                                                              Community services
     80%                                                                                      Finance
     60%                                                                                      Transport
     40%                                                                                      Trade

     20%                                                                                      Construction
                                                                                              Electricity
      0%
                    City of Matlosana

                           Emalahleni

                               George

                Nelson Mandela Bay
                            Newcastle
                           Buffalo City

                            Mangaung
                          Matjhabeng

                        Merafong City
                   City of Cape Town

                            eThekwini

                          Mogale City

                                TOTAL
                      City of Tshwane

                            Ekurhuleni
                          Drakenstein

                         Govan Mbeki

                        The Msunduzi
                City of Johannesburg

                                                                                              Manufacturing

                          KwaDukuza
                             Emfuleni

             King Sabata Dalindyebo

                           Mbombela

                       Steve Tshwete
                           Polokwane
                          Rustenburg

                           Sol Plaatje
                        Saldanha Bay
                                                                                              Mining
                                                                                              Agriculture

Figure 1: GVA by sector for study cities3

Table 1: Economy snapshot of study cities
    Municipality      Municipal snapshot
                      Large vehicle assembly plant located next to port of East London, producing vehicles for
    Buffalo City      export.
    City of Cape      Finance sector dominates. Large tourism sector. Cape Town International Airport is the
    Town              second-busiest in South Africa (after O. R. Tambo).
    City of           One of world's leading financial centres. Heavy industries include steel and cement plants.
    Johannesburg      City Deep is world's largest "dry port."
                      One of the hubs of South African gold mining industry (importance decreasing recently).
    City of           Major contributor to agriculture (maize, sorghum, groundnuts, sunflower). Largest
    Matlosana         agricultural co-op in southern hemisphere.
                      Major commercial centre. Important industrial centre. Main industries are iron and steel
                      works, copper casting, and manufacturing of automobiles, railway carriages and heavy
    City of Tshwane   machinery.
    Drakenstein       Economy based on viticulture (wine) and tourism.
                      Contains O. R. Tambo Airport (Africa's busiest airport) and Rand Airport. One of South
                      Africa's industrial centres. Steel manufacture and distribution are the largest industries.
    Ekurhuleni        Large railway workshops, glassworks, engineering companies, gas distribution firms, etc.
                      Covers Witbank area. Industries include Evraz Highveld Steel and Vanadium (steel mill).
                      Eskom coal-fired power stations within borders include Kendal, Kriel, Duvha and Matla.
                      More than 22 collieries in area. Economy dominated by mining sector. Electricity sector
    Emalahleni        also prominent.
                      Covers Vereeniging area; an important industrial and manufacturing centre. Chief products
                      include iron, steel, pipes, bricks, tiles and processed lime. Contains several coal mines.
                      Other mines include fire-clay, silica and buildings stone. Main city is Vanderbijlpark, an
    Emfuleni          industrial city. 60% of town's workforce employed in factories.
                      Busiest container port in Africa. King Shaka International Airport is the 3rd busiest in South
                      Africa. Large tourism sector. Strong manufacturing, tourism, transportation, finance and
    eThekwini         government sectors.
                      Popular holiday and conference centre. Administrative and commercial hub of the Garden
    George            Route. Major airport: George Airport.
                      Contains coal to oil refinery (Sasol Two), 5 coal mines (part of largest underground coal
    Govan Mbeki       mining complex in SA). Economy dominated by manufacturing sector.

3
    Source: Global Insight data sourced from National Treasury
                                                                                                                   Page 7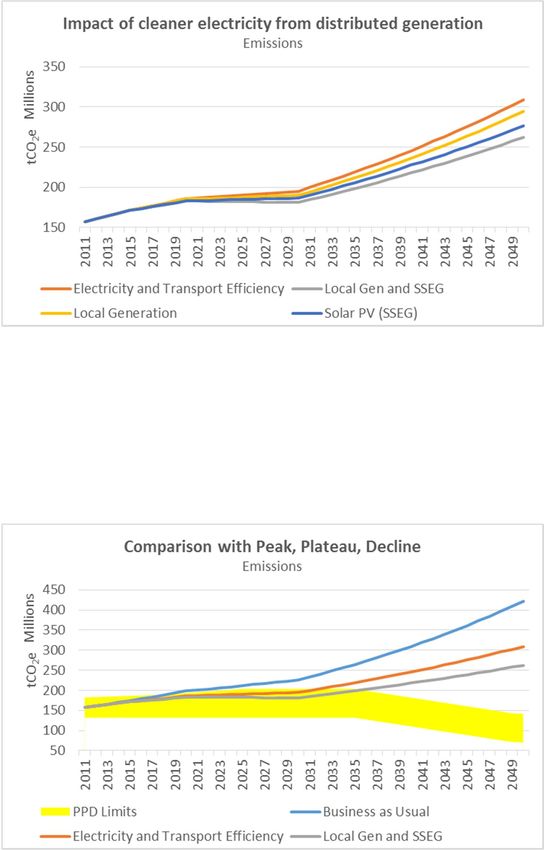
Municipality     Municipal snapshot
                 Contains Mthatha K. D. Matanzima Airport. Economy in decline since 1994 (professionals
King Sabata      moving to other areas). Economy dominated by community services - deduce that local
Dalindyebo       government is the largest employer/
                 Commercial, magisterial and railway centre of an important sugar-producing district.
KwaDukuza        Manufacturing sector dominates economy.
                 Much of economy based on canned fruit, glass products, furniture, plastics, and railway
                 engineering. Large economic growth in mid-20th century due to Free State goldfields
Mangaung         160km North-East of city.
                 Main town is Welkom; second-largest city in Free State. Economy centres on mining of gold
Matjhabeng       and uranium. Hub of Free State Goldfields. Significant coal reserves.
                 Main town is Nelspruit; the financial and banking capital of Mpumalanga. Strong retail
                 industry. One of largest manganese processing facilities in world. Key agricultural and
                 manufacturing hub for North-Eastern South Africa. Sugarcane. Large forestry sector,
                 including paper mill, saw mills, and manufacturing of furniture, crates and cartons. Situated
                 on Maputo Corridor - major trade route between Johannesburg and Mozambique.
                 Transport includes Buscor (largest bus operator - terminal one of largest in southern
                 hemisphere), 2 airports (Nelspruit Airfield and Kruger Mpumalanga International Airport).
Mbombela         Tourist stop-over.
                 Main town: Carletonville. Some of richest gold mines in world. One of world's deepest
Merafong City    mines. Economy dominated by mining sector.
                 Seat: Krugersdorp. Gold, manganese, iron, asbestos and lime mined in area. Transport: Jack
Mogale City      Taylor Airfield (airport). Tourism: Cradle of Humankind, Sterkfontein Caves, etc.
                 Major towns: Port Elizabeth, Uitenhage and Despatch. Major port. Vehicle assembly plants
                 and automotive companies: General Motors, Ford, Continental Tyres. Volkswagen: largest
                 car factory in Africa. Industries geared towards motor vehicle industry, e.g. catalytic
Nelson Mandela   converters, batteries, etc. Tourism. P. E. International Airport is 4th busiest in South Africa.
Bay              Harbours: Algoa Bay and Coega.
                 One of South Africa's main industrial centres. Economy dominated by Karbochem synthetic
                 rubber plant, Arcelor Mittal steelworks, LANXESS Chrome Chemical Plant, Natal Portland
                 Cement plant, clothing and textiles, and service and engineering industry. Considerable
Newcastle        coal mining in area.
                 Largest urban centre North of Gauteng. Polokwane International Airport. Agricultural
                 produce: tomatoes, citrus fruit, bananas, avocados. Hosts several major industries, e.g.
                 Coca-Cola and SAB. Large commercial area - 4 largest banks in the country all having at
                 least three branches in the city. Manufacturing facility in Seshego of Tempest Radios and
Polokwane        Hi-Fis - largest employer in region.
                 Two largest platinum mines in the world. World's largest platinum refinery. Economy
Rustenburg       dominated by mining sector.
                 Largest town: Vredenburg. Contains largest natural port in Africa, with iron ore quay.
Saldanha Bay     Saldanha Steel (steel mill). Grain, dairy, meat, honey and waterblommetjie farming.
                 Initial hub of industrialisation in South Africa in late 1800s - first town in Southern
                 hemisphere to install electric street lighting. Diamond mines (Kimberley hole). Major
Sol Plaatje      airport: Kimberley Airport. Services the mining and agricultural sectors of the region.
                 Seat: Middelburg - large farming and industrial town. Mining and manufacturing sectors
                 dominate. For year, industrial activities of the steel plant and its peripheral activities, such
                 as coal and transport, provided much of the employment and largely drove the economy,
                 although other sectors, such as agriculture, have gradually grown to be important. Out-
                 migration trend. Eskom coal-fired power stations within borders: Hendrina, Komati and
Steve Tshwete    Arnot.
                 Seat: Pietermaritzburg (KZN capital). Situated on N3 highway at junction of an industrial
                 corridor (Durban - Pietermaritzburg) and an agro-industrial corridor (Pietermaritzburg -
                 Estcourt). Regionally NB industrial hub, producing aluminium, timber and dairy products.
The Msunduzi     Pietermaritzburg (Oribi) Airport

                                                                                                               Page 8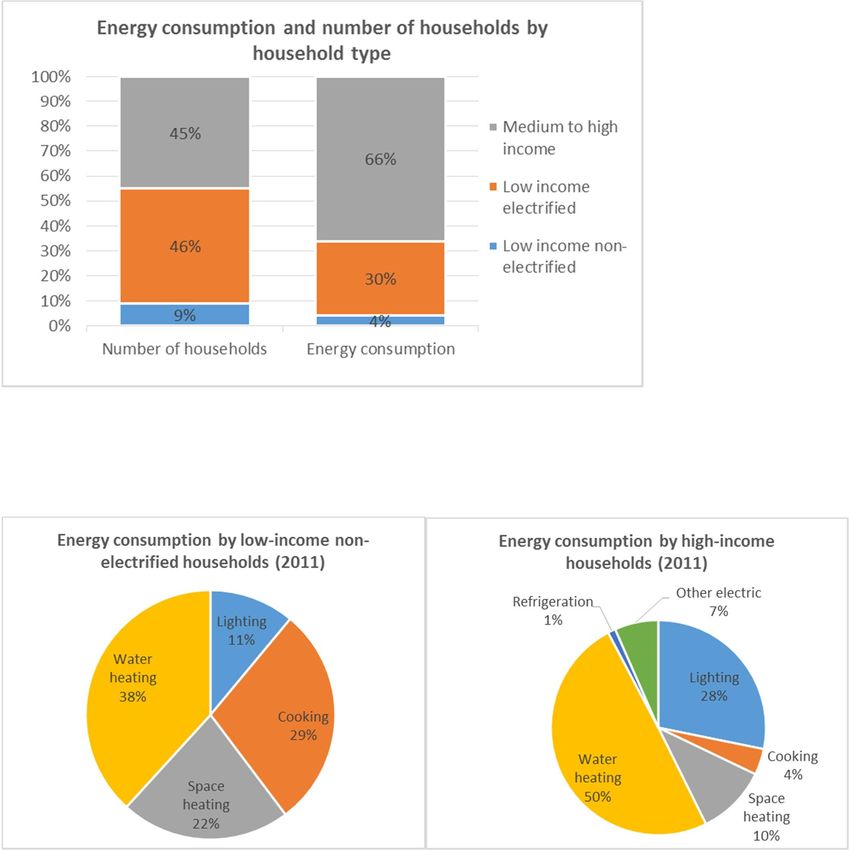
The 27 municipalities included in this study cover 5% of land area, but contains 23% of the country's
population and produces 76% of the country's GDP. They represent very intense nodes of economic
activity.

On average 90% of the population within these municipalities are urbanised, as opposed to the
national figure of 63%. Both population growth (2.2%) and GDP growth (3.7%) are higher within
these urban centres than the national growth rate (1.5% and 3.6% respectively).

The proportion of informal households (17%) is higher in the urban centres when compared to the
national proportion (14%), most likely as a result of people moving to urban centres to look for work
opportunities. Yet the growth rate of informal households in urban centres (0.6%) is slower than the
national growth rate (0.7%). Perhaps a reflection of accelerated housing delivery within these
centres.

                                                                                              Page 9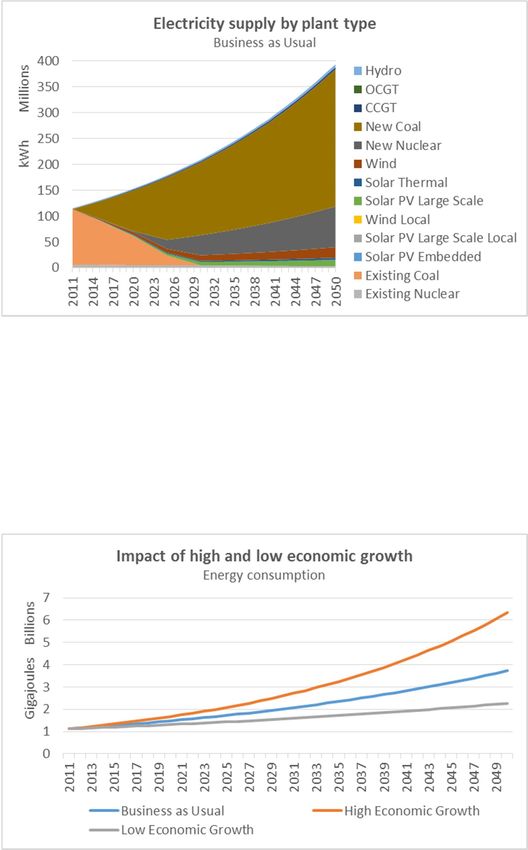
Table 2: List of study cities with key indicators4
                                                                                      Average annual                                Average annual                       Average
                                                                                      population        Urban        Informal       growth in informal    2011 GDP       annual GDP
                                                                         Population   growth (2001-     population   households     households (2001-     (millions      growth (2001-
    Province          Municipality             Type        Area (km2)    (2011)       2011)             (2011)       (2011)         2011)                 2005 ZAR)      2011)
    Eastern Cape      Buffalo City             Metro             2,536      755,200              0.7%          82%            22%                 -1.0%        34,723             4.1%
    Eastern Cape      Nelson Mandela Bay       Metro             1,959    1,152,115              1.4%          98%            12%                 -4.2%        61,749             2.9%
    Eastern Cape      King Sabata Dalindyebo   Non-metro         3,027      451,710              0.8%          35%             2%                 -6.4%          7,879            2.7%
    Free State        Mangaung                 Metro             6,284      747,431              1.5%          91%            14%                 -2.9%        28,660             2.4%
    Free State        Matjhabeng               Non-metro         5,155      406,461              0.0%          98%            20%                 -6.7%        13,071             0.8%
    Gauteng           City of Johannesburg     Metro             1,645    4,434,827              3.2%        100%             17%                  1.6%      316,508              4.0%
    Gauteng           City of Tshwane          Metro             6,298    2,921,488              3.2%          92%            18%                  1.6%      188,766              4.5%
    Gauteng           Ekurhuleni               Metro             1,975    3,178,470              2.5%          99%            21%                  0.2%      126,571              4.0%
    Gauteng           Emfuleni                 Non-metro           966      721,663              0.9%          99%            14%                  0.0%        20,468             3.8%
    Gauteng           Merafong City            Non-metro         1,631      197,520             -0.6%          96%            21%                 -2.0%          6,645           -1.8%
    Gauteng           Mogale City              Non-metro         1,342      362,422              2.1%          93%            25%                  2.0%        12,034             3.7%
    KwaZulu-Natal eThekwini                    Metro             2,291    3,442,361              1.1%          85%            16%                 -0.1%      203,231              3.9%
    KwaZulu-Natal KwaDukuza                    Non-metro           735      231,187              3.3%          83%            11%                 -1.6%          7,656            5.5%
    KwaZulu-Natal Newcastle                    Non-metro         1,855      363,236              0.9%          71%             5%                 -4.2%          8,346            3.0%
    KwaZulu-Natal The Msunduzi                 Non-metro           634      618,536              1.1%          75%             8%                 -1.9%        18,510             3.3%
    Limpopo           Polokwane                Non-metro         3,766      628,999              2.2%          41%             9%                 -1.9%        17,841             2.7%
    Mpumalanga        Emalahleni               Non-metro         2,678      395,466              3.6%          95%            19%                  1.7%        21,093             2.8%
    Mpumalanga        Govan Mbeki              Non-metro         2,955      294,538              2.9%          96%            28%                 -0.1%        25,480             3.5%
    Mpumalanga        Mbombela                 Non-metro         5,394      588,794              2.1%          18%             5%                 -2.4%        22,262             2.0%
    Mpumalanga        Steve Tshwete            Non-metro         3,976      229,831              4.9%          89%            14%                  4.6%        17,543             3.0%
    North West        City of Matlosana        Non-metro         3,561      398,676              1.0%          93%            16%                 -4.5%        10,588            -1.8%
    North West        Rustenburg               Non-metro         3,423      549,575              3.6%          68%            30%                  2.6%        35,756             4.4%
    Northern Cape Sol Plaatje                  Non-metro         3,145      248,041              2.1%          99%            17%                  2.0%        12,102             1.9%
    Western Cape City of Cape Town             Metro             2,445    3,740,026              2.6%        100%             20%                  4.3%      213,327              4.0%
    Western Cape Drakenstein                   Non-metro         1,538      251,262              2.6%          85%            13%                  1.2%          8,744            3.7%
    Western Cape George                        Non-metro         5,191      193,672              2.6%          89%            14%                  2.7%          6,464            5.0%
    Western Cape Saldanha Bay                  Non-metro         2,015       99,193              3.5%          97%            17%                  6.6%          4,282            3.7%
    Study cities summary                                       58,422    11,922,751              2.2%          90%            17%                  0.6%    1,450,300              3.7%
    Study cities (percentage of national)                           5%          23%               N/A          N/A            N/A                   N/A           76%              N/A
    National                                                1,221,037    51,770,561              1.5%          63%            14%                  0.7%    1,905,735              3.6%

4
    Sources: StatsSA, Global Insight
                                                                                                                                                                              Page 10
Page 11
5. Methodology
5.1. Overview
A detailed energy data collection exercise was undertaken; building on previous work carried out
on the State of Energy in South African Cities 2015 report. The first step in any energy modelling
process is to develop a baseline of current energy use patterns. This information forms the
foundation of all the modelling outputs that follow, and as such it is critical for it to be as accurate
and meaningful as possible. Data was collected for the following sectors:
Residential
Commercial (includes government)
Industrial
Agricultural
Transport
The Long-Range Energy Alternatives Planning (LEAP) simulation tool was used to examine the
implications of a number of possible future energy scenarios from the base year of 2011 up to 2050.
Each scenario contained a combination of specific energy efficiency interventions and supply mix
options. The following primary scenarios were modelled:
Business As Usual (BAU) Scenario: No changes in current energy demand trends and the
implementation of national electricity plans drawing on the IRP 2010 Policy-Adjusted
Scenario.
Electricity and Transport Efficiency Scenario (ETE): Includes a combination of all electricity
and transport efficiency interventions/scenarios, as well as household energy access
considerations.
Supply-side scenarios modelled:
City Local Generation Policy Scenario (GEN): This builds a local renewable generation
component on to the ETE scenario. Total renewable energy supply is 16% by 2050 (rather
than the baseline 9%).
Embedded Solar PV Scenario (SOL): ETE with embedded solar PV in 70% of high and very
high income households by 2050, and supplying 20% of electricity needs in the commercial,
agricultural and industrial sectors by 2050.
Local Generation and Embedded Solar PV Scenario (GSOL): Combines the interventions
contained in GEN and SOL scenario, i.e. local large-scale renewable electricity generation, as
well as rooftop PV roll-out.
Weathering the Storm (WTS): Based on BAU, but with electricity supply according to IRP
2010 (2013 Update) Weathering the Storm Scenario.5
5
Discussion with national electricity planning experts indicated that the cabinet approved IRP 2010-2030 is ‘unlikely’
given the inability of Eskom or international players to fund the nuclear build contained in this iteration of the plan.
Page 12Other scenarios were modelled based on a combination of the primary and supply-side scenarios
listed above:
Peak Oil Scenarios: modelled by an annual increase in liquid fuel prices 5% above the current
real price increase
Carbon Tax Scenarios: a carbon tax of R40/tonne in 2015 increasing to R47/tonne in 2019
and R117/tonne in 20256
Economic Growth Scenarios: high and low growth rates
5.2. Data Problems and Limitations
Electricity
Electricity is distributed either directly by Eskom or by the City who buys electricity from Eskom.
Eskom electricity distribution data is not publicly available and required the signing of a non-
disclosure agreement. This can be a lengthy process.
Electricity sales are recorded by tariff, not by sector. There is not always a one-on-one match
between a tariff and a sector, e.g. a Large Power User tariff could cover both industrial customers
and large commercial customers such as shopping malls, and a Small Power User tariff could cover
commercial customers and residential complexes.
Coal
Unlike liquid fuel data, coal data is deregulated. There is no one data repository for local-level coal
data. Coal data (where available) was obtained from municipal air quality departments, large
industry annual reports, and direct communication with large coal suppliers.
Liquid fuel
Liquid fuel sales data by fuel type by magisterial district is publicly available on DoE’s website. This
dataset gives no indication as to the sector where the fuel is being consumed. Data of sales by trade
category was obtained for the Western Cape and Gauteng areas. Splits of sales by trade categories
for all the study cities that fall within these provinces was used as a proxy for the split of sales by
trade category for all the study cities. The trade categories assisted in the allocation of fuel to sector
by some degree (e.g. “commercial” category sales were assigned to the commercial sector), but
there were some trade categories that were not descriptive (e.g. “retail – garages” and “general
trade”).
Magisterial districts do not align with municipal boundaries. Magisterial fuel sales were assigned to
municipal area according to the percentage geographical overlap of the areas.
Planners pointed to the ‘weathering the storm’ scenario of the IRP 2010-2030 Update Report as the most likely
electricity build plan to take place.
6
Parameters used in IRP 2010 (2013 update)
Page 13In the DoE dataset received, marine fuels were supplied as one fuel type, but in actual fact it is made
up of three fuel types: HFO, diesel and oil (potentially used as a lubricant and not a fuel at all). There
was no way to disaggregate this data.
Energy use by end-use and sub-sector
Energy use by end-use (HVAC, lighting, etc.) and by sub-sector is particularly difficult to obtain,
although data has improved over time. There are locally-specific studies available that focus on the
commercial sector’s energy use by end-use with regards to electricity, but data is sparse when it
comes to liquid fuel and any data on energy use by end-use in the industrial sector.
In the case of household energy use by end-use, data is available from StatsSA on the type of fuel
used as the main fuel for lighting, space heating, and cooking, but not on the amount of fuel used.
Energy use by end-use data was based on a study undertaken on households energy use in
Polokwane.
5.3. Key Inputs and Drivers
Conversion Factors
The default LEAP conversion factors were used. These are based on the most recent climate change
assessment of the Intergovernmental Panel on Climate Change (IPCC, AR5 2013).
The list of effects includes all gases listed in the most recent climate change assessment of the
Intergovernmental Panel on Climate Change (IPCC, AR5 2013). Effects are divided into categories
including major greenhouse gases (GHGs) , local air pollutants, other effects (such as solid waste,
water effluents, injuries, deaths, land degradation, etc.) and major groups of chemicals such as
halogenated alcohols, ethers, hydrofluorocarbon, chlorocarbons, hydrochlorocarbons,
bromocarbons, hydrobromocarbons and halons, etc.
GVA
Global Insight GVA data by sector by municipality from 1996-2013 was obtained from Treasury. The
GVA data from the study municipalities was summed to represent an average economic picture
across all study municipalities. Regression analysis was undertaken on the data to obtain average
growth rates within each sector over time. The GVA data finance sector was assigned to LEAP sectors
as shown in the table below. In South Africa, the number of registered vehicles has tracked GDP
more closely than population. 7 Hence total GDP growth was used as a driver in the passenger
transport sector.
Table 3: Economic drivers
Finance sector LEAP sector Growth
Agriculture Agricultural 1.53%
Manufacturing Industrial 2.83%
7
"Quantifying the energy needs of the transport sector for South Africa: A bottom-up model" by Bruno Merven, Adrian
Stone, Alison Hughes and Brett Cohen from ERC, Jun 2012.
Page 14Trade, Finance and Commercial and institutional 3.36%
Community Services
Transport Transport (non-passenger) 3.19%
Total GDP Transport (passenger) 3.07%
Households
Households were divided into 4 income bands and classified as either electrified or non-electrified
(see 5.6. Residential Sector chapter for more detail).
Growth by income band could not be used easily, because StatsSA's income band data does not
adjust according to inflation. Therefore growth by dwelling type was used instead. Households were
broken down into two types: (1) informal (StatsSA categories: informal dwelling in backyard and
informal dwelling not in backyard, e.g. in an informal/squatter settlement or on a farm) and (2)
other (all other categories, e.g. flat, townhouse, semi-detached, house on separate stand/yard, etc.)
(Table 5). The growth in the number of informal households was applied to low-income non-
electrified households (it was assumed that all non-electrified low-income households would be
informal) and the growth in the number of other households was used for all other household
income bands.
Table 4: Household growth by dwelling type
Average annual
Households 2001 2011 growth (2001-2011)
Informal 1,353,076 1,436,735 0.60%
Other 4,742,812 6,811,741 3.69%
Total 6,095,888 8,248,476 3.07%
Table 5: Dwelling type classification
StatsSA category LEAP category
Informal dwelling (shack; in backyard) Informal
Informal dwelling (shack; not in backyard; e.g. in an informal/squatter settlement or on a Informal
farm)
House or brick/concrete block structure on a separate stand or yard or on a farm Other
Flat or apartment in a block of flats Other
Cluster house in complex Other
Townhouse (semi-detached house in a complex) Other
Semi-detached house Other
House/flat/room in backyard Other
Room/flatlet on a property or larger dwelling/servants quarters/granny flat Other
Traditional dwelling/hut/structure made of traditional materials Other
Caravan/tent Other
Other Other
5.4. Energy Supply
Liquid fuel
Liquid fuel sales by magisterial district by fuel type were obtained from the national Department of
Energy (DoE) for the 2011 calendar year. Sales were assigned to municipal area by considering
geographic area overlap between magisterial district and municipal area.
Page 15Sales by trade category data, which allows for the allocation of liquid fuel to sectors, were available
for the magisterial districts that fell within Western Cape and Gauteng. 10 of 27 study cities fell
within these two provinces, i.e. Cape Town, Johannesburg, Tshwane, Drakenstein, Ekurhuleni,
Emfuleni, George, Merafong, Mogale, Saldanha Bay. It was assumed that the liquid fuel sales split
by sector within these 10 municipalities was representative of the split of sales by sector across all
27 municipalities. An example of how diesel sales were assigned to a sector in LEAP, using DoE trade
categories, is provided below.
Table 6: Example of how liquid fuel trade category is used to assign sales to sectors
DoE trade category LEAP sector/sub-sector
Agricultural Co-ops Transport/Agricultural
Commercial Transport/Commercial
Consolidated diamond mines Transport/Industrial
Construction Transport/Industrial
Farmers Transport/Agricultural
General dealers Transport/Passenger
Government Transport/Government
Transport/Local
Local authorities Government
Local marine fishing Transport/Local Marine
Mining Transport/Industrial
Public Transport (local Authority) Transport/Passenger
Public Transport (non local Authority) Transport/Passenger
Remainder of general trade Transport/Passenger
Retail - garages Transport/Passenger
Road Haulage Transport/Freight
Transnet Transport/Freight
Undefined (legacy data) Transport/Passenger
Where there was uncertainty, sales were allocated to the passenger transport sector. Government
sales were included in the commercial sector. Acacia (jet fuel) and Ankerlig (diesel) fuel consumption
was subtracted to avoid double-counting, i.e. counting the liquid fuel used by these power plants
(both based within the boundaries of one of the study cities - City of Cape Town) as well as the
electricity generated by these power plants amounts to double-counting.
Table 7: Liquid fuel consumed by Acacia and Ankerlig8
Power Station Litres (2011)
Acacia (jet fuel) 2,694,100
Ankerlig (diesel) 267,322,211
A breakdown of liquid fuel consumption by sector, based on the liquid fuel sales by trade category
data for the Western Cape and Gauteng study cities is provided below.
Table 8: Break-down of fuel type by sector
Product Name LEAP sector %
Jet Fuel Transport/Aviation 100.0%
Aviation Gasoline Transport/Aviation 100.0%
Transport/Agricultural 4.4%
Transport/Commercial 13.8%
Diesel
Transport/Freight 8.1%
Transport/Industrial 3.5%
8
Source: "Cape Town State of Energy 2015" by Sustainable Energy Africa
Page 16Product Name LEAP sector %
Transport/Local Marine 0.9%
Transport/Passenger 69.4%
Agricultural 0.4%
Commercial 6.8%
Freight 0.8%
Furnace Oil
Industrial 0.1%
Local marine 16.1%
Other 75.8%
International Marine Fuels Transport/International Marine 100.0%
Commercial 28.0%
LPG Industrial 0.0%
Other 72.0%
Agricultural 2.4%
Commercial 7.2%
Freight 0.0%
Paraffin
Industrial 5.6%
Local Marine 0.0%
Other 84.7%
Transport/Agricultural 0.6%
Transport/Commercial 0.5%
Transport/Freight 0.1%
Petrol
Transport/Industrial 0.0%
Transport/Local Marine 0.0%
Transport/Passenger 98.8%
Freight liquid fuel consumption may seem low. A low figure was obtained in a similar exercise for
the City Cape Town, but was cross-checked with the local freight industry and was found to be within
the same ball-park. It must be noted, though, that this exercise only accounts for liquid fuel sold
within the study cities, not fuel used by freight vehicles on their entire route (which may fall within
the boundaries of cities outside the scope of this study).
Cost
Liquid fuel prices were obtained from DoE and CPI from StatsSA. This data was used to calculate real
liquid fuel price increases over time.
Table 9: Liquid fuel price over time in 2005 ZAR9
c/lit (real 2005 ZAR)
Year Petrol Diesel LPG Paraffin
2001 442.43 N/A N/A 288.10
2002 438.55 N/A N/A 288.60
2003 404.07 N/A N/A 248.67
2004 449.34 N/A N/A 285.53
2005 513.17 N/A N/A 365.02
2006 575.52 548.44 N/A 418.73
2007 592.20 554.25 N/A 425.67
2008 709.85 744.10 N/A 596.81
2009 543.29 495.77 N/A 351.74
2010 581.11 528.78 1,216.48 372.64
2011 669.49 630.93 1,333.96 466.88
9
Source of liquid fuel prices: DoE (http://www.energy.gov.za/files/energyStats_frame.html). Source of CPI: StatsSA.
Page 172012 733.89 692.95 1,377.18 513.75
2013 774.54 730.76 1,393.24 548.43
Average
incr. p.a. 4.8% 4.2% 4.6% 5.5%
Table 10: Liquid fuel price (2011 ZAR) used in LEAP baseline
2011 ZAR R/lit
Petrol 9.78
Diesel 9.22
LPG 10.52
Paraffin 6.82
HFO10 5.53
Jet fuel11 6.69
Aviation gasoline12 18.00
Electricity
Electricity sales by sector was obtained from the State of Energy in SA Cities 2015 report (which
contained 2011 or 2012 data), greenhouse gas inventories' raw datasets (in the case of eThekwini)
and the Western Cape Government's Energy and Emissions Database. This data within these reports
were originally sourced directly from municipalities, Eskom and NERSA.
Where there were gaps in Eskom data, data was drawn from raw data behind the NERSA
consultation paper on the cost of unserved electricity.13
Not enough data was available on local government energy use. This sector was therefore included
within the commercial sector. Within metros, local government's electricity demand usually
amounts to 3% of the total electricity demand within the municipal area and 1% of total energy
demand.
Cost
Eskom tariffs to direct customers in urban areas were used as a proxy for electricity tariffs
elsewhere.
Eskom Block 4 of HomePower Standard tariffs was used for residential mid- to very high-
income customers
Eskom Block 1 HomeLight was used for low-income residential customers
An average of the business rate tariffs were used for the commercial sector
An average of the Night Save tariffs were used for the industrial sector
Plant details
10
It was assumed that HFO is approximately 40% cheaper than diesel. Source: http://www.ee.co.za/article/heavy-fuel-
oil-cuts-costs-of-own-generation.html.
11
Source: www.pmg.org.za/files/questions/RNW178A-130312.doc
12
Source: http://www.bdlive.co.za/business/transport/2013/04/18/government-policies-choking-aviation-industry--
iata
13
Source: http://www.nersa.org.za/ContentPage.aspx?PageId=558&PageName=Electricity
Page 18Electricity power plant data was drawn from the ERC's SNAPP tool (2.0 IRP 2010 base and policy-
adjusted).
Table 11: Electricity supply power plant variables
Capital cost Capital cost Fixed Variable
overnight (2010) PV (2010) O&M O&M Efficiency Availability Lifetime
Plant Description R/kW R/kW R/kW R/MWh fraction fraction years
Existing coal Large 7,065 7,065 199 8 35% 80% 50
OCGT liquid fuels 3,955 4,051 22 22 30% 93% 30
PWR nuclear 37,205 47,451 365 99 33% 84% 60
Hydro 0 0 130 0 100% 15% 50
Supercritical coal 17,785 20,323 8 8 37% 86% 30
Wind 29% availability 14,445 14,796 266 0 100% 29% 20
Solar CSP 50,910 54,150 635 0 100% 44% 30
Solar PV 20,805 20,805 474 0 100% 19% 25
CCGT 5,780 6,233 148 0 48% 90% 30
Hydro imported new 15,518 19,883 344 0 100% 70% 60
Pumped storage 7,913 10,771 154 26 73% 28% 50
Notes:
Fixed O&M includes fuel cost
The availability of "existing coal large" was dropped from 87.1% to 80%14
2010 ZAR close enough to 2011 ZAR, therefore these costs are used.
Rooftop PV
Rooftop PV costs were based on calls to companies within Cape Town and adjusted to 2011 values
using CPI and the ERC's SNAPP tool's learning rates15
Coal
Coal use in the residential sector was derived by assigning the use of 10kg/month/household for
households using coal for either space heating or cooking as indicated by the StatsSA 2011 Census.
Industrial and commercial coal use was obtained from the State of Energy in SA Cities 2015.
Cost
Table 12: Coal cost16
Coal costs R/GJ
Eskom 9.95
Other 29.01
Wood
14
Source of new figure: IRP 2013 Update - assumption used in IRP Base Case scenario
15
Communications with Andrew Janisch, ERM, City of Cape Town
16
"Stable local coal market" by Charlotte Mathews, 05 June 2014, 06:41
(http://www.financialmail.co.za/moneyinvesting/2014/06/05/stable-local-coal-market) and exchange rate from
http://www.x-rates.com/average/?from=USD&to=ZAR&amount=1&year=2011
Page 19Wood is largely used by the residential sector. Its use is calculated through a bottom-up approach,
using energy intensities obtained from a study on household energy use in Polokwane study (see
the 5.6. Residential Sector chapter).
Cost
Table 13: Wood cost17
Fuel R kg R/kg R/GJ
Wattle 40 50 0.80 0.014
Sekelbos 24 7 3.43 0.058
Kindling 14 7 2.00 0.034
A 0.05 R/GJ cost was assumed in LEAP.
5.5. Calculating Electricity Supply for LEAP
Due to the nature of the electricity supply in South Africa, it is challenging to model electricity supply
at the municipal level for each of the future energy scenarios. In South Africa, electricity is currently
supplied by a single national operator (Eskom). The electricity consumed in municipalities is drawn
directly from the national grid. It was decided to use the electricity demand of the study cities to
determine the amount of capacity (supply) required to meet that demand now and into the future.
Unfortunately, because LEAP does not have iterative functions, this meant that some calculations
needed to be done outside of the LEAP model, with the results being fed back into LEAP before the
final calculations could be undertaken. The iteration is thus manual rather than automatic. A
Microsoft Excel spreadsheet ‘Elec supply tool for Cities Mitigation 2011.1.xls’18 (referred to as the
Supply Tool from here onwards) was used for the external calculations.
The LEAP user must first complete the demand side ‘current account’ (i.e. the 2011 electricity
demand side picture for Cape Town) as well as all of the demand-side scenarios (e.g. Business As
Usual, etc.) before undertaking any supply-side calculations. If any changes are made to the
demand-side figures that would alter the total amount of electricity demand in any of the scenarios,
the supply-side figures would need to be recalculated.
Once the total electricity demand for each scenario had been calculated in LEAP, these figures were
used to calculate the required capacity to meet the demand. The capacity figures were calculated
using the Supply Tool and entering the total annual electricity demand figures for the years (2011,
2015, 2020, 2025, 2030, 2040 and 2050) in the ‘demand’ tab of the Supply Tool. The Supply Tool
used the reserve margin (leave the default value of 15%, unless this has also been changed in the
LEAP model) to calculate the total required capacity needed to meet the demand while still retaining
the specified reserve margin. This was calculated by dividing the total annual electricity demand (in
MWh) by the number of hours in a year and multiplying this figure by the reserve margin plus one,
i.e.
Capacity (MW) = demand (MWh) / hours in the year (365*24) x reserve margin plus one (1.15)
17
Source of wattle cost: http://www.wattlewood.co.za/firewood-prices-and-wattle-product-prices.html. Source of
Sekelbos/kindling cost: http://www.firelogs.co.za/products.html. No weight given for Sekelbos bag. Assume 7 kg.
18
This spreadsheet can be obtained from Sustainable Energy Africa. Contact: info@sustainable.org.za.
Page 20It must be noted that LEAP is able to calculate the Peak Power Requirements (excluding reserve
margin) in the same way as with the Supply Tool, but it was reasoned that it would be more intuitive
for the user to calculate the required capacity from the actual electricity demand.
The supply mix to be modelled in LEAP for each of the scenarios was entered on the ‘Supply’ tab.
The Supply Tool used this data to produce the required ‘interp’ equations for insertion into LEAP.
The equations were inserted into the 'Exogenous Capacity' field in LEAP for the relevant supply
technology.
The ‘interp’ equations were copied into the correct scenarios in LEAP. Once all the exogenous
capacities for each supply technology were entered into each scenario in LEAP, the model was run
again to calculate the supply costs.
By default, LEAP does not have a way of using the supply costs to influence the cost of electricity
(i.e. an iterative function). In this project, it was desired for the costs of various supply scenarios to
be reflected in the cost of electricity. Once the supply figures were entered for all scenarios and the
model was run successfully, the costs associated with each supply type were used to alter the
electricity tariff, using the ‘Supply Costs’ tab in the Supply Tool. Total supply costs for each year were
entered into the relevant field of the Supply Tool. The Supply Tool provided a growth equation,
which was copied into LEAP’s Key Assumption ‘Cost Elec Incr’ function. Each scenario would have a
slightly different tariff factor equation if the supply mixes are different.
Finally, once the tariff factor for each scenario was entered into LEAP, the model was run for the
last time. The results of this run presented the final demand, the final supply and all associated
costs.
5.6. Residential Sector
Income
Households were assigned to income bands, as follows:
Table 14: Household income bands
Monthly household income Lower limit Upper limit
Low-income No income R 3,200
Mid-income R 3,201 R 12,800
High-income R 12,801 R 51,200
Very high income R 51,201 None
Electrification rate was determined using StatsSA's "electricity as main fuel for lighting," as a proxy
for electrification.
Table 15: Household electrification status19
Households (2011) No.
Low-income electrified 3,734,608
Low-income non-electrified 733,518
Mid-income electrified 1,947,771
Mid-income non-electrified 98,696
19
Source: StatsSA Census 2011
Page 21High-income 1,285,725
Very high-income 336,186
The total number of households represents the sum of all households across the 27 study cities.
Lighting
Table 16: Main fuel used for lighting by income band20
Main fuel used for lighting Low (non- Mid (non-
(2011) Low (elec) elec) Mid (elec) elec) High Very high
Electricity 83% N/A 94% N/A 99% 99%
Gas 0% 2% 0% 3% 0% 0%
Paraffin 5% 28% 2% 27% 0% 0%
Candles 12% 67% 4% 64% 1% 0%
Solar 0% 1% 0% 4% 0% 0%
None 0% 2% 0% 3% 0% 0%
Total 100% 100% 100% 100% 100% 100%
Within LEAP, it was assumed that all high and very high income households are electrified.
Cooking
Table 17: Main fuel used for cooking by income band 21
Main fuel used for cooking Low (non- Mid (non-
(2011) Low (elec) elec) Mid (elec) elec) High Very high
Electricity 95% N/A 90% N/A 93% 86%
Gas 2% 7% 3% 13% 6% 13%
Paraffin 2% 81% 5% 78% 1% 0%
Wood 1% 9% 1% 5% 0% 0%
Coal 0% 2% 0% 2% 0% 0%
Solar 0% 0% 0% 0% 0% 0%
None 0% 1% 0% 1% 0% 0%
Total 100% 100% 100% 100% 100% 100%
The use of animal dung and "other" was excluded, as their use was negligible. The use of electricity
for cooking was excluded as an option if that households did not use electricity for lighting (which
was used as a proxy for electrification).
Space heating
Table 18: Main fuel used for space heating by income band 22
Main fuel used for space Low (non- Mid (non-
heating (2011) Low (elec) elec) Mid (elec) elec) High Very high
Electricity 75% N/A 81% N/A 83% 79%
Gas 1% 5% 2% 5% 7% 12%
Paraffin 7% 41% 5% 41% 2% 1%
Wood 2% 16% 1% 16% 2% 3%
Coal 1% 10% 1% 10% 1% 1%
Solar 0% 1% 0% 1% 0% 1%
20
StatsSA Census 2011
21
StatsSA Census 2011
22
StatsSA Census 2011
Page 22You can also read