Energy storage solutions for electric bus fast charging stations - Cost optimization of grid connection and grid reinforcements Malin Andersson ...
←
→
Page content transcription
If your browser does not render page correctly, please read the page content below

Examensarbete 30 hp

Energy storage solutions for
electric bus fast charging stations

Cost optimization of grid connection and
grid reinforcements

Malin Andersson
Abstract
                                      Energy storage solutions for electric bus fast charging
                                      stations
                                      Malin Andersson

Teknisk- naturvetenskaplig fakultet
UTH-enheten                           This study investigates the economic benefits of installing a
                                      lithium-ion battery storage (lithium iron phosphate, LFP and lithium
Besöksadress:                         titanate, LTO) at an electric bus fast charging station. It is
Ångströmlaboratoriet
Lägerhyddsvägen 1                     conducted on a potential electric bus system in the Swedish city
Hus 4, Plan 0                         Västerås, and based on the existing bus schedules and routes as well
                                      as the local distribution system. The size of the energy storage as
Postadress:                           well as the maximum power outtake from the grid is optimized in order
Box 536
751 21 Uppsala                        to minimize the total annual cost of the connection. The assessment
                                      of the distribution system shows that implementing an electric bus
Telefon:                              system based on opportunity charging in Västerås does not cause over-
018 – 471 30 03                       capacity in the 10 kV grid during normal feeding mode. However, grid
Telefax:                              reinforcement might become necessary to guarantee potential backup
018 – 471 30 00                       feeding modes. Batteries are not a cost effective option to decrease
                                      grid owner investments in new transformers. However, battery energy
Hemsida:                              storage have the possibility to decrease the annual cost of
http://www.teknat.uu.se/student
                                      connecting a fast charging station to the low-voltage grid. The main
                                      advantage of the storage system is to decrease the fees to the grid
                                      owner. Of the studied batteries, LTO is the most cost effective
                                      solution because of its larger possible depth-of-discharge for a
                                      given cycle life. The most important characteristics, that determine
                                      if a fast charging station could benefit economically from an energy
                                      storage, is the bus frequency. The longer the time in between buses
                                      and the higher the power demand, the more advantageous is the energy
                                      storage.

                                      Handledare: Kenny Granath
                                      Ämnesgranskare: Juan de Santiago
                                      Examinator: Petra Jönsson
                                      ISSN: 1650-8300, UPTEC ES 17 002
Executive summary
In Västerås, the possibility to implement electric buses is investigated. The system that is considered is
based on high power battery chargers at the end stations. This type of charging would cause a high load
on the distribution system and potentially demand expensive reinforcements. In addition, the grid connec-
tion constitute a high cost for the charigng station owner. In the investigation, the economic benefits of
connecting a lithium-ion battery (lithium titanate, LTO and lithium iron phosphate, LFP) to these charging
stations are investigated.

    The assessment of Mälarenergi’s distribution grid shows that there is enough available capacity in the
10 kV-grid during normal feeding to support the potential electric bus system. However, the transformer
substations that are located close to the bus end stations Bjurhovda, Björnögården, Hälla and Hacksta lacks
the capacity to connect the fast charging station in question. The study shows that the most cost effective
solution would be to invest in a new transformer substation instead of decreasing the power demand by the
use of an energy storage system.

    For the charging station owner, the most cost effective solution in all studied cases would be to become
high-voltage customers because of the lower fees. Considering a high-voltage connection, lithium-ion
batteries of today’s price can not decrease the annual cost of connection. However, at some stations an
LTO battery storage can be used to decrease the annual costs of a low-voltage connection, mainly by
decreasing the fees. The characteristics of such a station are a low bus frequency and high power demand
(Hälla is one example).

   The LTO battery is superior to the LFP battery because it can discharge to a deeper level for the same
cycle life. The lifetime is the main limiting factor for the battery storage since it is approximately 8 years
whereas an grid investment would last for 40 years. The price of the LTO battery is assumed to be 8500
SEK/kWh in this study, but according to the trend, the cost of lithium-ion batteries is decreasing. A
decrease in price would mean that more stations benefits from using an energy storage.

                                                      3
Acknowledgment
This thesis covers 30 credits (hp) and completes my master’s degree in Energy Systems Engineering at
Uppsala University and the Swedish University of Agricultural Sciences (SLU). The project was conducted
on behalf of Mälarenergi Elnät in Västerås.

    I would like to thank my supervisors at Mälarenergi Elnät, Kenny Granath and Johanna Rosenlind, for
your guidance throughout the project. A big thank you also to everyone at the grid planning department
for creating a welcoming environment and for answering all my questions and helping me out in various
ways. In addition, I want to thank Juan de Santiago at the Division of Electricity at Uppsala University
for your involvement and help.

   Others that have contributed to this paper include Peter Norrman at Hybricon Bus Systems, Fredrik
Persson at Göteborg Energi and David Steen at Chalmers. Thank you for taking the time to discuss and
answer my questions.

   Lastly, I would like to thank my parents and Sebastian for all your input, advice and encouragement
and for reading the whole thesis multiple times without even complaining.

                                                   4
Sammanfattning
I takt med att befolkningen i städerna växer, ökar kraven på en hållbar och effektiv kollektivtrafik. Flera
svenska städer, däribland Umeå, Stockholm och Göteborg, har implementerat snabbladdande elbussar på
några av sina busslinjer. Även i Västerås utreds möjligheten att införa den här sortens bussystem.

    Systemet bygger på något som kallas Opportunity charging, vilket innebär att bussarna laddas på hög
effekt vid ändhållplatserna under den tid som bussen normalt står stilla där. Den här typen av laddning
möjliggör mindre bussbatterier och färre bussar än nattlig depåladdning, men den höga laddeffekten in-
nebär också en påfrestning på distributionsnätet. Om snabbladdningsstationerna leder till överbelastning
på det befintliga distributionsnätet blir det nödvändigt att göra förstärkningar. Laddoperatören, som äger
och driver laddstationerna, betalar en avgift till nätägaren för att vara ansluten till nätet och ta ut effekt.
Dessutom bekostar laddoperatören själva anslutningen. Denna måste dimensioneras med avseende på
termisk kapacitet, spänningsfall och utlösningsvillkor. Laddstationer med högt effektuttag och/eller stort
avstånd till en nätstation kan bli kostsamma att ansluta till nätet på grund av höga avgifter och väl tilltagna
kablar.

    Den här rapporten syftar till att undersöka huruvida ett energilager skulle kunna sänka nätinvester-
ingskostnader för nätägaren och/eller nätanslutningskostnader för laddoperatören genom att sänka och
jämna ut effektuttaget från laddstationerna. Utredningen är gjort med grund i det elbussytem som övervägs
i Västerås samt det lokala distributionsnätet.

    Lastprofilerna från de olika tänkta laddstationerna uppskattas med hjälp av bussarnas tidtabeller,
körsträckor samt antagen förbrukning om 2.3 kWh/km. Distributionsnätets tillgängliga kapacitet under
normalmatning utvärderas med hjälp av data över alla transformatorers högsta effektflöde samt kablarnas,
transformatorernas och nätstationernas belastningsförmåga. Det visar sig att existerande 10kV-nät inte
löper någon risk att överbelastas vid implementering av snabbladdningsstationer vid någon av bussänd-
hållplatserna i Västerås. Däremot räcker inte märkeffekten till hos en del av de transformatorer och
nätstationer som ligger närmast den tänkta laddstationen. Investeringskalkylen visar att den lägsta årliga
kosntaden, annuiteten, erhålls av att investera i nya transformatorstationer istället för att sänka effektuttaget
med hjälp av ett batterilager. En bidragande orsak till detta är batteriernas antagna livslängd på 8 år jämfört
med nätkomponenters 40-åriga livslängd.

     Nätanslutningskostnaderna minimeras genom att optimera systemet, bestående av laddare, energilager
och nätanslutningskomponenter (kablar och säkringar). Nätets kapacitet och storleken på energilagret väljs
för minsta möjliga årliga kostnad. Detta görs genom linjärprogrammering i MATLAB på 4 olika platser
med olika egenskaper, så som avstånd mellan laddstation och nätstation, bussfrekvenser och laddeffekter.
De kostnader som minimeras är dels annuiteten av investeringen och dels de årliga avgifterna. Det visar sig
att energilager i vissa fall kan minska kostnaderna för en lågspänningsanslutning då den stora investeringen
i ett energilager vägs upp av de minskade årliga avgifterna. Den främsta bidragande faktorn som gör
det ekonomiskt fördelaktigt är en låg bussfrekvens. Det lager som visar sig lönsamt är LTO-batteriet
(litium-titanat), som klarar djupast urladdning och högst effekt av de studerade batterierna. Högspän-
ninganslutning har dock lägst årlig kosntad i alla de studerade fallen, och det är inte kostnadseffektivt att
investera i batterilager för att minska effektuttaget vid en sådan anslutning.

                                                       5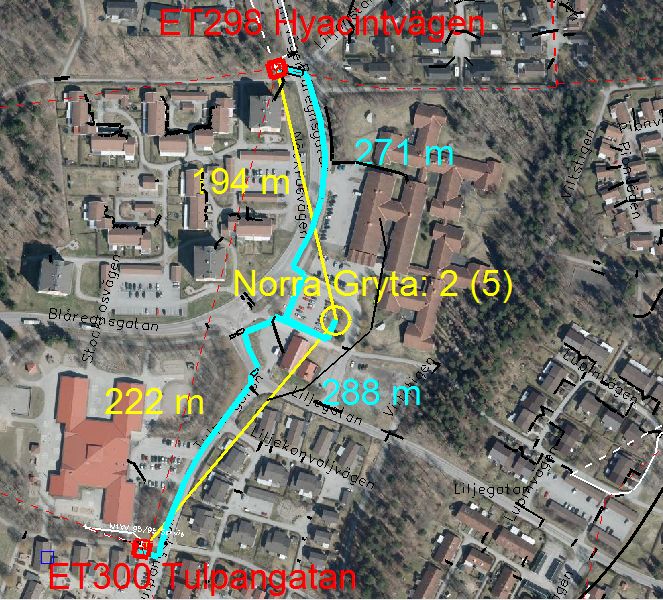
Teknisk ordlista
balance responsible party: balansansvarig
cable loadability: kabelbelastning
current collector: strömavtagare
electricity supplier: elhandlare
feeder: matarkabel
flywheel: svänghjul
grid concession: nätkosession
harmonics: övertoner
looped grid structure: maskat nät
national grid: stamnät
network operator: nätföretag
pantograph: pantograf
primary substation: fördelningsstation
Transmission System Operator, TSO: Systemansvarig
trolley bus: linjebus
secondary substation: nätstation
trigger condition: utlösningsvillkor
type curve: typkurva

                                             6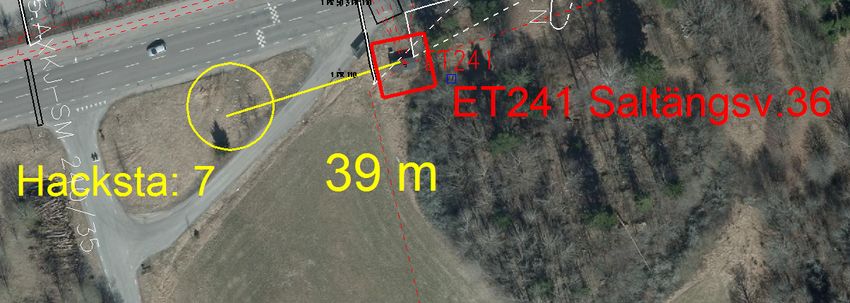
Contents

1 Introduction                                                                                                                                                                12
  1.1 Problem and aim of study . . . . .          .   .   .   .   .   .   .   .   .   .   .   .   .   .   .   .   .   .   .   .   .   .   .   .   .   .   .   .   .   .   .   12
      1.1.1 Aim . . . . . . . . . . . . .         .   .   .   .   .   .   .   .   .   .   .   .   .   .   .   .   .   .   .   .   .   .   .   .   .   .   .   .   .   .   .   13
      1.1.2 Limitations and assumptions           .   .   .   .   .   .   .   .   .   .   .   .   .   .   .   .   .   .   .   .   .   .   .   .   .   .   .   .   .   .   .   14
  1.2 Related studies and projects . . . .        .   .   .   .   .   .   .   .   .   .   .   .   .   .   .   .   .   .   .   .   .   .   .   .   .   .   .   .   .   .   .   14
  1.3 Structure of report . . . . . . . . .       .   .   .   .   .   .   .   .   .   .   .   .   .   .   .   .   .   .   .   .   .   .   .   .   .   .   .   .   .   .   .   15

2 Theory                                                                                                                                                                      16
  2.1 The Swedish power system . . . . .              .   .   .   .   .   .   .   .   .   .   .   .   .   .   .   .   .   .   .   .   .   .   .   .   .   .   .   .   .   .   16
      2.1.1 Actors on the electricity market          .   .   .   .   .   .   .   .   .   .   .   .   .   .   .   .   .   .   .   .   .   .   .   .   .   .   .   .   .   .   16
      2.1.2 Grid network . . . . . . . . .            .   .   .   .   .   .   .   .   .   .   .   .   .   .   .   .   .   .   .   .   .   .   .   .   .   .   .   .   .   .   16
      2.1.3 Substations . . . . . . . . . .           .   .   .   .   .   .   .   .   .   .   .   .   .   .   .   .   .   .   .   .   .   .   .   .   .   .   .   .   .   .   17
      2.1.4 Power lines and cables . . . .            .   .   .   .   .   .   .   .   .   .   .   .   .   .   .   .   .   .   .   .   .   .   .   .   .   .   .   .   .   .   18
  2.2 Electric buses . . . . . . . . . . . .          .   .   .   .   .   .   .   .   .   .   .   .   .   .   .   .   .   .   .   .   .   .   .   .   .   .   .   .   .   .   20
      2.2.1 Energy supply and demand . .              .   .   .   .   .   .   .   .   .   .   .   .   .   .   .   .   .   .   .   .   .   .   .   .   .   .   .   .   .   .   20
      2.2.2 Charging of electric buses . . .          .   .   .   .   .   .   .   .   .   .   .   .   .   .   .   .   .   .   .   .   .   .   .   .   .   .   .   .   .   .   20
      2.2.3 Grid connection . . . . . . . .           .   .   .   .   .   .   .   .   .   .   .   .   .   .   .   .   .   .   .   .   .   .   .   .   .   .   .   .   .   .   23
      2.2.4 Swedish examples . . . . . . .            .   .   .   .   .   .   .   .   .   .   .   .   .   .   .   .   .   .   .   .   .   .   .   .   .   .   .   .   .   .   25
  2.3 Energy storage . . . . . . . . . . . .          .   .   .   .   .   .   .   .   .   .   .   .   .   .   .   .   .   .   .   .   .   .   .   .   .   .   .   .   .   .   25
      2.3.1 Applications and technologies             .   .   .   .   .   .   .   .   .   .   .   .   .   .   .   .   .   .   .   .   .   .   .   .   .   .   .   .   .   .   25
      2.3.2 Battery Energy Storage (BES)              .   .   .   .   .   .   .   .   .   .   .   .   .   .   .   .   .   .   .   .   .   .   .   .   .   .   .   .   .   .   27

3 Method and data                                                                                                                                                             30
  3.1 Technical feasibility . . . . . . . . . . . . .                 .   .   .   .   .   .   .   .   .   .   .   .   .   .   .   .   .   .   .   .   .   .   .   .   .   .   30
      3.1.1 Electric bus system . . . . . . . . . .                   .   .   .   .   .   .   .   .   .   .   .   .   .   .   .   .   .   .   .   .   .   .   .   .   .   .   30
      3.1.2 Evaluation of grid capacity . . . . . .                   .   .   .   .   .   .   .   .   .   .   .   .   .   .   .   .   .   .   .   .   .   .   .   .   .   .   31
      3.1.3 Cable sizing . . . . . . . . . . . . . .                  .   .   .   .   .   .   .   .   .   .   .   .   .   .   .   .   .   .   .   .   .   .   .   .   .   .   31
      3.1.4 Energy storage system . . . . . . . . .                   .   .   .   .   .   .   .   .   .   .   .   .   .   .   .   .   .   .   .   .   .   .   .   .   .   .   32
  3.2 Cost estimates . . . . . . . . . . . . . . . .                  .   .   .   .   .   .   .   .   .   .   .   .   .   .   .   .   .   .   .   .   .   .   .   .   .   .   33
  3.3 Comparison of costs . . . . . . . . . . . . .                   .   .   .   .   .   .   .   .   .   .   .   .   .   .   .   .   .   .   .   .   .   .   .   .   .   .   34
  3.4 Optimization of annual grid connection cost                     .   .   .   .   .   .   .   .   .   .   .   .   .   .   .   .   .   .   .   .   .   .   .   .   .   .   34
      3.4.1 Linear programming problem . . . . .                      .   .   .   .   .   .   .   .   .   .   .   .   .   .   .   .   .   .   .   .   .   .   .   .   .   .   35
      3.4.2 Parameters . . . . . . . . . . . . . . .                  .   .   .   .   .   .   .   .   .   .   .   .   .   .   .   .   .   .   .   .   .   .   .   .   .   .   35

4 Results                                                                                                                                                                     39
  4.1 Annual grid connection cost . .     .   .   .   .   .   .   .   .   .   .   .   .   .   .   .   .   .   .   .   .   .   .   .   .   .   .   .   .   .   .   .   .   .   39
      4.1.1 Hällagatan, Hälla . . . .     .   .   .   .   .   .   .   .   .   .   .   .   .   .   .   .   .   .   .   .   .   .   .   .   .   .   .   .   .   .   .   .   .   39
      4.1.2 Flisavägen, Bjurhovda . .     .   .   .   .   .   .   .   .   .   .   .   .   .   .   .   .   .   .   .   .   .   .   .   .   .   .   .   .   .   .   .   .   .   44
      4.1.3 Forntidsgatan, Bjurhovda      .   .   .   .   .   .   .   .   .   .   .   .   .   .   .   .   .   .   .   .   .   .   .   .   .   .   .   .   .   .   .   .   .   46
      4.1.4 Björnögården . . . . . .      .   .   .   .   .   .   .   .   .   .   .   .   .   .   .   .   .   .   .   .   .   .   .   .   .   .   .   .   .   .   .   .   .   47
  4.2 Grid owner investments . . . .      .   .   .   .   .   .   .   .   .   .   .   .   .   .   .   .   .   .   .   .   .   .   .   .   .   .   .   .   .   .   .   .   .   49
      4.2.1 Hälla . . . . . . . . . . .   .   .   .   .   .   .   .   .   .   .   .   .   .   .   .   .   .   .   .   .   .   .   .   .   .   .   .   .   .   .   .   .   .   51
      4.2.2 Forntidsgatan, Bjurhovda      .   .   .   .   .   .   .   .   .   .   .   .   .   .   .   .   .   .   .   .   .   .   .   .   .   .   .   .   .   .   .   .   .   52
      4.2.3 Björnögården . . . . . .      .   .   .   .   .   .   .   .   .   .   .   .   .   .   .   .   .   .   .   .   .   .   .   .   .   .   .   .   .   .   .   .   .   53

5 Discussion                                                                                            54
  5.1 Annual grid connection cost . . . . . . . . . . . . . . . . . . . . . . . . . . . . . . . . . . . 54

                                                                      7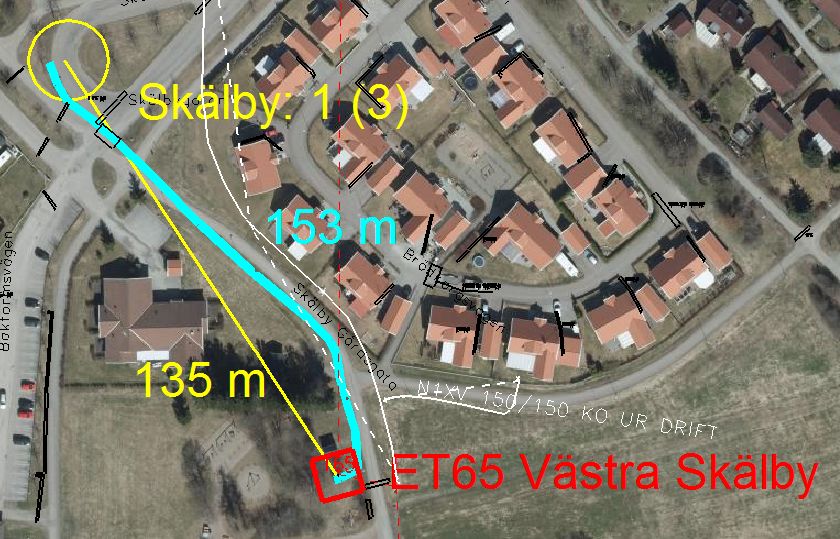
5.2   Suggested design approach      .   .   .   .   .   .   .   .   .   .   .   .   .   .   .   .   .   .   .   .   .   .   .   .   .   .   .   .   .   .   .   .   .   .   .   56
  5.3   Grid owner investments . .     .   .   .   .   .   .   .   .   .   .   .   .   .   .   .   .   .   .   .   .   .   .   .   .   .   .   .   .   .   .   .   .   .   .   .   56
  5.4   Criticism of the sources . .   .   .   .   .   .   .   .   .   .   .   .   .   .   .   .   .   .   .   .   .   .   .   .   .   .   .   .   .   .   .   .   .   .   .   .   56
  5.5   Criticism of the methods . .   .   .   .   .   .   .   .   .   .   .   .   .   .   .   .   .   .   .   .   .   .   .   .   .   .   .   .   .   .   .   .   .   .   .   .   57
  5.6   Suggested further studies .    .   .   .   .   .   .   .   .   .   .   .   .   .   .   .   .   .   .   .   .   .   .   .   .   .   .   .   .   .   .   .   .   .   .   .   57

6 Conclusions                                                                                                                                                                      58

List of Figures

   1    Map of buss lines in Västerås                                                                                                                                              12

   2    Structure of local electricity grid in Västerås                                                                                                                            13

   3    Network structures                                                                                                                                                         17

   4    Substation                                                                                                                                                                 18

   5    Underground cable                                                                                                                                                          18

   6    Bus energy consumption                                                                                                                                                     20

   7    (a) Trolley bus conection (b) Catenary-free dynamic charging                                                                                                               22

   8    (a) Hight power pantograph charging station. (b) Ground-based conductive fast charging
        station                                                                                                                                                                    22

   9    Wireless charging station principle.                                                                                                                                       23

   10 System without ESS                                                                                                                                                           24

   11 System layout with energy storage system.                                                                                                                                    24

   12 Applications for energy storage systems                                                                                                                                      26

   13 Charging characteristics of batteries                                                                                                                                        27

   14 Available battery capacity for different C-rates                                                                                                                             27

   15 Past and estimated future cost of li-ion batteries                                                                                                                           29

   16 Relationship between battery cycle-life and depth-of-discharge                                                                                                               29

   17 Calculation of available capacity during normal feeding                                                                                                                      31

   18 Calculation of trigger condition                                                                                                                                             32

   19 Suitable of energy storage technologies                                                                                                                                      33

   20 Model with system parameters.                                                                                                                                                36

   21 The substations at Hälla.                                                                                                                                                    39

                                                                           8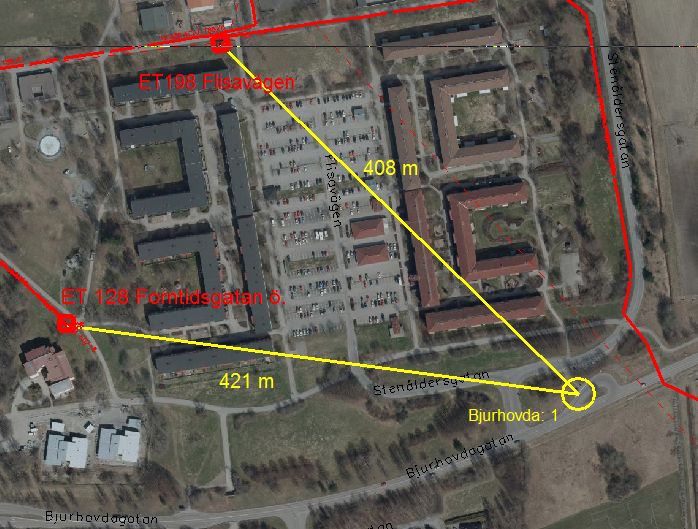
22 Annual cost for the Hälla station connection.                                                 40

23 The expected power consumption from the potential charging station at Hälla.                  41

24 Optimization of 5000 randomized loadprofiles at Hälla, low-voltage, LTO.                      42

25 The annual connection costs achieved by certain grid capacities and storage sizes at Hälla.   43

26 Battery sizes obtained when optimizing 5000 randomized load profiles with a fixed grid
   capacity of 554 kW.                                                                           43

27 The substations at Bjurhovda.                                                                 44

28 The expected power consumption from the potential charging station at Bjurhovda.              45

29 Optimization of 5000 randomized load profiles at Flisavägen, low-voltage, LTO.                46

30 The substations at Björnön.                                                                   47

31 Optimal battery size in relation to battery cost.                                             48

32 The expected power consumption from the potential charging station at Björnögården.           49

33 Relationship between battery cycle-life and depth-of-discharge for LTO battery.               64

34 Sensitivity analysis Björnögården, LTO                                                        68

35 Optimization of 5000 randomized load profiles at Björnögården, low-voltage, LTO.              68

36 Optimization of 5000 randomized load profiles at Björnögården, high-voltage, LTO.             68

37 Sensitivity analysis, Björnögården, LFP.                                                      69

38 Optimization of 5000 randomized load profiles at Hälla, high-voltage, LTO.                    69

39 Sensitivity analysis, Hälla, LFP.                                                             69

40 Sensitivity analysis, Flisavägen, LTO.                                                        70

41 Optimization of 5000 randomized load profiles at Flisavägen, low-voltage, LTO.                70

42 Sensitivity analysis, Flisavägen, LFP.                                                        70

43 Sensitivity analysis, Forntidsgatan, LTO.                                                     71

44 Optimization of 5000 randomized load profiles at Forntidsgatan, low-voltage, LTO.             71

45 Optimization of 5000 randomized load profiles at Forntidsgatan, high-voltage, LTO.            71

46 Sensitivity analysis, Forntidsgatan, LFP.                                                     72

                                                 9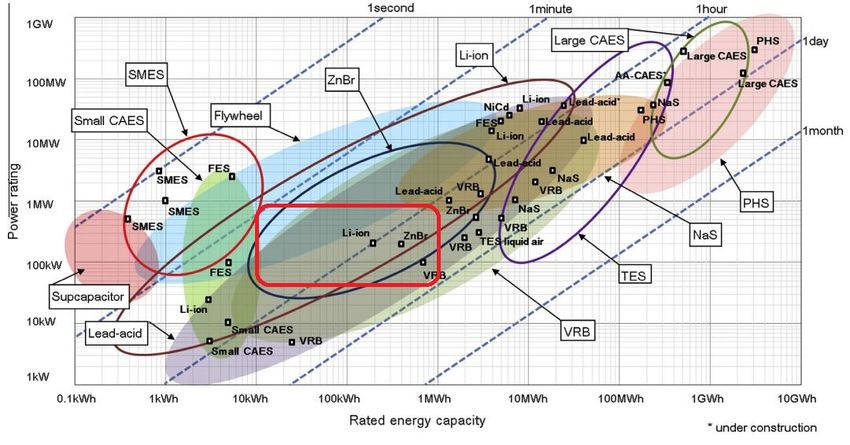
List of Tables

  1   Fast charging stations for electric buses, operated in Sweden                       25

  2   Battery characteristics                                                             28

  3   Details about bus routes in the study                                               30

  4   Battery model parameters                                                            33

  5   Optimization of the connection cost at the Hälla station.                           39

  6   Sensitivity analysis for LTO battery at Hälla.                                      42

  7   Optimization of the connection cost at the Flisavägen, Bjurhovda station.           44

  8   Optimization of the connection cost at the Forntidsgatan, Bjurhovda station.        46

  9   Optimization of the connection cost at the Björnögården station.                    47

  10 Available capacity in primary substations.                                           50

  11 Available capacity for connection at suitable secondary substations.                 51

  12 Transformer investments at the Hälla station.                                        52

  13 Transformer investments at the Forntidsgatan, Bjurhovda station.                     52

  14 Transformer investments at the Björnögården station.                                 53

  15 Normal values of cables, substations and other grid components as estimated by Ei.   63

  16 Maximum cable loading.                                                               63

  17 Low-voltage connection prices.                                                       64

  18 High-voltage connection prices.                                                      64

  19 Flywheel characteristics.                                                            65

  20 SMES characteristics.                                                                65

  21 Capacitor and supercapacitor characteristics.                                        65

                                                   10
List of Symbols and Acronyms
APS Aesthic Power Supply
BEB Battery Electric Bus
BES Battery Energy Storage
CAES Compressed Air Energy Storage
CPT Capacitive Power Transfer
DoD Depth-of-discharge
EAC Equivalent Annual Cost
Ei Swedish Energy Markets Inspectorate (Energimarknadsinspektionen)
ERS Electric Road Systems
EV Electric Vehicle
FCEB Fuel Cell Electric Bus
FES Flywheel Energy Storage
HEB Hybrid Electric Bus
LFP Lithium iron phosphate battery
LTO Lithium titanate battery
NPV Net Present Value
PHS Pumped Hydroelectric Storage
RIPT Resonant Inductive Power Transfer
RPT Resonant Power Transfer
SMES Superconducting Magnetic Energy Storage
SRS technology by Alstom
TSO Transmission System Operator
WPT Wireless Power Transfer
A Area (m2 )
CL Maximum power drawn from the grid
E Energy
E B Size of the energy storage
I Current (A)
φ Phase shift
k ESS Battery interest rate
k g Grid interest rate
L Lenght (m)
n Lifetime
η Efficiency
Pc (t) Charging power of the storage
Pd (t) Discharge power of the storage
Pg (t) Power drawn from the grid
Ploss Resistive power loss
r rate of interest
R Resistance
ρ Resistivity ()
S Salvage value
U Voltage
YESS Battery life time
Yg Grid life time
Z Impedance
111 Introduction
In 2014, 54 % 1 of the world’s population lived in urban areas [1]. For Europe, the number was 73 % [1]
and for Sweden 85 % (2010) [2]. The urbanization is expected to continue in all continents during the first
half of the century and the urban residents are estimated to increase with 3 billion people between 2014
and 2050 [3]. Sweden is no exception from the trend and about 70 % of the country’s population increase
is expected to take place in the three largest cities [4]. Stockholm county, with 2.2 million inhabitants
(2016), grows with 35,000 new residents each year [5]. The increasing urbanization seen in the world
puts strains on infrastructure as well as the environment [1, 5]. To decrease the traffic density and air
pollution experienced in many urban areas, an efficient and sustainable public transport system is one
important puzzle piece [6]. Electrification of buses shows promise to reduce the fossil fuel dependency of
the transportation sector as well as create a healthier urban environment [7].
Electric buses are nothing new, but have been around for over 100 years in the shape of trolley buses
[8]. In recent years, there has been a major development in battery electric buses that are charged either
overnight in the depot or in fast charging stations at selected bus stops. In Sweden, several bus routes are
being electrified. Volvo, Siemens and Vattenfall together carry out the project ElectriCity in Gothenburg
and since 2015 run a 7.5 km long bus route with electric and hybrid buses charged in high power charging
stations at the end stops [9]. In Umeå, the company Hybricon has developed electric buses that charge
in only three minutes and can run for about an hour [8]. Scania and Vattenfall are conducting trials with
wireless charging of electric buses and in December of 2016 their first buses were taken into operation in
Södertälje [10].
1.1 Problem and aim of study
In Västerås, Sweden, the local public trans-
portation company Västmanlands Länstrafik is
investigating the possibility to convert part of
the bus fleet from biogas buses to battery
electric buses. All seven urban bus lines,
viewed in figure 1, are considered. The pro-
posed concept is to charge the bus batter-
ies at the end stations during idling, a strat-
egy that requires high power fast charging sta-
tions.
Depending on the bus line, the scheduled
time at the end station is 1-10 minutes and the
bus frequency 2-8 buses/hour. The bus routes
have one-way distances of 6-14 km and the es-
timated power demand is in the range 250-1000
Figure 1: Västerås with its seven urban bus lines that
kW.
all pass through the central station (Centralen) [11].
The distribution network operator in Västerås is Mälarenergi Elnät,which are the owners of the 10 kV
and 400 V grid. The general structure of the local grid is presented in figure 2. It consists of medium- and
low-voltage networks as well as primary and secondary substations. The main flow of power is from the
overlying transmission grid via the primary substations and out to the customers and the end of the 400
V/230 V grid. The grid is dimensioned for a high power flow close to the primary substations but have
1based on various national definitions of urban area.
12less capacity further away. The electric bus fast charging stations can be connected to the grid either on
the 10 kV-side or on the 400 V-side of a secondary substation.
Figure 2: The local grid in Västerås is owned by Mälarenergi Elnät and consist of the 10 kV and the
400 V networks. Power from the overlying grid is transformed into medium-voltage level in the primary
substations. It is distributed in the 10 kV grid that consists mainly of underground cables. In secondary
substations the voltage is transformed to 3-phase 400 V and in the cable cabinets the phases, being 230
V each, are separated. Dotted lines illustrate customer owned feeders that connects the customers to the
grid. They can be connected at different voltage levels.
There is a limit to the amount of power you can input or output to a point in the grid, constrained by the
required voltage quality and the thermal capacity of the grid components [12]. In addition, it is of impor-
tance to fulfill electrical installation criteria. All these factors must be taken into account when designing
a grid connection based on the estimated power demand. Every customer that connects to the electric grid
pay the cost price of the connection as well as fees to the grid owner that are based on the subscribed
power. Fast charging stations are expensive to connect to the grid due to the short and high power peaks
that occur only when a bus is there to charge. Because of these load characteristics, the implementation of
electric vehicles also gives rise to some concern about the load on the power distribution network [6]. If
the power outtake exceeds the available grid capacity, costly reinforcements must be made by the grid owner.
An energy storage system is a promising solution to make fast charging stations more cost effective
since it can decrease and even out its power demand [13]. A large storage can affect the cost both positively
and negatively since it enables a weaker grid and lower fees but is costly in itself. Because of this, there is
a trade-off between the size of the energy storage and the strength of the grid. For each system, there exists
an ideal combination of storage and grid capacity that minimizes the costs for the charging station owner
or the grid owner.
1.1.1 Aim
The aim of this study is to determine whether an energy storage system connected to an electric bus fast
charging station can decrease the grid connection costs for the charging station owner or grid reinforcement
costs for the grid owner. In addition, the objective is to propose a design approach for the system that
consists of the charging station, the energy storage and the grid connection components.
The study is conducted on the electric bus system that is considered in Västerås and four grid connection
cases, with different characteristics, are analyzed in more detail. In each case, the cost of the connection is
evaluated in terms of the annuity and minimized by optimally sizing the energy storage system in relation
to the grid components. Different lithium-ion batteries are considered. The optimization is done by use of
Integer linear programming in MATLAB.
131.1.2 Limitations and assumptions
This study focuses only on the Västerås case, and the bus lines and substations that exist there. Only fast
charging at the end stations is considered. It is assumed that there will be no changes to the present bus
schedules nor the routes. The charging station design load profile uses the weekday schedule and a bus
energy consumption of 2.3 kWh/km (as estimated by VL).
In the investigation of potential grid reinforcements, only the design (normal) feeding mode as well as
primary and secondary substations are considered. The available power is evaluated based on a worst case
scenario. Costs considered are the investment costs of 10 kV- cables, transformers and substations.
When analyzing the grid connection, the costs taken into account are the investment costs of the energy
storage and the grid connection cables as well as the fees that are payed by the customer to the grid owner.
The cost of the charger and the bus is not considered. It is assumed that the price of electricity does not
change enough with time for the yearly electricity cost to change if the consumption pattern changes.
It is assumed that the lifetime of the electric buses as well as the battery storage system is 8 years. The
grid investment has an expected lifetime of 40 years, even though it is not certain that it will be used for
the same purpose, or at all, during that whole time.
No regard has been taken to the question of ownership of the potential energy storage. Grid owners are
prohibited from producing and trading electricity and there is a disagreement whether operating an energy
storage falls into that category.
1.2 Related studies and projects
In the recent years, several Swedish master’s thesis projects have been conducted that concerns electric
buses. Zisimopoulos [14] investigates the electrification of internal buses at Arlanda and evaluates charging
systems, costs and CO2 emissions. Lindberg [15] studies the power quality of the two fast charging stations
in Umeå and concludes that the stations emit harmonics that might affect grid connected consumers nearby.
Karlsson [16] evaluates the total cost of electrifying a whole bus system and compares various charging
strategies. The thesis concludes that end-station fast charging combined with depot charging is most cost
effective and that the grid connection cost is a main component of the total cost.
At Chalmers in Gothenburg a project is currently being conducted that aims to analyze the effect that
electric bus fast charging stations have on the distribution grid [17]. Energy storage solutions are being
investigated as well as the possibility to use the charging stations to stabilize the grid voltage. Another
Chalmers study, conducted by Grauers et. al. [18], evaluates the cost effectiveness of various charging
systems for electric buses. The study concludes that opportunity charging (fast charging during scheduled
idle time) is the least costly option.
Fusco et. al. [6] has modeled average energy consumption of electric buses as a function of average
speed during the route. The paper proposes a methodology for optimal design of a transit system that
includes electric buses and charging stations. Ding et. al. [13] suggests an optimal control strategy for
fast charging stations combined with energy storage systems as well as the optimal storage sizing. The
article also evaluates how much the investment cost and the charging cost can be decreased by the use of a
lithium-ion battery. In the study, the costs considered are the investment in cables, transformer and battery
as well as the cost of the electricity, that varies substantially throughout the day. It is evaluated on load
data from a real system where several buses are charged by the same charger. The conclusion of the study
is that the two lithium based batteries LFP and LTO can decrease the costs associated with a fast charging
14station, mostly due to the varying electricity price. The model in the study does not take into account the
difference in lifetime between the grid components and the energy storage.
1.3 Structure of report
The report is structured as follows. Section 2 presents the background theory necessary to understand the
study and its results. It gives a general overview of the Swedish power system and also provides a more
thorough description of the distribution grid and distribution grid planning. Furthermore, section 2 gives
insight in the area of technology that is electric buses and go over possible charging strategies, present
manufacturers and ongoing projects. Section 2 also describes various energy storage technologies and
compare their characteristics.
In section 3, the general methods of the study are described and the data presented. In addition, the
section describes the model that was created to optimize the system, consisting of the bus, the charger, the
grid connection and the energy storage.
The results of the optimization are compiled in section 4, discussed in section 5 and in section 6 the
conclusions drawn from the study are presented.
152 Theory
2.1 The Swedish power system
2.1.1 Actors on the electricity market
The Nordic countries share a common electricity market that was deregulated in 1996 [19]. Players on the
market are producers, consumers, suppliers, network operators, a Transmission System Operator as well
as the authorities Swedish Energy Markets Inspectorate (Ei) and Swedish Energy Agency.
The Transmission System Operator (TSO) is Svenska Kraftnät, a state-owned authority that has the
overall system responsibility. They own and operate the national grid, maintain power balance in the
system and procures a power reserve before each winter [19].
Network operators own the grid and are responsible for the transport of electricity. There are about
160 network operators in Sweden and Mälarenergi Enlät AB is one of them [20]. Because of natural mo-
nopolies there can be only one actor providing electric grid at each location. According to the electricity
law(2013:207) 2 chap. §1, a network operator must have permission, so called grid concession, from Ei to
build and operate a grid in a certain area [21]. To ensure a well-functioning market as well as reasonable
prices, competition is simulated through rules and regulations managed by Ei [20]. As established in the
electricity market reform in 1996, Swedish network operators are not allowed to produce or trade electricity
other than to cover up for their grid losses or secure operation in case of faults (law(2011:712) 3 chap.
§1) [21]. They are obliged to maintain a high power quality and make sure the right amount of power is
delivered to the consumers despite losses in the grid (law(2005:1110) 3 chap. §9 [21]). Any producer or
consumer that so wishes, must be connected to the local network, although the connection is payed for by
the connecting actor (law(2005:404) 3 chap. §6) [22].
Electricity suppliers buy electricity, commonly on the market Nord Pool Spot, and sell it to their cus-
tomers. As opposed to grid owners, they compete with each other, which gives the consumer the option
to choose supplier company and deal. Every electricity supplier is obliged to, at every instant, deliver
the same amount of power as their customers consume, which makes them the Balance responsible party.
In case of imbalance, the TSO trades electricity on the balance market with short notice and charges the
Balance responsible party that failed to keep the balance. This motivates all actors responsible for the
balance to perform good estimates of their customer’s consumption [20].
Producers sell electricity directly to customers or to electricity suppliers on the spot market. They pay
a fee to the network operator to connect to the grid and feed it with power. Consumers are charged for the
used power and electricity both by the local network operator and the electricity supplier as well as pay
electricity tax [20].
2.1.2 Grid network
The electric grid consists of a high-voltage transmission system and a low-voltage distribution system.
Traditionally, power is generated at large plants connected to the national grid, transported further through
the regional grid and lastly distributed to consumers in the local low-voltage grid. With the implementation
of renewable power production, such as solar and wind power, electricity is to a larger extent produced and
connected on the consumer side of the grid [23].
The stem in the Swedish transmission network is the national grid that consists of AC power lines at
400 kV and 220 kV and stretches from north to south to connect the large producers with the consumer
16areas [19]. HVDC cables link Sweden to neighboring countries Finland, Lithuania, Poland, Germany
and Denmark [19]. The national grid connects to the local distribution network via regional grids with
voltages of 20−130 kV [19]. The regional networks are mainly owned by Vattenfall, E.ON and Ellevio [24].
Locally, power is distributed to consumers through either medium-voltage networks (10-20 kV) or
low-voltage networks (400/230 V) [23]. When faults occur in the power system it is most often in the local
grids [19]. Networks can have either radial or looped structure, as illustrated in figure 3. A radial grid is
the least costly network structure and the easiest to protect but in the event of failure in a line, all nodes
connected behind the fault will be affected [25]. This structure is mostly used on the countryside. Loop
and multi-loop structures are used in urban areas [25]. They are more expensive to construct but have
higher resilience since each point can be fed in several ways. During normal feeding, these networks are
operated as radials but have the possibility to open or close loops so that the power can be alternatively fed
in case of faults or maintenance on a line.
Figure 3: Network structures can be either radial, looped or multi-looped. The dots represents substations
or consumers. Dotted lines mark where the loop can be closed with switches to enable an alternative
operation [25]. (a) Radial network with single-point feeding. (b) Loop network with single-point feeding.
(c) Multi-loop network with single-point feeding. (d) Multi-loop network with multiple-point feeding.
Distribution network planning involves planning long-term and short-term investments to meet demand
changes or maintain quality as well as construction design of network structure, cables, power lines, trans-
formers and other components. The main goal is to achieve safe and reliable power transfer to the lowest
possible lifetime cost [26]. When major installations are made in a node, both the capacity of the normal
feeding mode as well as the back-up feeding should be analyzed so that it is not exceeded.
The load patterns of various electricity customers can be described by a type curve that graphs the
consumed power during a day as mean and standard deviation. Type curves are an important resource
that aid in grid planning activities such as grid dimensioning, load forecasting, investments, reinforcement
planning etc. A load forecasting model was developed by Svenska Elverksföreningen in the 90’s and
although updated, it is still used today. The model is based on substantial measurements and covers many
load types. Several type curves can be superimposed to create load behaviors closely linked to reality.
Inputs to the model are degree-day, month, weekday/weekend, mean temperature (24h), yearly energy
consumption and likelihood that the load does not overstep the forecast. For a more detailed description of
the model, the reader is referred to [27].
2.1.3 Substations
A substation is a node in the grid network where power lines can be divided and current or voltage levels
changed. It is also where the system protection is located and where the current can be stopped. Substations
17can be equipped with transformers, protective relays, break-
ers and disconnectors as well as meters and devises for
reactive compensation [25]. Relays measure currents and
voltages, detect abnormalities and control the breakers. A
breaker stops the current, most commonly with the insu-
lating SF6 − gas, while the disconnector physically sepa-
rates two conductors as a visual confirmation of the bro-
ken current. Fuses and other surge protection devises pro-
tects the components from over-voltages [28]. Substations
can be located in open air, when space is enough, or in-
side a metal enclosed construction isolated with SF6 − gas,
when space is restricted [25]. Inside the substation incom-
ing and outgoing feeders are connected to one or several Figure 4: Layout of a typical 10/0.4 kV
common bus bars. Figure 4 depicts a typical substation lay- distribution substation in the Västerås grid.
out.
2.1.4 Power lines and cables
Over-head transmission lines and under-ground cables transport electricity from producers to consumers.
Burying cables under ground increases the system reliability due to avoided exposure to weather, lightning,
falling trees etc., but the investment is more expensive than equally rated over-head lines [25]. Power can
be transferred either through direct current (DC) or alternating current (AC). A DC current uses the whole
cross-section area of a conductor while an AC current, due to the skin effect, flows only on the conductor
surface. This makes DC transfer more efficient [25]. Despite this, AC is dominating the distribution system.
Over-head lines generally uses light aluminum conductors combined with a steel core to improve
the strength [25]. The transmission lines are hung on towers separated from each other and can be
either uninsulated or insulated [29]. Since it is the cheapest method, it is the most common choice for
long-distance power transfer [25]. However, over 97 % of the existing kilometers of low-voltage power
conductors in Sweden are under-ground cables [23]. A cable and its components are illustrated in figure 5.
Figure 5: A cable consists of several layers, each with its special function. Conductors are made out of
copper or aluminum. Copper has a lower resistivity than aluminum, but it is heavier and more expensive
[25]. Copper is used for cross section areas of 0.5 - 2500 mm2 while aluminum only is preferred for areas
of 50 mm2 and above [29]. To isolate the conductor either plastic or rubber is used. For high voltage
cables, PEX-isolation is dominating. This is a cross linked polyethylene with thermal and mechanical
characteristics very suitable for electric isolation applications [29]. Separated from the conductor with
insulation is the concentric neutral conductor, made out of copper or aluminum wire or tape. To give
the cable a circular cross section, a filling material is often used. As protection, several layers of plastic,
sometimes with metal reinforcement, are added on the surface [29].
182.1.4.1 Cable selection
The cable load capacity specifies the maximum current or power a certain cable can transport and is
limited by the temperature level the cable materials can withstand. When a current runs in a cable, the
temperature rises due to heat power losses in the conductor. These losses are determined by the current
and the resistance according to [28]:
Ploss = R · I 2 (1)
where Ploss is the resistive losses in the wire. The current depends on the transferred power and nominal
voltage. To minimize the losses during high power transfer (large I) and long distances (large R) the voltage
is increased.
The percentage voltage drop in a cable is described by equation 2. It is seen that it depends on
the transmitted power (P), the resistance (R), the reactance (X) and phase shift (φ). The reactance can
be neglected and the resistance described by the cable resistivity (ρ), length (L) and cross-section area
(A). In a customer facility, the voltage drop should not exceed 4 % according to the Swedish electricity
standardization Svensk elstandard SS 436 40 00 [30]. This requirement affects the feasible cable geometry.
√ √
∆U 3 · I (Rcosφ + X sinφ) 3 · I · ρ · L · cosφ
= ≈ (2)
Unom Unom A · Unom
In addition to these two requirements, the cable must be short enough for the service fuse to release if
there is an overcurrent. In case of a fault that creates a current higher than the fuse’s breaking current, the
fuse releases and protects the circuit from thermal and mechanical stress. The short circuit current should
be completely isolated within a specified time (often 5s). The let-through energy can be expressed as I 2t,
where I is the RMS short circuit current and t the breaking time [30]. This is however not a measure of the
energy, but of a quantity that is proportional to the energy transmission. Each cable can withstand a certain
level of high fault currents, expressed in k A2 s, and the fuse must be chosen so that its specific let-through
energy does not exceed the cable limits.
The high current regulations (Starkströmsföreskrifterna) states that a faulted facility must be discon-
nected rapidly from the grid [30]. To meet these requirements both the fuses and the cables must be
correctly dimensioned with respect to the highest as well as the lowest possible fault-current. It is the
lowest fault current that limits cable length. The lowest fault current in directly earthed systems occurs
when there is a 1-phase ground fault at the furthest distance from the fuse [30]. To ensure that the fuse
breaks within its given time the short circuit current Is must be at least the size of the fuse’s breaking
current Ib [30]:
I s ≥ k · Ib (3)
k is a tolerance factor. This is called the trigger condition. The short circuit current is described by
U
Is = (4)
z·L
where, in the case of a 1-phase earth fault, U is the phase-to-neutral voltage and z equals the combined
impedance of one phase and the cable neutral expressed in W/m. L is the distance from the fault to the
fuse. To assure that the fuse releases as it should, the following must hold [30]:
U U
Ln = ≤ (5)
Is · z k · Ib · z
The above equation is obtained by combining equation 3 and 4 and assumes that the short circuit power
at the start of the cable is infinite. Usually it is important to take into account also the impedance at the
19start, that consist of the impedances of the feeding grid (ZQ ), the transformer (ZT ) and, if applicable, the
feeder before the fuse (Z F ). The maximum allowed cable length is thus described as
ZQ + ZT + Z F
L max = L n (1 − ) (6)
Zmax
where Zmax equals the total cable impedance in W at length L n [30].
2.2 Electric buses
2.2.1 Energy supply and demand
Electric vehicles are driven by various types
of traction motors, such as the brush-less
DC motor, the switched reluctance motor and
the induction motor [32]. The engine effi-
ciency is around 25 % for regular combus-
tion engines while electric engines can op-
erate at efficiencies of 80-90 % [6]. The
energy demand of an electric bus depends
on many factors, such as speed, route dis-
tance, number of passengers (weight), temper- Figure 6: The energy demand of electric buses de-
ature, topography, road quality and driver be- pend on factors such as climate, speed and topog-
havior [31]. As shown in figure 6, the raphy. The graphics illustrates a consumption esti-
consumption varies between 0.8 kWh/km in mation made by Volvo, where the electric energy use
the best case to 2.82 kWh/km in the worst in best case is 0.8 kWh/km and in worst case 2.82
case. kWh/km [31].
The difference between the various types of electric buses (grid bounded, hybrid, fuel cell and battery
electric buses) is the electricity sources they use to power their motors [33]. Battery Electric Buses (BEB)
can be equipped with smaller batteries that are fully charged in 5-10 minutes or larger batteries that charges
over-night and lasts throughout the day [33]. Range is a limiting factor for electric vehicles since storing
energy in large long-lasting batteries increases the weight of the vehicle substantially [6]. Battery types
used in EV:s today are Lead-acid, Ni-Fe, Ni-Cd, NiMH (Nickel-Metal hydride), Sodium-metal chloride,
Na-S and various Lithium based [32].
A hybrid bus commonly combines an electric motor with a conventional internal combustion engine
(ICE). If the engines are connected in parallel the traction power can be delivered from both engines
simultaneously, or either of them separately. When series connection is used, the ICE functions as a
generator that provides electricity to the EM, sometimes via a battery [32]. Plug-in hybrid vehicles have
series connected motors, but also the ability to charge the battery through an external source, thus enabling
fully electric operation [33].
2.2.2 Charging of electric buses
Charging can take place either while the vehicle is moving or when it is at rest. Furthermore, energy can
be supplied to electric vehicles by means of conduction or by wireless coupling (Wireless power transfer,
WPT). Four main charging technologies can thus be identified; static conductive, dynamic conductive,
static wireless and dynamic wireless.
20International standards for electric bus charging are in the making and expected to be finalized by
ISO/IEC in 2020 but presently a broad variety of solutions can be seen throughout the world [34]. Because
of this uncertainty, bus manufacturers commonly produce buses that allows for the customer to specify
either conductive or wireless charging systems rather than focusing on one specific technology [35]. Sev-
eral European electric bus manufacturers (Irizar, Solaris, VDL and Volvo) are cooperating with charging
system developers (ABB, Siemens and Heliox) around a common charging interface [34].
Electric Road Systems (ERS) are roads that dynamically provides vehicles with power [36]. This
dynamic charging is a strategy that secures the range of an EV without relying on large energy storage
systems [36]. However, this type of charging requires a lot of infrastructure. Static and dynamic charging
can be combined by letting the vehicle drive outside the ERS on a combustion engine (hybrid vehicles) or
on electricity stored in batteries (fully electric vehicles) [36].
In cases where the bus is to be exclusively charged statically, there are several options on when to charge.
For city buses, opportunity charging has been identified as a suitable operational strategy [13, 37, 18].
It entails charging the bus during its scheduled idle time at a few stations along the route (usually end
stations). Frequent charging allows for a smaller battery to be used but it also requires high power, which
increases the price of the charger [38, 6, 39]. The alternative to opportunity charging would be slow
charging overnight of a large, long-lasting battery, fast charging at every bus stop along the route of a small
battery or battery swapping one or a few times a day [39]. A comparison made by Grauers et. al. [18]
shows that opportunity charging at end stations have a lower total cost than night charging and bus stop
charging (cost of battery, charger and electricity included).
A few other charging strategies has been proposed, for example charging fast and very frequent though
built-in structures on the road while storing the energy in super capacitors [40]. Musavi et. al. [38]
recommends a solution for public transport that consists of a few fast DC charging stations combined
with wireless chargers at bus stops or traffic lights. The choice of charging strategy depends on the route
distance as well as on project economy and available charing station area. For a more detailed analysis of
different charging methods the reader is referred to [39] and [18].
2.2.2.1 Conductive charging
During conductive charging energy is transferred to the vehicle from a voltage source through an electric
conductor. Dynamic conductive charging through overhead lines is a well-established technology used
for trains, trams and trolley buses. Electric trolley buses draw a current from overhead wires through
trolley poles as seen in Figure 7a [7]. The poles are dragged behind the vehicle and allow for lateral
and vertical movement, although disconnection sometimes occurs in sharp turns [41]. In their project
eHighway, Siemens together with Scania has developed an ERS concept for trucks connected to over-head
catenary wires that allows for higher speed than regular trolley buses [42]. Advantages of trolley buses
include low noise, no emissions, easy maintenance, similarity to diesel buses as well as the possibility to
operate on existing infrastructure [7].
In order to avoid the visual impact from overhead wires, solutions for ground-based charging systems
has been developed. Alstom is the largest supplier of catenary-free charging systems for trams. Their
Aesthetic Power Supply (APS) technology includes a third middle rail that provides electricity through
several current collector shoes mounted at the bottom of the tram [43]. Alstom and Volvo are both
participating in a project to implement the APS technology in an ERS that can power all sorts of vehicles
[36], see Figure 7b. Ground-based charging systems have the advantages of easy extension of the lines
and no overhead-wires but electric rails on the road might affect the safety of humans and animals due to
changed driver behavior, road friction and magnetic fields [43, 36].
21(a) (b)
Figure 7: (a) Electric buses connected through trolley poles are seen all over the world. This particular
one is operated in Vancouver, Canada. The overhead wire has two lines; one with a voltage of around
600-700 VDC and one at ground potential [41]. This is required since the vehicle is rubber tired and thus
not grounded. The control system of the trolley poles enables automatic connection to the catenary [7].
The connecting material in the trolley shoe is usually carbon-based, such as graphite [44]. Photograph
by Steve Morgan [45]. (b) Pilot ERS that uses APS technology developed by Alstom and trucks with
conductive pick-ups constructed by Volvo GTT. The truck is provided 750 VDC from ground-based rails
through the collector shoe at the rear of the vehicle [36]. Image from Volvo [46].
A pantograph is a current collect-
ing devise traditionally used to power
trains and trams. Today, the panto-
graph has been reused in static conduc-
tive fast charging stations for electrical
buses, as shown in figure 8a. Com-
panies that develop this technology are
ABB, Hybricon, Siemens and Proterra,
amongst others. The power provided by
these stations is in the range of 150- (a) (b)
1000 kW [49, 50, 51]. Both ABB and
Figure 8: (a) Station for high power opportunity-charging,
Siemens provide charging stations of 150
constructed by ABB. The system consists of a current col-
kW, 300 kW and 450kW DC, which en-
lector, a pantograph, that automatically connects to con-
ables a charging time of 4-6 minutes
tacts at the bus roof to provide the battery with 150 kw,
for a regular city bus [47, 50]. The
300 kW or 450 kW DC [47]. The utility AC power must
pantograph can be placed either on the
be rectified at the charging station. Image from ABB [47].
roof of the bus or at the station (re-
(b) Illustration of the SRS technology, a conductive ground-
versed pantograph). A pantograph at
based fast charging station developed by Alstom. The bus
each vehicle increases the system resilience
is supposed to charge in a few minutes while idling at a bus
but it adds weight and cost to the bus
stop. Image from Alstom [48].
[47].
In addition to the APS system, Alstom has also developed a static conductive ground-based fast charging
system for electric vehicles called SRS. The technology is very similar to APS but the idea is for trams and
buses to charge while idling at bus stops [48]. The charging concept is viewed in Figure 8b.
2.2.2.2 Wireless charging
Wireless power transfer can be divided into two categories; Inductive power transfer (IPT) and Resonant
power transfer (RPT) [52]. The two technologies are similar since they are both based on electromagnetic
coupling. Coupling can also be achieved using capacitors (Capacitive power transfer, CPT) but this so-
lution is only suitable at short distances [38]. For a more thorough review of different wireless charging
22technologies the reader is referred to [38].
In a wireless charging station, like the one outlined in figure 9, energy is transfered in the electromagnetic
field between a coil buried under ground, the track, and another coil in the vehicle, the pickup-coil [53]. In
order to achieve efficient energy transfer an AC current of high frequency is required (80-500 kHz) [35].
This is obtained by the use of high frequency inverters at the charging station. Power electronic devises in
the vehicle converts the AC current to DC before charging the battery, as seen in figure 9.
Figure 9: In a wireless charging station AC power from the distribution grid is converted to a higher
frequency before being transmitted from the connector under ground to the pick-up coil inside the vehicle.
In the vehicle the high frequency AC power is rectified and the battery charged. Controls in the charging
station as well as in the vehicle ensures the battery is fully charged.
Wireless charging poses many advantages over conventional conductive charging; it is convenient for
the user, there are no issues with charging in wet weather and the size and weight of the charger can be
reduced [38]. Other advantages of inductive charging are the low visual impact as well as the possibility
to use the same standard for all types of vehicles [35]. The grid interaction is a major drawback as well as
the cost and safety issues concerning human exposure to high frequency radiation [35]. In addition, the
power transfer efficiency is sensitive to misalignment [53]
Several pilot projects with static inductive charging of buses is or has been conducted; Scania (Sweden,
2016), Flaunder DRIVE (Belgium, 2011), City of Den Bosch (Netherlands, 2012), Bombardier (Germany,
2013), Dong Won Olev (South Korea, 2013) and Wrightbus (UK, 2014) to mention a few [9, 35]. As
of 2014 there were seven companies providing inductive charging systems worldwide, Bombardier and
Conductix-Wampfler being the only two with solutions for buses. Examples of companies producing buses
with inductive charging systems are VCL (Netherlands), BYD (China), VanHool (Belgium) and Solaris
(Poland) [35].
2.2.3 Grid connection
The grid connection is an important difference between conductive and inductive charging stations. While
regular conductive charging points are located at the grid connection point, inductive charging points are
separated from the grid connecting point since the coils are placed under ground [35]. Underground grid
connection is being investigated to avoid separate installation [35].
Loads that use power electronics, such as chargers for electric buses, have a dynamic behavior. The
internal control systems in the power electronic devises will make sure a constant power is supplied to the
charger, which leads to increased current if the voltage drops. Locations in the grid with a lot of power
electronics therefore have a higher risk of developing resonance issues. [54]. Lindberg [15] concludes that
the fast charging stations for electric buses in Umeå emits harmonics that might affect the voltage quality
for nearby customers.
A simplified image of the grid connection of a reversed pantograph fast charging station is shown in
figure 10. The system consists of the primary substation, the 10/0.4 kV substation, service cables, the
charging station with its rectifier and pantograph and the bus containing a battery. In addition, there are
23You can also read