Energy support measures and their impact on innovation in the renewable energy sector in Europe - EEA Technical report No 21/2014 - European ...
←
→
Page content transcription
If your browser does not render page correctly, please read the page content below

EEA Technical report    No 21/2014

      Energy support measures and their impact on
innovation in the renewable energy sector in Europe

                                                      ISSN 1725-2237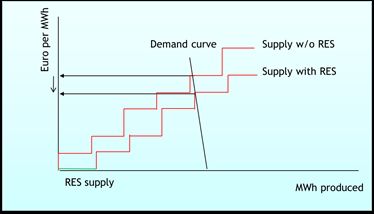
EEA Technical report   No 21/2014

      Energy support measures and their impact on
innovation in the renewable energy sector in Europe
Cover design: EEA Cover photo: © olm26250/istockphoto.com Layout: EEA/Rosendahls – Schultz Grafisk A/S Legal notice The contents of this publication do not necessarily reflect the official opinions of the European Commission or other institutions of the European Union. Neither the European Environment Agency nor any person or company acting on behalf of the Agency is responsible for the use that may be made of the information contained in this report. Copyright notice © European Environment Agency, 2014 Reproduction is authorised, provided the source is acknowledged, save where otherwise stated. Information about the European Union is available on the Internet. It can be accessed through the Europa server (www.europa.eu). Luxembourg: Publications Office of the European Union, 2014 ISBN 978-92-9213-507-2 ISSN 1725-2237 doi:10.2800/25755 European Environment Agency Kongens Nytorv 6 1050 Copenhagen K Denmark Tel.: + 45 33 36 71 00 Fax: + 45 33 36 71 99 Web: eea.europa.eu Enquiries: eea.europa.eu/enquiries
Contents

   Contents

   Acknowledgements..................................................................................................... 5

   Executive summary..................................................................................................... 8

   1 Introduction......................................................................................................... 10
     1.1 General background......................................................................................... 10
     1.2 EU policy context............................................................................................. 11
     1.3	Overview of selected energy indicators in EEA countries........................................ 12
     1.4 The scope....................................................................................................... 14
     1.5 Outline of the report........................................................................................ 14

   2 Energy support measures in EEA countries and innovation
     in the renewable sector........................................................................................ 15
     2.1 General overview of energy support measures in 32 EEA countries......................... 15
     2.2 Overview of renewable energy support............................................................... 17
     2.3 Overview of fossil fuel and nuclear support.......................................................... 20
     2.4 Energy support measures and progress towards innovation in the
          renewable energy sector................................................................................... 22
     2.5 Conclusions..................................................................................................... 30

   3 Energy support measures and their effect on innovation:
     national perspectives........................................................................................... 34
     3.1 Introduction................................................................................................. 34
     3.2 Key characteristics of the energy sector and support schemes in the target
          countries........................................................................................................ 34
     3.3 Quantitative overview of energy support in the target countries............................. 35
     3.4 Assessment of the effectiveness and efficiency of instruments of
          renewable energy support................................................................................. 37
     3.5 Innovation and employment benefits from renewable energy support..................... 41
     3.6 Policy coherence.............................................................................................. 45
     3.7 Conclusions..................................................................................................... 45

   4 Methodology......................................................................................................... 47
     4.1 Introduction.................................................................................................... 47
     4.2 Concepts applied in this report.......................................................................... 47
     4.3 Energy support measures defined...................................................................... 48
     4.4 Types of energy support measures identified in this study..................................... 49
     4.5 Time horizon................................................................................................... 49
     4.6 Types of support measures not included in the inventory or the quantitative
         analysis.......................................................................................................... 49
     4.7 Data sources................................................................................................... 51
     4.8 The merit order effect of renewable energy......................................................... 51

Energy support measures and their impact on innovation in the renewable energy sector in Europe                                  3
Contents
References................................................................................................................ 53
Acronyms.................................................................................................................. 57
Annex 1 Definitions for energy support in literature................................................. 58
Annex 2 Types of support measures included in the inventory
underpinning the analysis in this report...................................................... 60
Annex 3 Data and methodological challenges............................................................ 64
4 Energy support measures and their impact on innovation in the renewable energy sector in EuropeAcknowledgements
Acknowledgements
This report was prepared by the European The report benefited greatly from input received
Environment Agency (EEA) and a consortium led by members of the advisory group: Ronald
by CE Delft. Steenblik (OECD), Ivo Schmidt (DG Energy),
Tom Howes (DG Energy), Manfred Rosenstock
The following experts from the consortium (DG Environment), Malgorzata Kicia (DG
contributed to this report: Sander de Bruyn Environment), Jerzy Pienkowski (DG Economic
(CE Delft), Raphael Sauter (Institute for European and Financial Affairs), Francesco Ferioli
Environmental Policy (IEEP)) and Geert Warringa (DG Competition), Peter Novak (Energotech
(CE Delft), with support from Martine Smit Engineering), Renato Marra Campanale (Institute
(CE Delft), Martijn Blom (CE Delft), Axel Volkery for Environmental Protection and Research
(IEEP), Dorien Bennink (CE Delft), Maarten (ISPRA)), Vladimir Vlk (Enterpriser, Czech
Afman (CE Delft), Milan Scasny (CUEC Prague), Republic), Thomas Bettler (Bundesamt für Umwelt
Agnieszka Markowska and Marisa Korteland BAFU, Switzerland) and Ioannis Economides
(CE Delt). (Ministry of Commerce, Industry and Tourism,
Cyprus)
The following experts from the EEA contributed to
the report: Anca-Diana Barbu, Johannes Schilling EEA support for the preparation of this report was
and Mihai Tomescu. provided by Paul McAleavey, John Van Aardenne,
Jock Martin, Stefan Ulrich Speck and Johannes
Overall coordination of the report was carried out Schilling.
by Anca-Diana Barbu (EEA) and Sander de Bruyn
(CE Delft). The EEA also acknowledges comments received
on the draft report from the national focal points
The authors would like to thank the four countries and experts of EEA member countries, and from
participating in the case studies (the Czech the European Commission and its Joint Research
Republic, the Netherlands, Spain and Switzerland) Centre (JRC). These comments were included in the
for their valuable contribution to this work. report as far as was practically feasible.
Energy support measures and their impact on innovation in the renewable energy sector in Europe 5Executive summary
Executive summary
Governments support energy production and The main purpose of this analysis is to highlight
consumption in order to meet social, economic the part specific country circumstances play in the
and environmental objectives, and they have been development of the renewable sector, by exploring
doing so for decades. In times of economic crisis, related policy effectiveness and policy efficiency,
public budgets and household incomes come as well as developments in the renewable sector in
under pressure. At the same time, countries need terms of innovation and employment. Coherence
to kick‑start their economies by creating new between policy objectives within relevant policy
employment opportunities in emerging industries domains is also important, and is briefly addressed
such as the renewable sector. This report examines for these four countries.
the support allocated to energy production and
consumption in Europe and its impact on innovation The main findings of the report are summarised
in renewable energy. below.
The study provides an overview, at European level, Despite growing interest in promoting renewable
of the type of measures in place in 2012 to support energy, in 2012 many support measures in Europe
energy consumption and production in 32 EEA targeting fossil fuels and nuclear sectors were still
countries. For four countries, a quantitative analysis in place, and continued to affect public budgets.
is undertaken as well.
Fossil fuel support in Europe is expressed
Progress towards innovation in the renewable sector mainly through fiscal exemptions to support the
is assessed using the number of patent applications consumption of these fuels in certain economic
to the European Patent Office (EPO) for various sectors. They constitute a burden on public budgets,
renewable energy technologies. The report explores because they are revenue forgone by governments.
the link between support measures for renewable
energy and employment effects in two of the most Renewable support is a mix of surcharges on the
developed renewable sectors in Europe, namely energy bill of the end users, and governmental
wind and solar photovoltaics (PV) as well. support. In the case of electricity, the former type of
support prevails. Consequently, such support does
The discussion is enhanced by an in‑depth analysis not represent a burden on public budgets, but it
at national level of the situation in four European does affect energy prices for end users, particularly
countries: the Czech Republic, the Netherlands, when the merit order effect is not passed on to
Spain and Switzerland. them.
These countries were selected using seven criteria: Support for the nuclear industry is poorly
documented, but it has existed for decades in
• in 2012, countries had to have in place feed-in Europe in various forms, including explicit or
tariffs/premiums to support renewable energy; implicit limited liability in case of major accidents,
• geographical coverage; grants and government-mediated financing and
• different progress towards the 2020 renewable regulated prices. Despite being difficult to quantify,
targets; this support can place a significant burden on the
• different innovation performance based on the public budget.
Innovation Union Scorecard 2013;
• different economic structure; Support for fossil fuels affects market conditions
• different energy mix; for renewable energy, but there is little evidence
• different drivers for renewable development that the impact is significant, given the support
(EU and non-EU countries). allocated to the renewable sector.
8 Energy support measures and their impact on innovation in the renewable energy sector in EuropeExecutive summary
Countries' strategies differ when it comes to should be revisited in light of recent technological
supporting fossil fuels, so the renewable sector price developments, economic developments
must compete with a unique price structure for and knowledge gained on the environmental
these fuels in each country. A more harmonised consequences of various renewable technologies.
framework for energy taxation would be a good This seems to be particularly relevant for biomass.
start for facilitating further developments in the
renewable sector. Renewable policy design has a significant impact
on policy effectiveness and efficiency. Policy
Countries with a higher effective tax rate on carbon flexibility in managing rapid and significant cost
dioxide (CO2) generally have a higher rate of patent reductions of these technologies and the way the
applications in renewable technologies. policy's cost is contained over time determines
not only how effective the policy is in achieving
Several factors are crucial for the innovation the set goal, but also at what cost this occurs. For
process in the renewable sector: political will example, Spain's long-term policy objectives and
(or the lack thereof) to shift the focus onto effective policy resulted in a sizeable domestic
the renewable sector, pre-existing innovation renewable sector. However, this development was
capabilities, the level of investment in research and achieved at relatively high policy costs with annual
development (R&D) for renewable technologies feed‑in premium (FIP)/feed-in tariff (FIT) payments
and renewable policy design. This has been of around EUR 5 billion in 2011. By comparison,
observed in developments in Denmark as well as the Swiss annual FIT payments were around
in the four target countries (the Czech Republic, EUR 0.074 billion in 2011, albeit for a much less
the Netherlands, Spain and Switzerland). impressive deployment of these resources.
The four target countries focus on a few key and The strong focus on the market-pull policy type
mature renewable technologies such as onshore helped the innovation process in renewables, and
wind, solar PV, hydro and biomass. All three generated some 2.2 million full-time equivalent
EU Member States need to step up efforts to jobs in Europe. However, a more balanced mix of
boost policy effectiveness and policy efficiency, market-pull and technological-push instruments
especially in those technologies considered to be (e.g. R&D investment), accompanied by greater
key for meeting the 2020 targets in their respective attention to the quality of jobs created, will ensure
National Renewable Energy Action Plans (NREAPs). the development of a more sustainable renewable
Across all three EU Member States, biomass energy industry in Europe.
developments are consistently behind the respective
technology‑specific targets included in the NREAPs. If the renewable sector is to make a significant
All four countries need to increase efforts in the contribution to climate goals, energy security goals
renewable heating and cooling sector. and more generally, green economic growth, policy
objectives, particularly in the area of renewable
Experiences of the three EU Member States energy, industry, economy and R&D, must be
studied in this report suggest that the NREAPs carefully designed, aligned and implemented.
Energy support measures and their impact on innovation in the renewable energy sector in Europe 9Introduction
1 Introduction
1.1 General background interdependent industries and users intensify the
technological lock-in on conventional technologies.
Governments support energy production and Consequently, renewable energy technologies must
consumption in order to meet social, economic and compete with the incumbent technologies in the
environmental objectives, and they have been doing current market place, not only as regards price, but
so for decades. A recent study authorised by the also at institutional level.
European Commission (Ecofys, 2014) estimates that
the direct historic support to energy technologies In fact, all these interactions have hampered
that still has an impact today amounts to somewhere progress towards sustainable energy, worldwide.
between EUR2012 3 billion and EUR2012 15 billion. The International Energy Agency's recent
publication, World Energy Outlook 2013 (IEA, 2013),
Government intervention can be useful and clearly sends this message.
effective in helping meet policy objectives, if it is
well designed. However, a recent study (Ecofys and On the other hand, innovation in and deployment
CE Delft, 2011) shows that because of governmental of renewable energy may be viewed as an important
interventions in the energy markets, a level playing driver in shaping the future of our economic
field does not exist between energy carriers and systems, as emphasised in concepts like green
technologies for energy production. Moreover, growth (OECD, 2009) or the circular economy (Ellen
although it should be possible to adapt such McArthur Foundation, 2012) (1). Nowadays, the
support over time to account for market changes, renewable energy industry in Europe provides more
technological development or societal change, this than 2.2 million full-time equivalent jobs, according
has proven cumbersome in reality. to one source (EurObserv'ER, 2013).
Revisiting the support allocated to energy sources Recently, several reports have looked into the
is also necessary because of the economic crisis, question of energy support. For example, Support
which affected not only public budgets but also the and costs of EU energy (Ecofys, 2014) provides
income levels of many households in Europe. This an overall picture of energy costs (including
has triggered debates on the need to optimise public external costs) and quantifies the extent of public
expenditure, with some actors choosing to place interventions in the energy market, using the
more emphasis (with negative connotations) on the levelised cost of energy (LCOE) approach. Another
high capital cost of renewable energy. report, Cost effectiveness of support to electricity — An
assessment of economic efficiency (EC, forthcoming)
The debate tends to overlook the fact that existing examines the economic efficiency of support
support to conventional energy sources goes well to electricity generation. The report evaluates
beyond direct support and tax exemptions. For support to new PV, wind, combined-cycle gas
example, past government support for R&D and turbine (CCGT), coal and nuclear plants in five
infrastructures created large production capacity countries (the Czech Republic, Germany, Italy,
and distribution networks for the now-incumbent Poland and Spain), likewise using the levelised cost
technologies (fossil fuel and nuclear), which can of electricity and the levelised revenues of electricity
afford lower unit prices for energy production due concepts. A third report, Getting energy prices
to economies of scale. Systemic relations developed right (IMF, 2014) published by the International
over time between technologies, infrastructures, Monetary Fund (IMF), proposes a methodology and
(1) On 1 July 2014, the European Commission issued the communication Towards a circular economy: A zero waste programme for
Europe (COM(2014)398 final). In this communication, the concept of circular economy is centred around waste and the recycling of
materials, including in buildings (COM(2014) 445).
10 Energy support measures and their impact on innovation in the renewable energy sector in EuropeIntroduction
associated tools to adjust fiscal instruments so as changes in energy technologies, carbon prices and
to reflect environmental damage. All three reports networks.
hold a different perspective on energy support
and provide different geographical coverage. This In January 2014, the European Commission agreed
report offers yet another perspective, namely the on A policy framework for climate and energy in the
impact of energy support on innovation. The report period from 2020 to 2030 (EC, 2014a). The framework
builds on four case studies (the Czech Republic, seeks to drive continued progress towards a
the Netherlands, Spain and Switzerland) for which low‑carbon economy by setting new targets for
existing expenditure data have been collected and GHG emissions reductions (40 %) and renewable
analysed. Further details on the scope and the energy (at least 27 %). In addition, the framework
methodologies involved are presented in subsequent includes a proposal to reform the EU emission
chapters. trading system (EU ETS), a set of key indicators
to assess progress in achieving an internal energy
market that delivers energy securely and at
1.2 EU policy context competitive prices, and a proposal to reform the
energy governance system based on energy plans
In order to spur sustained investment in renewable developed by the Member States. To complete the
energy, a clear, long-term policy perspective is framework, the Communication on Energy Efficiency
necessary. This section gives a brief overview of and its contribution to energy security and the 2030
the most relevant and recent EU policy frameworks Framework for climate and energy policy (EC, 2014b)
that may impact innovation in and deployment of proposed a 30 % improvement in energy efficiency
renewable energy technologies. by 2030. On 23 October, the Council adopted the
2030 framework. Compared to the EC proposal, the
The Roadmap for moving to a competitive low-carbon target for energy efficiency has been changed to 'at
economy in 2050 (EC, 2011a) suggests that, by least 27 %' (EC, 2014c).
2050, the EU should cut its greenhouse gas (GHG)
emissions to 80 % below 1990 levels through In addition to these climate and energy policy
domestic reductions alone. It sets out indicative framework documents, specific communications
milestones: a reduction of 40 % by 2030 and of 60 % related to the internal energy market and
by 2040. The communication also shows how the competition issues have been published and are
main sectors responsible for Europe's levels of GHG relevant to the topic discussed in this report.
emissions (power generation, industry, transport,
buildings and construction and agriculture) can On 5 November 2013, the Commission published
make the transition to a low-carbon economy the communication Delivering the internal electricity
cost-effectively. For the electricity sector, the market and making the most of public intervention
roadmap envisages that the sector will effectively (EC, 2013a), which includes guidelines for Member
be decarbonised by 2050, relying entirely on States on designing and reforming national support
'low‑carbon technologies'. schemes for renewable energy, designing capacity
mechanisms to ensure continuous supply of
The Energy Roadmap 2050 (EC, 2011b) explores electricity and enhancing the role of consumers.
the challenge of meeting the EU's decarbonisation
objective while at the same time ensuring security On April 2014, the European Commission adopted
of energy supply and competitiveness. All scenarios the new Guidelines on State aid for environmental
analysed (illustrative in nature) (2) imply major protection and energy 2014–2020 (EC, 2014d).
(2) The communication includes five different scenarios.
• High energy efficiency (i.e. political commitment to very high energy savings) includes such measures as more stringent
minimum requirements for appliances and new buildings, high renovation rates of existing buildings, and establishing energy
savings obligations on energy utilities. This would lead to a decrease in energy demand of 41 % by 2050 as compared to the
peaks in 2005 and 2006.
• Diversified supply technologies (i.e. no technology is preferred — all energy sources can compete on a market basis with no
specific support measures) have decarbonisation driven by carbon pricing, assuming public acceptance of both nuclear and
carbon capture and storage (CCS).
• High renewable energy sources (RES): strong support measures for RES, leading to a very high share of RES in gross final
energy consumption (75 % in 2050) and a share of RES in electricity consumption, reaching 97 %.
• Delayed CCS: similar to the diversified supply technologies scenario, but it is assumed that CCS is delayed, leading to higher
shares for nuclear energy, with decarbonisation driven by carbon prices rather than by a technology push.
• Low nuclear: similar to the diversified supply technologies scenario, but it is assumed that no new nuclear sources (besides reactors
currently under construction) are being built, resulting in a higher penetration of CCS (around 32 % in power generation).
Energy support measures and their impact on innovation in the renewable energy sector in Europe 11Introduction
The guidelines apply as of 1 July 2014 for new mechanisms such as premiums, i.e. a top-up on
installations only, and Member States are required the market price or tradable certificates);
to amend their national aid schemes for energy • a requirement that renewable energy generators
and environment by no later than 1 January 2016. be subject to balancing responsibilities;
Renewable energy schemes need to be brought in • a gradual introduction of competitive bidding
line with the guidelines only if they are prolonged practices for public support.
or adapted. Among other things, the guidelines aim
to support Member States in reaching their 2020 The findings in this report illuminate further the
climate targets, while addressing market distortions recommendations in these latter communications (3).
that may result from support granted to renewable
energy sources.
1.3 Overview of selected energy
Issues to be considered include: indicators in EEA countries (4)
• shifting towards market-based approaches In 2012 in the EU-28, the share of fossil fuels in
only (as of 2016, public support should only primary energy consumption (5) was 73.9 % down,
be provided in the form of market-oriented from 82.1 % in 1990. The share of renewable energy
Figure 1.1 Primary energy consumption by fuel, EU-28, 1990–2012
Million tonnes of oil equivalent
2 000
1 800
1 600
1 400
1 200
1 000
800
600
400
200
0
90
91
92
93
94
95
96
97
98
99
12
0
01
02
03
4
05
06
07
08
09
10
11
0
0
19
19
19
19
19
19
19
19
19
19
20
20
20
20
20
20
20
20
20
20
20
20
20
Solid fuels Total petroleum products Gas Nuclear heat Renewable energies Other
Source: EEA (2013–ENER26 database based on Eurostat).
(3) This project started early in 2013, before the publication of the communications Guidelines on State aid for environmental
protection and energy 2014–2020 and Delivering the internal electricity market and making the most of public intervention.
However, their recommendations are discussed where relevant throughout the report.
(4) This project started early in 2013. At that time, 2012 data were not available, so the data and indicators calculated in subsequent
chapters will have 2011 instead of 2012 data. For updated information, please http://www.eea.europa.eu/data-and-maps/
indicators#c5=&c7=all&c0=10&b_start=0. Updating the data to reflect 2012 in subsequent chapters would not change the main
messages of the report.
(5) Here, primary energy consumption is calculated as gross inland energy consumption minus non-energy use.
12 Energy support measures and their impact on innovation in the renewable energy sector in EuropeIntroduction
more than doubled, from around 4.5 % in 1990, exceeded both their indicative 2011 to 2012 RED
to 11.6 % in 2012. The share of nuclear energy targets and their expected 2012 targets established
increased, from around 13.1 % in 1990, to 14.4 % in under the NREAP. The United Kingdom had
2012 (see Figure 1.1). exceeded its 2012 NREAP target, and was just
about in compliance with its 2011 to 2012 RED
In 2012, 22 Member States (Belgium, Bulgaria, target. Iceland and Norway were considered to
Cyprus, the Czech Republic, Denmark, Germany, be on track to meet their RES targets established
Estonia, Greece, Croatia, Italy, Latvia, Lithuania, under the European Economic Area Agreement
Luxembourg, Hungary, Austria, Poland, Romania, (see Figure 1.2). Three Member States (Ireland,
Slovenia, Slovakia, Finland, Sweden and the United Portugal and Spain) had reached or exceeded their
Kingdom) were considered to be on track to meet indicative RED targets for 2011 to 2012, but were
their RES targets established under Directive below their 2012 NREAP target.
2009/28/EC of the European Parliament and of the
Council of 23 April 2009 on the promotion of the use Three Member States (France, Malta and the
of energy from renewable sources and amending Netherlands) were not on track towards their RES
and subsequently repealing Directives 2001/77/EC targets. In 2012, these countries had reached neither
and 2003/30/EC (known as the Renewable Energy their indicative RED target nor their NREAP targets
Directive (RED)) (EC, 2009). These countries had (EEA, 2013a (6)).
Figure 1.2 Share of RES in final energy consumption in EEA countries, and RES targets
RES share in gross final energy consumption (%)
90
80
70
60
50
40
30
20
10
0
– 10
G ria
lg n
e
Es nia
un a
Be tia
m y
th ia
Fi nia
ov d
m y
Cr rk
ov m
La ia
ec erm ia
pu y
Cy lic
Au us
U ux Pol a
te m nd
ng rg
Ir m
Fr nd
et Sp e
he ain
M ds
rt *
al
EU
ay
d
l
en r
Re an
ec
c
H aki
ri
Sl an
an
Bu de
Ro ta
Li ton
en
Cz G tv
ug
Sl iu
do
Po lta
D ga
a
Ki u
b
an
n
pr
w
ni e a
a
oa
a
st
a
ua
d bo
re
rla
e
nl
el
el
I
lg
or
a
Sw
Ic
N
h
N
L
Average 2011–2012 RES share Gap to 2011-2012 RED target 2011–2012 RED indicative target 2020 target
Note: The 2020 targets are set in the RED. In accordance with the accounting rules in the RED, electricity generated by hydro and
wind were normalised for annual variations (hydro for 15 years, and wind for 5 years). The Short Assessment of Renewable
Energy Sources (SHARES) manual provided by Eurostat contains details on the normalisation rule: please see http://epp.
eurostat.ec.europa.eu/portal/page/portal/energy/other_documents.
The targets for Iceland and Norway are part of Annex IV to the EEA Agreement.
* Data are estimated by Eurostat, based on the national data transmission under Regulation (EC) No 1099/2008 of 22
October 2008 on energy statistics.
Source: Eurostat SHARES Results, 2012; Eurostat, 2014; EEA, 2014.
(6) For an update, please check EEA, 2014.
Energy support measures and their impact on innovation in the renewable energy sector in Europe 13Introduction
1.4 The scope 1.5 Outline of the report
The main aim of the report is to provide a balanced Chapter 1 contains background information and the
discussion on various forms of support for all scope of the report.
energy sources currently applied in Europe, and
their role in fostering (or not fostering) innovation in Chapter 2 includes an overview of support measures
the renewable energy sector. for energy production and consumption in 32
EEA countries for all energy sources (conventional
The report provides the following: fossil fuels, renewables and nuclear), split between
different commodities (electricity and heat) and
• A discussion of the forms of support to all energy users. Furthermore, this chapter explores various
sources applicable in 32 EEA countries (7) from aspects of the innovation process in the renewable
2005 to 2012, based on an inventory of support sector, including the impact of support measures on
measures (8). From this inventory, individual this process.
country fiches were generated, summarising the
support measures in place in 2012 in each of the Chapter 3 contains an analysis of factors that could
32 EEA countries (published separately from the influence the development of a robust innovation
report). process in the energy sector, developed around
• An analysis of factors that could influence the the renewables sector in Europe, given the specific
development of a robust innovation process in national context. This analysis is based on detailed
the energy sector developed around renewables case studies elaborated for the Czech Republic, the
in Europe, given the specific national context. Netherlands, Spain and Switzerland (published
This discussion is enriched with information separately from this report).
from detailed case studies in four selected
countries (the Czech Republic, the Netherlands, Chapter 4 contains details on methodologies
Spain and Switzerland). employed in this report, including definitions of
energy support measures and data sources.
(7) Croatia was not an EEA Member when this project was initiated, and therefore was not included in the analysis.
(8) A quantification of the support measures for all 32 countries covered was beyond the scope of this project, due to budget
constraints. However, for the four target countries (the Czech Republic, the Netherlands, Spain and Switzerland), a quantification
of existing support is provided. The inventory takes into account the point of impact of the support measure, in line with principles
applied by the Organisation for Economic Cooperation and Development (OECD).
14 Energy support measures and their impact on innovation in the renewable energy sector in EuropeEnergy support measures in EEA countries and innovation in the renewable sector
2 Energy support measures in EEA
countries and innovation in the
renewable sector
This chapter contains a qualitative overview As seen in Figure 2.1, in 2012, EEA countries had
(numeric analysis) of energy support measures in in place more measures to support fossil fuels and
place in 32 EEA countries in 2012. nuclear than to support renewable energy. This is
(partly) owing to the desire to keep certain economic
It also investigates various aspects of the innovation sectors competitive. The communication Roadmap
process in the renewable sector, and the impact the to a Resource Efficient Europe (EC, 2011c) calls for
energy support measures may have had on it from environmentally harmful support (EHS) to be
2005 to 2011/2012 for the majority of the 32 EEA phased out by 2020 'with due regard to the impact
countries. Additional analysis of relevant issues on people in need'. For a successful reform of EHS,
at national level is provided in Chapter 3, based simultaneous reforms are needed in the sectors
on detailed case studies elaborated for the Czech involved.
Republic, the Netherlands, Spain and Switzerland.
Table 2.1 shows how the 582 identified support
measures are distributed between renewables,
2.1 General overview of energy support
measures in 32 EEA countries
Figure 2.1 Distribution of energy support
In total, 582 support measures have been identified measures, 2012, EEA-32
that were in place in 2012 in the 32 EEA countries.
Figure 2.1 provides an overview of these support 6.2 %
measures. Of the total 582 measures, 310 are Support targetting renewables
associated with fossil fuels, and 236 with renewable 40.5 %
energy (including biofuels), representing 40.5 % Support targetting fossil fuels
and nuclear
of the identified support measures. About 6 % of 53.3 %
the identified support measures were targeted at General electricity and heat
support
electricity and/or heat production and consumption,
and therefore did not alter the competitive situation
between renewables and fossil fuels. Source: EEA.
Table 2.1 Energy support measures, by energy carrier and technology, 2012, EEA-32
Fossil Nuclear Renewables Electricity Biofuels Total
fuels and heat
Direct subsidy 47 3 111 14 3 178
Fiscal exemptions 245 0 28 17 28 318
Non-financial measures 4.5 0 34 2 22.5 63
Other financial measures 1.5 1 8 2.5 0 13
Transfer of risk to government 3 5 2 0 0 10
Total 301 9 183 36 53 582
Note: Some measures were split among various energy carriers. In order to avoid double-counting, individual measures benefitting
both petrol and biofuels, for example, have been split between both energy carriers equally (9). Because of this weighting
factor applied for measures that span across various energy carriers or energy technologies, Table 2.1 includes figures with
one decimal.
(9) In other words, no attempt has been made to weight the importance of a particular measure for one energy carrier over another,
and hence all energy carriers for which the measure applies have been treated equally.
Energy support measures and their impact on innovation in the renewable energy sector in Europe 15Energy support measures in EEA countries and innovation in the renewable sector
conventional fossil fuels and nuclear. Fiscal In Belgium, the high number of measures is
exemptions appear to be the dominant form of attributable to the fact that different support
energy support, especially for conventional fossil measures for renewable energy are in place across
fuels, while renewable energy (excluding biofuels) different regions of Belgium.
appears to be mostly stimulated by direct monetary
transfers. Relatively few measures concerning Despite the larger number of measures being
transfer of risk to governments are included. This allocated to the conventional fossil fuels and nuclear,
is attributable more to the inadequate reporting of some countries chose to invest more in R&D for
such measures than to these measures being a rare renewable technologies.
occurrence (see Annex 2, for a detailed discussion).
Figure 2.3 shows the amount of EUR2012/capita spent
Even though EEA-32 countries appear to provide on R&D in energy technologies over the period
more support measures to conventional fossil fuels from 2005 to 2011 in selected EEA countries. It
and nuclear than to renewable energy, there is a is indicative of the direction countries may take
big difference between countries with respect to the concerning innovation in energy systems.
overall distribution (see the discussion in Chapter 3).
There are significant differences between countries
Figure 2.2 shows the number and distribution of concerning R&D support. Denmark has the highest
support measures for conventional fossil fuels, amount of R&D support, amounting to almost
nuclear and renewables in EEA-32 countries. EUR 70/capita from 2005 to 2011, while Greece,
Figure 2.2 Distribution of energy support measures between fossil fuels and renewables,
EEA‑32, 2012
Number of support measures
20
18
16
14
12
10
8
6
4
2
0
Fr ay
Sw ce
ec e en
te ep ny
ng c
Sl om
La kia
Tu ia
Es y
m ia
ia
he nd
Po ds
ov al
Ic nia
Sp d
Au in
Po ia
H and
lg y
m ia
itz urg
th rk
M a
Cy ta
lg s
m
ec Ire nd
en nd
G in
en ce
y
Be ru
Ki bli
e
Bu gar
al
ni
an
tv
Ro n
an
Sl ug
r
xe ar
a
e
iu
al
a
an
e
n
rk
w
a
Cz G ed
et nla
la
ht la
st
a
It
st
to
e
ua
d
p
m
Sw bo
u
re
rla
U h R rm
el
l
or
ov
rt
er
un
F i
N
Li
D
d
Lu
N
Li
ni
Fossil fuel and nuclear support Renewables (incl. biofuels) support
Note: The figure is based on 546 out of 582 support measures, excluding generic electricity and heat support. This figure does not
include all the additional measures from the IEA database on R&D expenditure as shown in Figure 2.3 because there was
no information about the nature of these measures and consequently they could not be allocated to specific energy carriers,
energy technologies or users. Here, only those R&D measures that were included in the OECD and RES-Legal databases are
included.
16 Energy support measures and their impact on innovation in the renewable energy sector in EuropeEnergy support measures in EEA countries and innovation in the renewable sector
Figure 2.3 Public R&D expenditure on energy technologies, selected EEA countries, 2005–2011
(EUR2012 per capita)
R&D budgets EUR2012 per capita 2005–2011
80
70
60
50
40
30
20
10
0
k
nd
ay
ia
ce
d
y
m
y
n
ia
nd
en
ds
ry
m
al
ic
ey
e
nd
ar
an
al
ec
an
ai
bl
tr
ak
ug
do
iu
ga
an
an
rk
la
la
w
ed
la
It
Sp
m
pu
re
us
rm
lg
el
ov
or
rt
Po
er
Tu
n
un
ng
rl
Fr
w
en
G
Ir
Be
Fi
A
Re
Po
he
N
itz
Sl
e
S
H
Ki
D
G
w
et
h
d
ec
S
N
te
Cz
ni
U
Wind Solar Other renewables Geothermal Biofuels Nuclear Fossil fuels
Note: his figure is based on the IEA database and may contain additional measures compared to those already in the OECD and
T
RES-Legal databases considered in the inventory for this project. The reason why some of the data from the IEA database
could not be captured in the inventory is that this project includes only those measures that are clearly specified in the
national legislation have been included while the IEA database may include other forms of support such as public support
to research institutes, etc. This figure shows that many more countries allocate public budgets for R&D, compared to those
included in the two databases considered for this project.
Source: EEA, based on IEA (2013) for R&D budgets, Eurostat (2013) for population.
Poland and Turkey have almost no R&D support mainly takes the form of tax exemptions associated
for energy technologies. This may also explain why with the use of energy from renewable sources.
Denmark seems to be the outlier in the analysis However, there are relatively few of these types of
presented in Section 2.4 (see also Box 2.1 for further measures.
explanations).
In terms of the types of instruments, direct support
is the dominant form of support in Austria,
2.2 Overview of renewable energy Cyprus, Estonia, Finland, Iceland and Romania.
support Tax instruments are relatively important in Latvia,
Lithuania, Luxembourg, Malta, the Netherlands,
Renewable energy support in Europe is mainly Spain, Sweden and Switzerland. Most countries have
allocated to the production of renewable energy implemented a form of FITs and/or FIPs. FITs are
(see Figure 2.4). It spans different types of relatively more important than FIPs in the 32 EEA
instruments (see Figure 2.5). Overall, Belgium, Italy, countries. Belgium, Iceland, Norway, Poland,
Lithuania and the Netherlands have the highest Romania and Sweden do not use FITs or FIPs to
number of instruments in place for renewable support renewable energy, but rather a quota system
energy support. In Italy, the system changed in instead. The United Kingdom uses a combination of
2013, and a number of old support measures were FITs, a quota obligation and tax regulation to support
replaced by a system of pre-auctioned FITs. renewable energy (see Figure 2.5).
More than 60 % of renewable support measures At the time of writing this report (2013–2014),
are oriented towards production directly. Some most countries used a system of FITs/FIPs. The EC
countries, notably Belgium, Bulgaria, Estonia and communication Delivering the internal electricity
Switzerland also have some policies in place related market and making the most of public intervention
to the consumption of renewable energies. This (EC, 2013a) calls for phasing out the FITs by 2016.
Energy support measures and their impact on innovation in the renewable energy sector in Europe 17Energy support measures in EEA countries and innovation in the renewable sector
Figure 2.4 Point of incidence of renewable measures (excluding biofuels), EEA-32, 2012 (10)
Number of measures
16
14
12
10
8
6
4
2
0
Be ria
Lu thu in
m ia
g
Bu um
rl a
N nds
Po ay
rt d
m l
ov a
ov a
Sp a
Sw a in
er n
te T u nd
ng e y
e c C r ia
pu s
e n lic
to k
F i ia
Fr n d
m e
G ny
un e
Ic ry
Ir nd
d
ec La y
en i a
m
a
Re ru
h e lt
ur
al
Sl ani
Sl a ki
i
Es ar
G anc
H ec
an
Po an
itz de
Li te
n
xe a n
en
ug
ht tv
do
ga
b
w
rk
a
la
a
et Ma
t
a
a
It
i
h yp
bo
m
us
re
a
el
el
l
Sw e
lg
s
nl
lg
or
er
A
Ro
Ki
D
d
N
Li
ni
Cz
U
Production Consumption Combination of production and consumption
Source: EEA.
Figure 2.5 Types of instruments to support renewable energy, EEA-32, 2012
Number of measures
20
18
16
14
12
10
8
6
4
2
0
Be ria
Bu um
ec Cy ia
pu s
e
re y
un e
Ic ary
en lic
Es rk
Fi ia
Fr d
Ir nd
It d
y
en a
Lu ith in
m nia
g
rla a
N ds
Po ay
Po nd
m l
ov a
ov a
Sp a
Sw ain
itz den
te Tu d
ng y
m
Ro ga
Re u
an
al
e
G nc
H ec
i
he lt
Sl ni
Sl ki
i
an
an
ur
n
ar
n
v
en
e
do
a
b
n
pr
rk
w
a
la
la
et Ma
st
t
a
u
st
to
xe ua
a
i
m
g
bo
a
m
Sw e
nl
el
el
La
lg
lg
or
rt
er
Au
G
er
Ki
ht
D
L
h
ec
d
N
Li
Cz
ni
U
Others Quota obligations Tax instruments Feed-in tariffs and premiums Direct on-budget subsidies
Source: EEA. For the Czech Republic, the Netherlands, Spain and Switzerland, additional information was used from the in-depth case
studies elaborated for these countries.
(10) Because transport was not the focus of this study, the data on support measures for biofuels are sketchy; this type of information
was extracted in rough figures. This is why biofuels was not included in this graph, even though the database contains measures for
biofuels support.
18 Energy support measures and their impact on innovation in the renewable energy sector in EuropeEnergy support measures in EEA countries and innovation in the renewable sector
In most countries, end consumers pay for the main of the support on public budgets is likely to be very
support scheme for electricity production (FITs or limited already.
FIPs). Exceptions are the Czech Republic, Finland
and the Netherlands, where the government covers Not surprisingly, renewable energy support mostly
the cost partly or completely. For heating, the targets electricity production (see Figure 2.6).
situation is reversed. In most countries, support For instance, in countries like Cyprus, Denmark,
is covered by national or regional governments Germany, Italy, Liechtenstein, Norway and Turkey,
(e.g. Belgium) or by EU structural funds. more than 50 % of support measures are targeted
at electricity production. Apart from the electricity
All countries have other support measures in sector, households are also an important target
place apart from the main policy tool, such as group: more than 20 % of identified support
direct support, soft loans and tax incentives measures in support measures prevailing in France,
(for an overview, please see the country fiches Greece, Malta, the Netherlands, Portugal and Spain.
published separately from this report). In most Romania, Lithuania, Finland and Estonia have
countries, these support measures are financed by specific support measures related to renewable
governmental or EU structural funds. However, energy use in agriculture. Support measures
based on the in‑depth studies conducted for the targeted at renewable energy use in industry
Czech Republic, the Netherlands and Spain (for are especially important in Belgium, the Czech
details, see the case studies published separately Republic, Ireland and the United Kingdom.
from this report), the cost associated with the
main policy tool (FIT or FIP) tends to represent Estonia, Finland and Romania have specific support
more than 90 % of the overall cost for renewable measures related to renewable energy use in
support. Consequently, for electricity, the impact agriculture.
Figure 2.6 Target groups for renewable energy support, EEA-32, 2012
Share in number of measures (%)
100
90
80
70
60
50
40
30
20
10
0
Be ria
Bu ium
ec Cyp ia
Re us
en blic
Es rk
Fi nia
Fr d
m e
G ny
un e
Ic ary
Ir nd
d
ec La y
en a
Lu ith in
m nia
g
he lta
N ds
Po ay
rt d
m l
ov a
ov a
ia
Sw e n
itz den
te T nd
ng y
m
Ro uga
G nc
H ec
l
Ki ke
i
Sl ani
Sl aki
an
an
ur
Po lan
Sw ai
a
ar
ht tv
en
e
do
a
n
r
w
a
a
la
et Ma
st
It
st
to
xe a
Sp
m
g
bo
pu
re
a
rla
d ur
nl
el
el
lg
lg
or
u
er
Au
er
D
L
h
N
Li
Cz
ni
U
Services Not specified Industry Households Electricity Agriculture
Source: EEA.
Energy support measures and their impact on innovation in the renewable energy sector in Europe 19Energy support measures in EEA countries and innovation in the renewable sector
2.3 Overview of fossil fuel and nuclear programmes, or as support to electricity companies
support consuming coal from national mines. Coal support
in the EU must be phased out by 2018 though
In Europe, most fossil fuel support is allocated support to cover exceptional expenditures related
to consumption of these fuels (see Figure 2.7). It to the closure of mines can still be given until 2027
mainly takes the form of fiscal exemptions for (Council Decision 16229/1/10 + COR 1).
certain users of certain types of fossil fuels (see
Figure 2.8). Fiscal exemptions are listed in every Transfer of risk to governments was not identified
country in the 32 EEA countries, and are the as an important instrument for fossil fuel support
only form of fossil fuel (and nuclear) support in in the data sources used for this analysis. However,
Austria, Cyprus, Greece, Iceland, Italy, Lithuania, favourable capital loans and governmental
Luxembourg, Malta, Portugal, Sweden and guarantees (11) given to investors may form an
Switzerland. Industry, agriculture and transport important and overlooked item in fossil fuel support
are the most important beneficiaries from the fiscal in many countries. The fact that these have not been
exemptions, although important differences exist listed here does not imply that they do not exist —
between countries. only that these measures are difficult to distinguish
from the data sources used.
The Roadmap to a Resource Efficient Europe (EC, 2011c)
calls for EHS to be phased out by 2020. This means For each fossil fuel, there is a different mix of
that parallel measures to modernise sectors that measures that is used in different countries
benefit most from such support are also needed if (see Figure 2.9). It is worth noting that energy
the reform is to be successful. support measures are primarily granted for the
resources extracted in each country. For example,
Direct support is important in relative terms in a support related to coal is dominant in the Czech
few countries, especially in the Czech Republic, Republic, Hungary, Ireland, Poland, Romania,
Hungary, Poland and Spain. In most cases, Slovakia and Spain. Support related to natural gas
direct support is benefiting the mining sector — is dominant in the Netherlands, Norway and the
either directly as adjustment aid to restructuring United Kingdom. Most countries have support
Figure 2.7 Point of incidence for support to fossil fuels, EEA-32, 2012
Number of measures
25
20
15
10
5
0
a
m
Cy a
pu s
De lic
Fi a
Fr d
Ge nce
Gr y
Hu ce
Ice ry
Ire d
nd
ly
ia
xe nia
g
th lta
No s
Po y
nd
Ro gal
Sl nia
Sl ia
ia
Sw n
itz en
nd
Ki ey
m
Es rk
u
nd
an
a
ri
i
ni
ai
ur
an
n
Ita
ar
tv
ak
en
a
a
iu
do
b
pr
ee
rw
k
st
Ne Ma
Sw ed
la
la
la
la
to
Lu ua
a
Sp
rtu
ng
nm
bo
ite Tur
a
rm
la
lg
La
nl
lg
ov
m
Au
ov
er
ng
er
h
Bu
Be
Po
m
Re
Lit
h
d
ec
Cz
Un
Production Consumption Combination of production and consumption
(11) State guarantees can be accepted as state aid under certain conditions. For more details see http://eur-lex.europa.eu/LexUriServ/
LexUriServ.do?uri=OJ:C:2008:155:0010:0022:EN:PDF
20 Energy support measures and their impact on innovation in the renewable energy sector in EuropeEnergy support measures in EEA countries and innovation in the renewable sector
related to heating oil or the use of gas oil. Virtually The small number of measures in Figure 2.9
all countries grant support for the use of petrol and associated with nuclear energy (and their absence
diesel to some groups of users (e.g. agriculture), in France in particular) is conspicuous. These
and many countries have similar schemes for measures do exist, but it was very difficult to find
specific users of electricity, mostly for social reasons information on them in the literature reviewed.
(e.g. hospitals and schools). Governments have allocated support to the nuclear
Figure 2.8 Types of instruments to support fossil fuels and nuclear energy, EEA-32, 2012
Share in total measures (%)
100
90
80
70
60
50
40
30
20
10
0
ria
m
ec Cy ia
Es ark
e
Re rus
en lic
Fi ia
Fr d
G ny
un e
Ic ry
Ir nd
d
y
a
g
m nia
rla a
N ds
Po ay
Po nd
m l
ov a
ov a
Sp ia
S ain
itz den
te Tur d
y
m
Ro ga
ke
G nc
ec
al
he lt
Li tvi
Sl ni
Sl ki
an
ur
an
n
ar
n
en
iu
do
ga
b
n
w
a
a
la
la
et Ma
st
It
a
u
to
xe ua
a
p
m
bo
pu
re
a
m
Sw we
nl
el
el
La
lg
lg
or
rt
er
ng
Au
Lu th
Be
Bu
er
Ki
H
D
h
d
N
Cz
ni
U
Transfer of risk to government Other financial measures Non-financial measures Fiscal exemptions Direct subsidy
Source: EEA.
Figure 2.9 Distribution of support measures for fossil fuels and nuclear across different energy
carriers, EEA-32, 2012
Share in total number of measures (%)
100
90
80
70
60
50
40
30
20
10
0
Be ria
Bu ium
ec Cyp ia
Re us
en blic
Es rk
Fi nia
Fr d
m e
G ny
un e
Ic ary
Ir nd
d
ec La y
en ia
Lu th n
m nia
g
he lta
N ds
Po ay
rt d
m l
ov a
ov a
ia
Sw e n
itz den
te T nd
ng y
m
Ro uga
Ki ke
G anc
H ec
l
Sl ani
Sl aki
an
an
ur
Po lan
Li tei
Sw ai
a
ar
ht tv
en
do
a
n
r
w
a
a
la
et Ma
st
It
to
xe a
Sp
m
g
bo
pu
re
rla
d ur
nl
el
el
lg
s
lg
or
u
er
Au
er
D
h
N
Li
Cz
ni
U
Nuclear Petrol/diesel Oil Gas Coal
Source: EEA.
Energy support measures and their impact on innovation in the renewable energy sector in Europe 21Energy support measures in EEA countries and innovation in the renewable sector
industry for decades. Support for R&D is crucial In this section, various correlations between
in the early stages of development. Whilst this is a different variables are explored, to assess the main
known fact, data are sketchy at best. For example, drivers for innovation in the renewable energy
by some accounts, the United States alone had sector and the impact support measures may have
spent USD2011 95.7 billion on nuclear R&D (fusion on this process. The choice of variables was limited
and fission) by 2012; data reported by the IEA on to a large extent by data availability.
total governmental expenditure on nuclear fusion
R&D from 21 countries in 2011 was just over For example, Figure 2.10 shows that there is a
USD 4.1 billion. The nuclear industry also receives weak relationship between per capita renewable
support for building new power plants, usually in energy production of wind, solar and geothermal
the form of governmental guarantees. Where nuclear and per capita patent applications granted in these
power plants are owned and operated by state-owned categories (total over the 2005 to 2011 period) (12).
monopolies, governments typically use a combination Denmark is clearly the outlier, with a much larger
of grants and government-mediated finance. In a few share of patents compared to the other countries.
countries (e.g. China, the United Kingdom and the Luxembourg, Norway and Switzerland have
United States), nuclear power plants benefit also from a relatively high number of patents compared
regulated prices or production bounties (Oosterhuis to their renewable energy production in these
and ten Brink, 2014). Experts argue, however, that technologies. Italy, Portugal, and Spain tend to
by far the most support to the nuclear industry have much fewer patents applications as compared
comes from explicit or implicit limited liability in to their renewable energy production. This shows
case of major accidents. For example, in France, the that a strong focus on deployment (demand-pull)
estimated support range (given the EUR 700 million does not necessarily lead to accelerated innovation
ceiling) is somewhere between EUR 0.019 million in the renewable sector, a conclusion which is
and EUR 2 800 million per reactor year (Faure and supported by the analysis conducted in the four
Fiore, 2009). In most countries, nuclear power plants target countries (see Chapter 3 and the country case
have to pay a fee into a waste management fund, studies for the Czech Republic, the Netherlands,
to cover the costs of storing, treating and disposing Spain and Switzerland), and by a recent analysis
of the radioactive material. Fees vary widely across by Zheng and Kammen (2014). This latter analysis,
countries, and most likely this is another area where for example, suggests that despite a significant
support to the nuclear industry may exist. In the market-pull in Germany, the United States and
Czech Republic for instance, under the Atomic Japan remain the top innovators in PV technology
Energy Act 2002, the ČEZ group as a nuclear plant (see Figure 2.11). This means that the market‑pull
operator is required to put aside funds for waste strategy applied in Germany had a significant
disposal at the rate of EUR 0.002 per kilowatt-hour leakage problem in a globalised PV market, and
(kWh). This compares rather poorly with the rate failed to generate innovation and manufacturing in
required in France, for instance, of EUR 0.14/kWh this country.
(see the case study for the Czech Republic, published
separately from this report). For renewable energy technologies, there is clear
evidence that public support for R&D can be an
important driving force for innovation. Figure 2.12
2.4 Energy support measures and shows that a strong correlation exists between R&D
progress towards innovation in the expenditure and patents applications.
renewable energy sector
In general, the relationship between deployment
The link between energy support and innovation is of renewable energy technologies and employment
not straightforward. It depends, among others, on is relatively weak. This may be because of the
the original goal of the support: this could include strong focus in Europe on deployment (market
supporting low-income households and improving pull) to meet the 2020 targets and less emphasis on
equity, achieving energy security, increasing developing a strong domestic technological value
competitiveness of energy-intensive industries, chain to support this development (see also the
correcting for externalities, and supporting domestic discussion concerning Figure 2.11).
production and associated employment.
(12) An analysis for the total renewable energy production would be heavily influenced by hydro electricity production, and would show
less clear linkages with patent applications.
22 Energy support measures and their impact on innovation in the renewable energy sector in EuropeYou can also read