Engineering 2019 A barometer of the profession in Ireland - A COMMUNITY OF CREATIVE PROFESSIONALS DELIVERING SOLUTIONS FOR SOCIETY - Engineers Ireland
←
→
Page content transcription
If your browser does not render page correctly, please read the page content below
Engineering 2019 report v3.qxp_Layout 1 27/02/2019 10:57 Page 1

                                                       Engineering 2019
                                                       A barometer of the profession in Ireland

      A COMMUNITY OF CREATIVE PROFESSIONALS DELIVERING SOLUTIONS FOR SOCIETY
      www.engineersireland.ie
Engineering 2019 report v3.qxp_Layout 1 27/02/2019 10:57 Page 2

             Table of contents
                     Foreword . . . . . . . . . . . . . . . . . . . . . . . . . . . . . . . . . . . . . . . . . . . . . . . . . . . . . . . . . . . . . . . . . . . . . . . . . . . .i

                     Executive summary . . . . . . . . . . . . . . . . . . . . . . . . . . . . . . . . . . . . . . . . . . . . . . . . . . . . . . . . . . . . . . . . . . .ii

                     Indicators infographic . . . . . . . . . . . . . . . . . . . . . . . . . . . . . . . . . . . . . . . . . . . . . . . . . . . . . . . . . . . . . . . .iii

             1.      Introduction . . . . . . . . . . . . . . . . . . . . . . . . . . . . . . . . . . . . . . . . . . . . . . . . . . . . . . . . . . . . . . . . . . . . . . . . .1

             2.      Engineering employment . . . . . . . . . . . . . . . . . . . . . . . . . . . . . . . . . . . . . . . . . . . . . . . . . . . . . . . . . . . . . .4
                     2.1     Looking back on 2018 . . . . . . . . . . . . . . . . . . . . . . . . . . . . . . . . . . . . . . . . . . . . . . . . . . . . . . . . . . . . .4
                     2.2     Outlook for 2019 . . . . . . . . . . . . . . . . . . . . . . . . . . . . . . . . . . . . . . . . . . . . . . . . . . . . . . . . . . . . . . . . .5
                     2.3     Skills shortages indicators . . . . . . . . . . . . . . . . . . . . . . . . . . . . . . . . . . . . . . . . . . . . . . . . . . . . . . . .6
                     2.4     Salaries . . . . . . . . . . . . . . . . . . . . . . . . . . . . . . . . . . . . . . . . . . . . . . . . . . . . . . . . . . . . . . . . . . . . . . . .7

             3.      Engineering perspectives . . . . . . . . . . . . . . . . . . . . . . . . . . . . . . . . . . . . . . . . . . . . . . . . . . . . . . . . . . . . .12
                     3.1     Engineering as a career . . . . . . . . . . . . . . . . . . . . . . . . . . . . . . . . . . . . . . . . . . . . . . . . . . . . . . . . . .12
                     3.2     Recruitment and skills . . . . . . . . . . . . . . . . . . . . . . . . . . . . . . . . . . . . . . . . . . . . . . . . . . . . . . . . . . .14
                     3.3     Public health and safety . . . . . . . . . . . . . . . . . . . . . . . . . . . . . . . . . . . . . . . . . . . . . . . . . . . . . . . . . .15

             4.      Engineering education . . . . . . . . . . . . . . . . . . . . . . . . . . . . . . . . . . . . . . . . . . . . . . . . . . . . . . . . . . . . . . .22
                     4.1     Junior Certificate . . . . . . . . . . . . . . . . . . . . . . . . . . . . . . . . . . . . . . . . . . . . . . . . . . . . . . . . . . . . . . .22
                     4.2     Leaving Certificate . . . . . . . . . . . . . . . . . . . . . . . . . . . . . . . . . . . . . . . . . . . . . . . . . . . . . . . . . . . . . .23
                     4.3     Higher education . . . . . . . . . . . . . . . . . . . . . . . . . . . . . . . . . . . . . . . . . . . . . . . . . . . . . . . . . . . . . . .25
                     4.4     Apprenticeships . . . . . . . . . . . . . . . . . . . . . . . . . . . . . . . . . . . . . . . . . . . . . . . . . . . . . . . . . . . . . . . .28
                     4.5     Gender gap in education . . . . . . . . . . . . . . . . . . . . . . . . . . . . . . . . . . . . . . . . . . . . . . . . . . . . . . . . .29

             5.      Conclusion . . . . . . . . . . . . . . . . . . . . . . . . . . . . . . . . . . . . . . . . . . . . . . . . . . . . . . . . . . . . . . . . . . . . . . . . .32

                     Appendix 1. Methodological notes . . . . . . . . . . . . . . . . . . . . . . . . . . . . . . . . . . . . . . . . . . . . . . . . . . . . .36

                     Appendix 2. CAO Engineering Options . . . . . . . . . . . . . . . . . . . . . . . . . . . . . . . . . . . . . . . . . . . . . . . . . .38
Engineering 2019 report v3.qxp_Layout 1 27/02/2019 10:57 Page 3

             Foreword
             Welcome to Engineering 2019, the second in a series of reports by Engineers Ireland tracking
             developments in the engineering profession in Ireland. Since the first report, 12 months ago, the
             engineering sector has continued to flourish. This report presents a wide range of insights across
             engineering employment, perspectives and education based on information from our engineer
             members, engineering employers and the public.

             Engineers are critical to Irish society, environment and economy – from clean water supplies and
             safe buildings to renewable energy and new manufacturing technologies. If Ireland is to remain an
             attractive destination for high-value foreign direct investment, if we are to meet our goals in
             housing and broadband, and if we are to realise the ambitions mapped out in Project Ireland 2040,
             a ready supply of talented engineers is fundamental. However, the reality is that the number of
             students moving into third-level engineering and technology sectors needs to be much larger to
             meet our country’s current and future needs.

             This report shows that Junior Certificate students have a strong appetite for STEM and that
             engineering is considered to be a rewarding career for young people. Now, more than ever, we
             need to encourage students to retain this interest and advance their knowledge of STEM at senior
             level in 5th and 6th year and consider a future career in engineering. I would strongly encourage
             young people, and particularly young women, to consider a career in engineering and the fantastic
             and expanding opportunities that exist in the engineering profession.

                               Engineers Ireland awards professional titles recognising the career progression,
                                    ethical standards and achievements of our members. In the Republic of
                                       Ireland, we are the sole authority to award the title of Chartered Engineer
                                         and we mark the 50th anniversary of the title this year. As this report
                                           shows, the value of the professional expertise, leadership and ethical
                                            practice of these engineers is recognised in the industry.

                                                  In an era of digitalisation, and to overcome the challenges faced by
                                                     our society, we need to grow engineering as a creative, analytical
                                                        and diverse profession. Engineering 2019 takes up these issues,
                                                         presenting clear data to inform the work of Engineers Ireland
                                                           and our stakeholders. We hope it will be a useful resource
                                                            for engineers, educators, policy-makers and recruiters.

                                                                  Caroline Spillane
                                                                  Director General

                                                                  March 2019

                                                                                                                          i
Engineering 2019 report v3.qxp_Layout 1 27/02/2019 10:57 Page 4

             Executive summary
             Engineering 2019: A barometer of the profession in Ireland charts
             the remarkable growth in the engineering sector in Ireland. The
             report outlines developments in engineering employment,
             perspectives and education, based on information from
             approximately 2,000 engineers, 1,000 statistically-representative
             members of the public and 100 engineering employers. This
             information is complemented by the analysis of data collected by
                                                                                          Demand for
             State agencies and other organisations. A set of 10 key
             performance indicators for the profession has been developed and             engineering
             the results are shown overleaf.                                            recruits in 2019
             In general, Engineering 2019 demonstrates that engineers are in
                                                                                               Indicator 1 Pg: 5
             demand across all sectors and that confidence remains high. For
             example, 77% of engineering employers’ financial position greatly
             improved or slightly improved in 2018, while 89% expect their
             financial position to improve in 2019. These organisations would
             like to recruit more than 6,000 engineers in the next year. Demand
             is strongest in consulting engineering companies with Civil &
             Building Engineers highly sought after. In this context, engineering
             salaries have continued to rise. A graduate engineer can expect to
             earn €33,750, 21% (or €5,000) more than five years ago.

             However, there are serious skills shortages in the sector. The            Engineering is a
             supply of third level graduates (particularly from Level 7 and Level   rewarding career choice
             8 courses) and professional engineering apprentices is simply             for young people
             insufficient to meet the needs of our growing society. Almost all
             (94%) engineering employers consider a shortage of experienced
             engineers to be a barrier to growth. The National Skills Bulletin,               Indicator 4 Pg: 12
             which informs Government employment and education policy, now
             recognises shortages in almost all engineering occupations.
             Employers are not just looking for core engineering skills, they
             regard effective communication and teamwork as just as (or even
             more) important than fundamental engineering knowledge.

             The public holds engineers in extremely high regard: 78% think
             that engineering is a rewarding career for young people, while 80%
             believe engineers are essential to reduce risks to public safety and
             health. However, we can do more to inform the public about our
             profession: just 43% of Irish adults would feel confident explaining     Leaving Certificate
             what an engineer does and, worryingly, this figure is just 35% for       higher level STEM
             parents of secondary school children. Meanwhile, the gender gap               sittings
             in engineering persists, just 13% of last year’s graduates are
             female.
                                                                                               Indicator 7 Pg: 23

     ii
Engineering 2019 report v3.qxp_Layout 1 27/02/2019 10:57 Page 5

                                                                                                                                        Employment
                            Median salary,                                             Median salary,
                           Engineer with 1-2                                       Chartered Engineer with
                           years’ experience                                        6-10 years’ experience

                                                        Indicator 2 Pg: 9                                   Indicator 3 Pg: 10

                                                                                                                                        Public perspectives
                   There are plenty of engineering                             I would feel confident explaining
                        jobs in Ireland today                                       what an engineer does

                                                         Indicator 5 Pg: 13                                  Indicator 6 Pg: 13

                                                                                                                                        Education

             Graduates from Level 7                        Graduates from Level 9                  Percentage of graduates
              and Level 8 courses                           and Level 10 courses                    (Levels 7-10) who are
                                                                                                           women

                                   Indicator 8 Pg: 26                         Indicator 9 Pg: 27            Indicator 10 Pg: 30

                                                                                                                                  iii
Engineering 2019 report v3.qxp_Layout 1 27/02/2019 10:57 Page 6

             Introduction
             This is the second in the series of Engineering reports, the barometer of the engineering
             profession in Ireland. Last year’s report established a number of baselines across engineering
             employment, perspectives and education which are updated and analysed in this report. Where
             possible, five year trends are also examined. Before delving into this information, it is useful to
             consider some economic and policy developments in the past year.

             Economy and Brexit
             According to the Department of Finance, the Irish economy grew by approximately 7.5% in 2018 and
             was again the fastest growing economy in the EU. Even when the distorting effects of
             multinationals are stripped out, the economy grew by approximately 5% with strong increases in
             domestic demand and employment. There was impressive growth in sectors in which large
             numbers of engineers work, such as ICT and Construction (Section 2 of this report explores
             economic trends in engineering).

             Notwithstanding this growth, the United Kingdom’s decision to leave the European Union colours
             every aspect of Ireland’s economic future, and the associated uncertainty has been impacting the
             professional activity of engineers across the Republic of Ireland, Northern Ireland and Great
             Britain. To ensure that our members’ ability to work as an engineer across jurisdictions is not
             impacted negatively by Brexit, Engineers Ireland has reached agreements with our peer
             organisations in the UK. We continue to monitor the situation as Brexit unfolds.

             Digitalisation and skills
             Digitalisation is becoming pervasive in our daily lives and is driving a level of connectivity never
             before seen in society. New connectivity and production technologies are ushering in a revolution in
             global manufacturing generally referred to as Industry 4.0 – the 4th Industrial Revolution. At the
             same time, new technologies such as Building Information Modelling (BIM) are disrupting the
             construction industry. These developments pose major challenges and opportunities for Ireland,
             not least in the area of skills.

             The skills required to perform many jobs are transforming rapidly such that the demand for
             manual skills is falling while the need for analytical thinking and innovation continues to grow (see
             table on next page). The World Economic Forum have referred to a ‘reskilling imperative’. In this
             context, it is positive to note Government’s ‘Technology Skills 2022: Ireland’s Third ICT Skills Action
             Plan’ which targets more than 47,000 graduates with high level ICT skills by 2022. Other policy
             initiatives include increases in the Training Levy, the €300m Human Capital Initiative and the Future
             Jobs Initiative. Sections 3 and 4 of this report analyse the demand and supply of engineering skills
             in Ireland.

     1
Engineering 2019 report v3.qxp_Layout 1 27/02/2019 10:57 Page 7

             Comparing skills demand, top ten
             Trending, 2022                                       Declining, 2022
             Analytical thinking and innovation                   Manual dexterity, endurance and precision
             Active learning and learning strategies              Memory, verbal, auditory and spatial abilities
             Creativity, originality and initiative               Management of financial, material resources
             Technology design and programming                    Technology installation and maintenance
             Critical thinking and analysis                       Reading, writing, math and active listening
             Complex problem-solving                              Management of personnel
             Leadership and social influence                      Quality control and safety awareness
             Emotional intelligence                               Coordination and time management
             Reasoning, problem-solving and ideation              Visual, auditory and speech abilities
             Systems analysis and evaluation                      Technology use, monitoring and control

             Source: World Economic Forum, The Future of Jobs Report 2018

             Engineering 2019
             The purpose of Engineering 2019 is to measure, analyse and learn from significant trends in the
             engineering profession in Ireland. The data contained herein will be useful not only for engineers,
             but also for those considering entering our profession, for industry, for educational institutions and
             for Government policy.

             The report is based on three bespoke surveys conducted between October 2018 and February 2019
             with:
                  (i) 108 engineering organisations (employing a total of 36,778 engineers),
                 (ii) 1,908 qualified engineers, and
                (iii) 1,000 people statistically-representative of Irish adults.
             This information is complemented by summaries of data collected by other organisations such as
             the Central Statistics Office, Higher Education Authority and State Examinations Commission.

             The report is structured as follows: Section 2, Employment, examines financial position and
             outlook, recruitment and salaries; Section 3, Perspectives, outlines the opinions of the public,
             employers and qualified engineers on opportunities, skills and risk of harm; Section 4, Education,
             presents data on STEM and engineering education from Junior Certificate to postgraduate studies
             and apprenticeships. The concluding section of the report summarises key trends in the
             engineering profession in Ireland.

                                                                                                                      2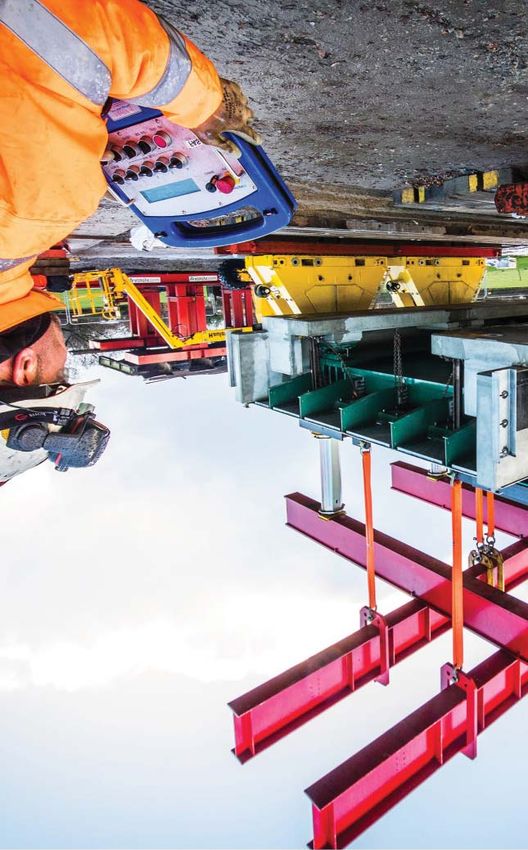
Engineering 2019 report v3.qxp_Layout 1 27/02/2019 10:57 Page 8

Engineering 2019 report v3.qxp_Layout 1 27/02/2019 10:57 Page 9

                                                                                                            Engineering employment

             Engineering employment
             Ireland’s economy grew at a strong pace through 2018. According to the Central Statistics Office
             (CSO), there was an annual increase in employment of 3.0% or 66,700 in the year to the third
             quarter of 2018, bringing total employment to 2,273,200. As introduced in the Engineering 2018
             report and elaborated in the following pages, the engineering sector has been growing even more
             rapidly. This section of the report presents data on changes in engineering employment in the past
             year and prospects for the remainder of 2019.

             2.1 Looking back on 2018
             In October 2018, Engineers Ireland engaged with engineering employers to learn about
             employment conditions, financial performance and recruitment trends. We surveyed a
             representative sample of engineering organisations across consulting engineering, construction,
             manufacturing and other industries such as the public sector and utilities. The respondents
             included 108 engineering organisations with a total of 36,778 employees in the Republic of Ireland.
             Take a look at Appendix 1 for the survey method and sample.

             Engineering employers in Ireland had a good year in 2018. 77% of them told us that their financial
             position greatly improved or slightly improved during those 12 months when compared to 2017.
             Meanwhile, just 6% felt that their position has disimproved (Figure 1). These results are a further
             improvement on the performance of engineering firms in 2017. Meanwhile, four out of five
             engineering employers recruited engineers last year.

             Figure 1       Reported change in financial position

             2018               22%                                      45%                                26%             6%

             2017          13%                                    50%                               21%             12%      4%

                     0%                    20%                     40%               60%                    80%               100%

                   Greatly improved       Slightly improved        Stayed the same   Slightly disimproved    Greatly disimproved

                                                                                                                                     4
Engineering 2019 report v3.qxp_Layout 1 27/02/2019 10:57 Page 10

             Engineering 2019

             2.2 Outlook for 2019
             Turning to the year ahead, 89% engineering employers told us that they expect their financial
             position to greatly improve or slightly improve in 2019 (Figure 2). This represents an 11-point
             increase on employers’ expectations at this time last year.

             Figure 2       Expected change in financial position

                                                                                                                              9%        2%
             2019            16%                                                 73%

                                                                                                                     15%           6%   1%
             2018         10%                                          68%

                     0%                    20%                     40%                 60%                     80%                  100%

                   Greatly improve       Slightly improve          Stay the same       Slightly disimprove         Greatly disimprove

             The engineering employers also told us about their recruitment plans for 2019. By extrapolating
             these results to the full engineering labour force (weighting by industry), we estimated recruitment
             trends for the broader engineering sector (see Appendix 1 for method). This research revealed the
             enormous demand for engineers right across the economy. More than 6,000 job openings for
             engineers will be created in 2019 (Table 1).

             Table 1        Demand for engineers in 2019 by industry and discipline

                                                 Construction Consultancy Manufacturing                      Other    All industries
               Chemical & Process                      14                 15                 81               42             152
               Civil & Building                       166                1004               121              770           2,060
               Electrical & Electronic                429                163                320              714           1,626
               Mechanical &
                                                      465                113                346              252           1,175
               Manufacturing
               Other/General                           0                 532                 89              378             999
               All disciplines                       1,074               1,828              956              2,156         6,014

                                                                       Demand for engineering
                                                                         recruits in 2019

         5
Engineering 2019 report v3.qxp_Layout 1 27/02/2019 10:57 Page 11
Engineering employment
Demand is strongest in consulting engineering companies (particularly for more experienced
engineers – Table 2). The European Federation of Engineering Consultancy Associations (EFCA)
expects Irish consulting engineering to be one of the only markets with increasing profitability in
2019 (Figure 3). Large numbers of engineers are also required in construction, manufacturing and
in other areas such as the public sector and utilities.
Table 2 Demand for engineers in 2019 by experience and discipline
5+ years 3-5 years 0-2 years All
Construction 310 411 353 1,074
Consultancy 744 604 480 1,828
Manufacturing 332 242 383 956
Other 1,232 504 420 2,156
All industries 2,617 1,760 1,636 6,014
Civil & Building Engineers are among the most in demand with 59% of organisations surveyed
looking to hire these engineers in 2019. Meanwhile Mechanical & Manufacturing Engineers and
Electrical & Electronic Engineers are sought by 39% and 35% engineering companies, respectively.
Figure 3 Expected change in profitability in consulting engineering in 2019 (EFCA Barometer)
Profitability increase Profitability stable Profitability decrease
6Engineering 2019 report v3.qxp_Layout 1 27/02/2019 10:57 Page 12
Engineering 2019
2.3 Skills shortages indicators
Published in November, the National Skills Bulletin 2018 is a report by the SOLAS on behalf of the
National Skills Council. The Bulletin presents a set of skills shortage indicators, which informs
Government policy in areas such as employment and education. Its method is based on a
comparison of estimated demand and supply for 100 occupation categories, which receive a
shortage indicator of green, amber or red – see below for the description of each colour.
Shortage
Description
indicator
There are no shortages
There is no overall current shortage, but some issues (e.g. geographical mobility,
high turnover), or potential future shortages, have been identified.
There is an insufficient number of individuals who had the required level of
educational attainment, skills set and/or experience to meet the required labour
market demand and/or where there is an insufficient number of individuals
available to take up employment opportunities in a particular occupation.
The Bulletin identifies shortages in almost all engineering occupations, indicated by red dots in
Table 3. The Bulletin specifically highlights shortages in the following engineering occupations:
electrical, chemical, automation, validation, mechanical, process, quality control, design, and civil.
There are also shortages in related fields such as technicians and construction project managers.
The results and commentary presented in the Bulletin echo Engineers Ireland’s research and
engagements (see Section 3 of this report and the Engineering 2018 report), which have
continuously pointed to skills shortages across the sector in recent years. Employment has been
growing strongly (annualised growth rate of over 7%) and engineering organisations and
recruitment agencies are finding it increasingly difficult to fill vacancies.
As outlined in Section 4 of this report, the output from the Irish education system is insufficient to
meet the level of demand for engineers. Furthermore, there have been relatively few employment
permits issued for non-EEA nationals to work in the sector. This is particularly the case for civil
engineering which is not included on the Highly Skilled Eligible Occupations List (see Conclusion).
7Engineering 2019 report v3.qxp_Layout 1 27/02/2019 10:57 Page 13
Engineering employment
Table 3 Skills shortages indicators as presented in the National Skills Bulletin 2018
Number Growth Difficult Permits Shortage
Occupation Commentary employed rate1 to fill2 issued3 indicator
Civil engineers &
Output from the education and
construction
training system is not expected
project
to be enough to meet growing
managers
demand. Shortages are only
Includes
beginning to emerge and are 11,000 6.3% P 15
small in numbers, although the
- Civil engineers
reduced supply indicates that
- Construction
these shortages could be
project
exacerbated in future years.
managers
Employers are frequently citing
Production, these occupations as difficult to
design & QC fill although the demand is
engineers likely to be small in number
Includes
given the size of the
employment stock. Demand is
13,000 8.4% P 239
- Process mostly for roles requiring
- Quality control sector specific experience (e.g.
- Design medium-high, high-tech and
food/beverage manufacturing).
Employment growth in this
occupational group, which
includes mechanical, electrical
and electronic engineers, was
Other
above average. Employers are
engineering
frequently citing these
professionals
occupations as difficult to fill
although the demand is likely to
Includes
- Electrical
be small in number given the 14,200 7.2% P 207
size of the employment stock.
- Chemical
While the supply from the
- Automation
education system appears to be
- Validation
growing, demand is mostly for
- Mechanical
roles requiring sector-specific
experience (e.g. medium-high,
high-tech and food/beverage
manufacturing).
1
Employment growth: Annualised rate of employment growth for the period 2012-2017.
2
Difficult to fill: Results of the SLMRU (SOLAS) Recruitment Agency Survey conducted in April 2018.
The occupations with mentions of difficult-to-fill vacancies reported by recruitment agencies are
indicated by a tick.
3
Employment permits: Issued to non-EEA nationals in 2017. This is an indicator of the demand for
skills that could not be met from domestic or EEA sources.
8Engineering 2019 report v3.qxp_Layout 1 27/02/2019 10:57 Page 14
Engineering 2019
2.4. Salaries
In January 2019, we asked the Engineers Ireland membership about the levels of remuneration and
benefits in the profession. 1,724 engineers responded and the survey method and characteristics of
the sample are provided in Appendix 1. The last Engineers Ireland Salary Survey was conducted
using a similar approach during the same period in 2018. The data which follow are median salaries.
The median is the number in the middle when a list of numbers is sorted
NOTE
from lowest to highest. Half of all engineers earn more than the median
salary; half of all engineers earn less than the median salary.
Figure 4 Median salary by years of experience
€100000
€90000
€80000
€70000
€60000
€50000
€40000
€30000
€20000
€10000
€0
1-2 3-5 6-10 11-15 16-20 21-25 26-30 >30
years years years years years years years years
A graduate engineer can expect to earn €33,750 in 1-2 years after graduation (Table 4). This salary
will increase steadily with experience (Figure 4) and engineers with 11-15 years’ experience today
earn €60,000. The majority of engineers with more than 30 years of experience currently earn more
than €89,000. Since 2014, salaries have been increasing in the profession, particularly for younger
engineers. Today’s graduate engineer can expect to start on a salary that is more than €5,000
higher (+21%) than her/his counterpart in 2014.
Median salary, Engineer with
1-2 years’ experience
9Engineering 2019 report v3.qxp_Layout 1 27/02/2019 10:57 Page 15
Engineering employment
Table 4 Median salary by years of experience and change since 2014
Experience 2019 1-year change 5-year change
1-2 years €33,750 +9% +21%
3-5 years €38,750 +5% +17%
6-10 years €48,000 +5% +12%
11-15 years €60,000 n/c +3%
16-20 years €71,000 +1% +13%
21-25 years €75,000 -3% +3%
26-30 years €85,000 +3% +9%
>30 years €89,000 -4% +10%
Engineers Ireland awards professional titles such as ‘Chartered Engineer’ and ‘Fellow’, recognising the
career progression, ethical standards and achievements of our members. The value of these professional
titles is recognised through increased remuneration. A Chartered Engineer can expect to earn €5,000 per
year more than an untitled engineer with the same number of years of experience (Table 5). It takes more
than 20 years of experience before this salary gap closes. At this point, Chartered Engineers who become
Fellows of Engineers Ireland can expect to earn an additional €15,000-€20,000 per year.
Table 5 Median salary by years of experience and professional title
Experience Fellow Chartered Engineer Member
(FIEI) (CEng) (MIEI)
1-2 years - - €33,200
3-5 years - - €38,000
6-10 years - €50,000 €45,000
11-15 years - €61,500 €56,000
16-20 years - €73,000 €68,500
21-25 years €93,000 €75,000 €75,000
26-30 years €107,500 €86,000 €79,000
>30 years €106,000 €86,250 €95,000
The Engineers Ireland Salary Survey 2019 report is an exclusive Engineers Ireland member
NOTE
benefit, available to download from the members’ area of www.engineersireland.ie. This
report includes detailed analysis of salaries and other benefits (pensions, bonuses etc.)
according to engineering discipline, sector, position and much more.
Median salary, Chartered Engineer
with 6-10 years’ experience
10Engineering 2019 report v3.qxp_Layout 1 27/02/2019 10:57 Page 16
Engineering 2019 report v3.qxp_Layout 1 27/02/2019 10:58 Page 17

                                                                                                      Engineering perspectives

             Engineering perspectives
             For the final of the three Engineering 2019 surveys, we commissioned Behaviour & Attitudes to
             undertake a face-to-face poll with 1,000 members of the public and representative of the Irish
             population aged 16 years old and over. The poll used the same methodology as in 2018, which
             enables direct comparisons (see Appendix for methodological information). The following section
             of the report analyses the public’s perspectives on aspects of the engineering profession. For some
             indicators, these perspectives are compared with those of qualified engineers and their employers.

             3.1 Engineering as a career
             We were interested to learn about the general public’s perspectives on engineering as a career.
             When asked whether engineering is a rewarding career choice for young people, the vast majority
             (78%) agreed – see Figure 5. This is a marginal (one percentage point) decrease on 2018, which
             may be explained by slight differences in the poll’s sample. There was particularly strong
             agreement among 25-34 year olds, 81% of whom believe that engineering is a rewarding career
             choice for young people.

             Figure 5       Engineering is a rewarding career choice for young people

                         Public (2018)                                                                    Public (2019)
                             3%

                                                                                                              6%
                   18%                                                                              16%
                                                              Agree

                                                              Neither agree or disagree

                                                              Disagree
                                        79%                                                                               78%

                                                                      Engineering is a rewarding
                                                                   career choice for young people

                                                                                                                                 12
Engineering 2019 report v3.qxp_Layout 1 27/02/2019 10:58 Page 18
Engineering 2019
The public also believe that there are plenty of job opportunities in the engineering sector in
Ireland (62% agree), shown in Figure 6. This is a remarkable improvement on a similar poll
conducted by Engineers Ireland five years ago when only 22% adults thought that there were plenty
of job opportunities. This said, there has been a slight decrease in this metric over the past year,
from 67% in 2018 to 62% in 2019.
Figure 6 There are plenty of job opportunities in engineering in Ireland
Public (2014) Public (2018) Public (2019)
7% 8%
22%
40% 27%
30%
67% 62%
38%
There are plenty of engineering
jobs in Ireland today
In the poll, members of the public were also asked their level of agreement with the statement ‘I
would feel confident explaining what an engineer does’. Overall, just 43% of the public feel
confident explaining engineering. Interestingly, men are substantially more confident explaining
engineering: 51% agreed with the statement, compared to 36% of women.
I would feel confident explaining
what an engineer does
There was one other area where there was a significant variation in response according to the
demographics of respondents – social grade of the occupation of the chief income earner. There is
substantially higher confidence explaining engineering among those grouped as ABC1 (52%) and
Farmers (50%) than those grouped as C2DE (35%).
Examining engineers’ ability to explain their profession, it is unsurprising that more than 90% feel
confident explaining: 57% agreed and 33.5% strongly agreed. It is interesting to note that the
proportion who strongly agreed broadly increases with years of experience: 16% of newly qualified
engineers strongly agreed compared to 44% of the most experienced engineers.
13Engineering 2019 report v3.qxp_Layout 1 27/02/2019 10:58 Page 19
Engineering perspectives
Figure 7 Confidence explaining what an engineer does
Public (by gender)
60
50
40 51%
43%
30
36%
20
10
0
Public Men Women
Public (by social grade)
60
50
40
30
52%
20
35% 50%
10
0
ABC1 C2DE F
Qualified engineers (by years of experience)
100
90
80
70
60
50
40
30
20
10
89% 16% 91% 29% 88% 30% 90% 28% 90% 40% 91% 40% 94% 31% 95% 44%
0
1-2 3-5 6-10 11-15 16-20 21-25 26-30 30+
years years years years years years years years
lighter shade = strongly agree
14Engineering 2019 report v3.qxp_Layout 1 27/02/2019 10:58 Page 20
Engineering 2019
Research by Science Foundation Ireland, Accenture, Microsoft and many others has found that
parents have a hugely important role in encouraging their children to study STEM subjects. We are
therefore very interested in understanding and working with parents’ attitudes to engineering.
Segregating the results of the public poll by lifestage, it was possible to compare the responses of
three cohorts (Table 6): single people with no children; people with children in primary school; and
people with children in secondary school.
Table 6 Views on engineering as a career (% agreeing with each statement)
No children Children in Children in
primary school secondary school
Engineering is a
rewarding career choice 80% 76% 78%
for young people
There are plenty of job
opportunities in the 61% 60% 65%
engineering sector in Ireland
I would feel confident
explaining what an 45% 43% 35%
engineer does
100 No children
90
80 Children at primary school
70
Children at secondary school
60
50
40
30
20
10
0
Rewarding Plenty of Confident
career jobs explaining
It is very positive that large majorities in all three cohorts believe that engineering is a rewarding
career for young people. Similarly, most of these members of the public agree that there are plenty
of job opportunities in engineering, almost two-thirds (65%) of parents of secondary school
children support this statement. However, it is worrying that only 35% of these same parents feel
confident explaining what an engineer does for a living. We return to this issue in the Conclusion of
the report.
15Engineering 2019 report v3.qxp_Layout 1 27/02/2019 10:58 Page 21
Engineering perspectives
3.2 Recruitment and skills
In our survey of engineering employers, we asked about barriers to recruitment in 2018 and 2019.
The employers’ biggest barrier to growth is a shortage of experienced engineers / engineers with
the right skills. 94% of them told us that this is a barrier and almost half (48%) expect this situation
to get worse in the next year (Figure 8). This shortage is related to the shortage of engineering
graduates and the competition for staff, which were ranked as the third and fourth largest barriers.
Figure 8 Employers’ barriers to recruitment
Shortage of experienced engineers / 94%
engineers with the right skills 48%
88%
Salary expectations
55%
Shortage of engineering 79%
graduates 24%
High staff turnover / 69%
competition for staff 44%
Significantly increased 56%
recruitment costs 23%
48%
Housing shortage
34%
Difficulty geting work 36%
permits / visas 11%
28%
Brexit
25%
0% 20% 40% 60% 80% 100%
Barrier Will get worse
16Engineering 2019 report v3.qxp_Layout 1 27/02/2019 10:58 Page 22
Engineering 2019
When we asked the employers what kind of skills they considered important, they responded that
skills such as communication and teamwork are just as important as – if not more important than
– engineering knowledge and methods. Despite using a different list of skills (based on the
International Engineering Alliance’s graduate attributes) this year, this is the second year in a row
that communication skills were ranked the most important by engineering employers (77% said
these skills were ‘very important’, while 21% responded ‘important’). Other ‘very important’ skills
are: effective individual and team work (76% employers), fundamental engineering knowledge
(71%) and professional ethics (65%).
Figure 9 Important engineering graduate attributes
Effective communication
Effective individual
and team work
Fundamental engineering
knowledge
Professional ethics
Usage of modern
and appropriate tools
Analysis of
complex problems
Design of solutions
of complex problems
Preparation for
lifelong learning
Investigation and
experimentation
Project management
and finance
Understanding
sustainability
Understanding
responsibility to society
0% 10% 20% 30% 40% 50% 60% 70% 80% 90% 100%
Very important Important Not important
17Engineering 2019 report v3.qxp_Layout 1 27/02/2019 10:58 Page 23
Engineering perspectives
To ensure they have the skills and expertise to undertake future projects, engineering
organisations have been investing in upskilling/reskilling current employees (66%) and
collaborating with education institutions (64%) – see Figure 10. However, comparatively few have
been offering apprenticeships (26%) or specifically targeting female talent (23%). While it is not
possible to directly compare these results to the previous year (due to a change in method), the
ranking of the initiatives is the same in both sets of results.
Figure 10 Initiatives taken by employers to overcome skills shortages
Investing in reskilling
current employees
67%
Collaborating with
64%
educational institutions
Increased investment in HR /
Learning and Development initiatives 48%
Attracting foreign
talent/recruiting abroad
43%
Hiring more staff on short-term
contracts/projects 30%
Offering apprenticeships 26%
Specifically targeting female talent 23%
Other (please specify) 7%
0% 10% 20% 30% 40% 50% 60% 70% 80%
In an open-ended question, we asked the engineering employers what they have found has worked
in attracting the right engineering talent. Of a wide variety, some typical responses included:
• “The most important single element to attract people to the company remains salary.”
• “Offering benefits and flexible working hours / work from home options.”
• “Providing opportunities for advancement within the organisation with clear
defined routes for progression.”
• “We have visited colleges to show them details of our graduate programme.”
• “Have a focus on existential issues such as climate change and renewable energy.”
18Engineering 2019 report v3.qxp_Layout 1 27/02/2019 10:58 Page 24
Engineering 2019
3.3 Public health and safety
In the Engineering 2018 report, we explored public trust in a variety of professions using an
established methodology (which is also used by the Medical Council of Ireland). We were glad to
discover that there are exceptionally high levels of trust in the engineering profession: 91% adults
trust engineers to tell the truth. Of the 10 professions listed, only doctors were more trusted. In
that same poll, 91% adults said that they regard engineers to be highly competent – that they are
able to apply expertise in their daily work.
This year, we sought to better understand public perceptions of risk of harm and the role of the
various professions. In the first question of the poll (to avoid inducing bias), we asked:
“Some work can cause serious harm to the public if it isn’t done correctly. In which of the following
areas of work is there a serious risk of harm?”
The respondents were presented with a randomised list of 10 areas of work, based on the list of
professions used in 2018. The results are shown on the next page.
85% of adults believe that engineering work poses a serious risk of harm to the public if it isn’t
done correctly. This was followed by medicine (81%) and policing (76%). It is in this context that
public confidence in the competence of engineers – and indeed in other professions such as
doctors – should be seen. As a follow-up question, the poll asked whether engineers are essential
to reduce risks to public health and safety. 80% of the public agreed, while only 5% disagreed.
Figure 11 Engineers are essential to reduce risks to public health and safety
5%
14%
Agree
Neither agree or disagree
Disagree
80%
19Engineering 2019 report v3.qxp_Layout 1 27/02/2019 10:58 Page 25
Engineering perspectives
Figure 12 Perceived risk of harm in various areas of work (compared to perceptions of competence in the profession)
85%
Engineering / Engineers
91%
81%
Medicine / Doctors
93%
76%
Policing / The Gardaí
67%
63%
Politics / TDs
48%
62%
Journalism / Journalists
71%
61%
Law / Judges
82%
Industrial relations / 60%
Trade Union Officials 67%
Business / 57%
Business leaders 75%
54%
Civil Service / Civil Servants
70%
52%
Teaching / Teachers 91%
0% 20% 40% 60% 80% 100%
Work poses a risk of harm Profession is highly competent
20Engineering 2019 report v3.qxp_Layout 1 27/02/2019 10:58 Page 26
Engineering 2019 report v3.qxp_Layout 1 27/02/2019 10:58 Page 27

                                                                                                          Engineering education

             Engineering education
             4.1. Junior Certificate
             Engineers Ireland is a leading advocate for STEM education, inspiring curiosity, exploration,
             creativity and problem-solving in children from an early age. For the purposes of this report, our
             analysis of engineering education begins at the Junior Certificate level. Data on the number of
             students sitting exams in each Junior Certificate subject are provided by the State Examinations
             Commission (SEC). In the past five years, the total number of STEM sittings at higher level has
             increased by 11% (Table 7), while the overall increase in Junior Certificate students was 4.6%.
             There has been particularly strong growth in the number of students taking higher level
             mathematics, an increase of almost 5,000 students since 2013.

             Table 7        Number of students sitting higher level STEM subjects for the Junior Certificate

            Subject                           2013         2014     2015       2016       2017       2018         Year- 5 year
                                                                                                                 on-year trend
            Science                          42,423       42,821   42,658     43,898     45,708     46,423        +2%     +9%
            Mathematics                      30,500       32,041   32,535     32,830     34,822     35,443        +2%    +16%
            Material Technology               13,280      13,487    13,271    13,636     14,142     14,634        +3%     +10%
            Technical Graphics                 9,207       8,953    8,655      8,684      8,912      9,447        +6%     +3%
            Metalwork                          6,300       6,373    6,409      6,257      6,229      6,447        +3%     +2%
            Technology                         2,589       2,830    2,852      3,154      3,163      3,573        +13%    +38%
            Total STEM sittings              104,299 106,505       106,380 108,459 112,976 115,967                +3%    +11%

             Table 8        Number of students sitting ordinary level STEM subjects for the Junior Certificate

            Subject                           2013         2014    2015      2016       2017       2018         Year-  5 year
                                                                                                               on-year trend
            Mathematics                      24,687       24,047   22,856    23,781    23,570      23,833        +1%      -3%
            Science                          11,488       11,936   11,632    11,573    11,499      11,785        +2%      +3%
            Technical Graphics                3,357        3,396   3,046     3,247      3,500      3,599         +3%      +7%
            Material Technology               2,883        2,977   2,874     2,745      2,941      2,833         -4%      -2%
            Metalwork                         1,543        1,507   1,575     1,630      1,590      1,588         -0.1%    +3%
            Technology                         368          393     406       422        413        497          +20%    +35%
            Total STEM sittings              44,326       44,256   42,389    43,398    43,513     44,135         +1%     -0.4%

                                                                                                                                  22
Engineering 2019 report v3.qxp_Layout 1 27/02/2019 10:58 Page 28
Engineering 2019
4.2 Leaving Certificate
Turning to the Leaving Certificate, data again obtained from the SEC, show that the number of
students sitting exams in STEM subjects held steady while the overall number of students sitting
the Leaving Certificate dropped by 2.4%. This drop means that year-on-year results are mixed,
though the five-year trend is very positive (Table 9).
Table 9 Number of students sitting higher level STEM subjects for the Leaving Certificate
Subject 2013 2014 2015 2016 2017 2018 Year- 5 year
on-year trend
Biology 23,433 24,442 25,595 25,211 26,684 26,543 -1% +13%
Mathematics 13,014 14,326 14,691 15,198 16,395 16,837 +3% +29%
Chemistry 6,757 7,226 7,533 7,658 8,162 7,943 -3% +18%
Construction Studies 6,572 6,847 6,877 7,087 7,451 7,105 -5% +8%
Agricultural Science 5,951 6,329 6,067 6,269 6,376 6,543 +3% +10%
Physics 4,832 5,399 5,764 6,003 6,271 6,258 +0% +30%
Engineering* 3,742 4,172 4,408 4,489 4,586 4,668 +2% +25%
Design & Communication 4,017 4,097 4,192 4,350 4,445 4,480 +1% +12%
Applied Mathematics 1,470 1,569 1,729 1,917 1,869 1,826 -2% +24%
Technology 944 983 1,168 1,244 1,367 1,430 +5% +51%
Physics & Chemistry 330 361 437 439 481 415 -14% +26%
Total STEM sittings 71,062 75,751 78,461 79,865 84,087 84,048 n/c +18%
Leaving Certificate higher level
STEM sittings
The Leaving Certificate subject ‘engineering’ is the study of a range of mechanical
NOTE
engineering materials, processes and technological applications. It is not a
requirement for entry to engineering at third level, which is much broader in scope.
The take-up of higher level maths continues to go from strength to strength; the number of
students taking this paper has doubled since 2011 (Figure 13). Today, more than one-third of
mathematics students take the subject at higher level, up from 18% in 2011.
23Engineering 2019 report v3.qxp_Layout 1 27/02/2019 10:58 Page 29
Engineering education
Figure 13 Number of students sitting higher level mathematics for the Leaving Certificate
18000
16000
14000
12000
10000
8000
6000
4000
2000
0
2011 2012 2013 2014 2015 2016 2017 2018
As the number of students studying STEM subjects at higher level over the past two years increased,
there were corresponding decreases at ordinary level (Table 10). Between 2016 and 2018, 5,000 more
students sat higher level STEM subjects while 5,000 fewer students sat these subjects at ordinary
level. This may be a result of the new grading system introduced in 2017, whereby a student achieving
a result of 30-39% (H7 grade, previously known as an ‘E’ grade) at higher level is awarded CAO points.
Table 10 Number of students sitting ordinary level STEM subjects for the Leaving Certificate
Subject 2013 2014 2015 2016 2017 2018 Year- 5 year
on-year trend
Mathematics 32,165 32,428 33,266 32,549 32,334 31,336 -3% -3%
Biology 8,064 8,514 8,269 8,890 7,608 7,006 -8% -13%
Physics 1,616 1,778 1,744 1,750 1,314 1,277 -3% -21%
Chemistry 1,399 1,378 1,405 1,431 1,306 1,224 -6% -13%
Construction Studies 1,541 1,562 1,392 1,466 1,299 1,143 -12% -26%
Agricultural Science 1,463 1,597 1,605 1,624 1,284 1,237 -4% -15%
Design & Communication 1,334 1,257 1,170 1,173 1,130 913 -19% -32%
Engineering 1,139 1,031 968 890 689 586 -15% -49%
Technology 130 119 160 171 160 104 -35% -20%
Physics & Chemistry 993 105 115 140 110 103 -6% +11%
Applied Mathematics 129 137 190 172 100 128 +28% -1%
Total STEM sittings 49,073 49,906 50,284 50,256 47,334 45,057 -5% -8%
24Engineering 2019 report v3.qxp_Layout 1 27/02/2019 10:58 Page 30
Engineering 2019
4.3 Higher education
A wide range of engineering-related courses are offered at third level in universities and institutes
of technology. Engineers Ireland accredits over 100 engineering programmes, subjecting each to a
rigorous process of evaluation. Appendix 2 lists the CAO codes and courses which can lead to an
Engineers Ireland accredited qualification, categorised according to eligibility for Engineers
Ireland’s Professional Titles: Chartered Engineer, Associate Engineer or Engineering Technician.
The Higher Education Authority (HEA) collects statistics on higher education student entry,
enrolment and graduation. The HEA uses 20 different codes for statistics on engineering-related
courses. Engineers Ireland has developed five broad engineering disciplines to enable our analyses
(more information is available in the Engineering 2018 report).
New entrants to higher education
For the 2017/18 academic year, there were 3,884 new entrants to engineering courses, an increase
of 2% since 2012, but down 4% in the past year (Table 11). As a proportion of all new entrants to
higher education, engineering has remained relatively stable at 9%. The analysis of discipline-
specific trends is complicated by the common/general entry route (captured in the ‘other/general’
category). This said, there has been strong growth in Civil & Building Engineering (48% increase
since 2012), albeit from a low base. Meanwhile, the number of entrants to Electrical & Electronic
Engineering has fallen by 36%.
Table 11 New entrants to higher education
Broad discipline 2012 2013 2014 2015 2016 2017 Year- 5 year
on-year trend
Chemical & Process 95 91 82 128 136 100 -26% +5%
Civil & Building 582 529 645 800 913 863 -5% +48%
Mechanical & Manufacturing 831 870 976 1,054 1,075 934 -13% +12%
Electrical & Electronic 1,162 961 886 822 848 742 -13% -36%
Other/General 1,142 1,349 1,121 1,184 1,073 1,245 +16% +9%
Total 3,812 3,800 3,710 3,988 4,045 3,884 -4% +2%
Total engineering proportion 9% 9% 9% 9% 9% 9% n/c n/c
n/c = no change
25Engineering 2019 report v3.qxp_Layout 1 27/02/2019 10:58 Page 31
Engineering education
Graduates
In 2017, there were 3,865 graduates from Level 7 and Level 8 engineering courses (Table 12). This
represents a 1% increase since 2016, but a 15% decrease over the past five years. This worrying
decline can also be seen in engineering’s proportion of all Level 7 and Level 8 graduates which fell
from 12% in 2012 to 10% in 2016 and 2017. A particular cause of concern is the 5-year trend in Civil
& Building Engineering, graduates of which have dropped from 1,494 in 2012 to 669 in 2017, down
55% in five years.
Table 12 Graduates from Level 7 and Level 8 courses
Broad discipline 2012 2013 2014 2015 2016 2017 Year- 5 year
on-year trend
Chemical & Process 90 97 142 105 117 94 -20% +4%
Civil & Building 1,494 1,271 894 746 765 669 -13% -55%
Mechanical & Manufacturing 1,020 1,033 1,148 1,123 987 1,094 +11% +7%
Electrical & Electronic 1,279 1,361 1,506 1,440 1,434 1,297 -10% +1%
Other/General 678 586 395 611 534 711 +33% +5%
Total 4,561 4,348 4,085 4,025 3,837 3,865 +1% -15%
Total engineering proportion 12% 11% 11% 11% 10% 10% n/c -2pp
Graduates from Level 7
and Level 8 courses
Figure 14 Graduates from Level 7 and Level 8 courses
Chem
1800
1600
Civil
1400
1200 Mech
1000
800 Elec
600
Other
400
200
0 2012 2013 2014 2015 2016 2017
26Engineering 2019 report v3.qxp_Layout 1 27/02/2019 10:58 Page 32
Engineering 2019
In 2017, there were 1,031 graduates from postgraduates engineering courses (Table 13), almost
two-thirds of whom were graduates from taught masters courses (Level 9). There has been a
reasonably steady increase in this postgraduate level in recent years, up 9% in the past year and
40% in the past five years. This trend is approximately in line with the national trend, engineering
postgraduates accounting for 4-5% of the total.
Table 13 Graduates from Level 9 and Level 10 courses
Broad discipline 2012 2013 2014 2015 2016 2017 Year- 5 year
on-year trend
Chemical & Process 113 148 200 211 161 222 +38% +96%
Civil & Building 133 148 179 149 138 167 +21% +26%
Mechanical & Manufacturing 52 57 83 71 122 132 +8% +154%
Electrical & Electronic 204 199 170 167 188 197 +5% -3%
Other/General 233 291 280 253 334 313 -6% +34%
Total 735 843 912 851 943 1,031 +9% +40%
Total engineering proportion 4% 4% 5% 4% 5% 5% n/c +1pp
Graduates from Level 9
and Level 10 courses
Figure 15 Graduates from Level 9 and Level 10 courses
Chem
400
350
Civil
300
250 Mech
200
Elec
150
100 Other
50
0 2012 2013 2014 2015 2016 2017
27Engineering 2019 report v3.qxp_Layout 1 27/02/2019 10:58 Page 33
Engineering education
4.4. Apprenticeships
Data on apprenticeships is provided by the Further Education and Training Authority (SOLAS) and
the Department of Education & Skills. New forms of apprenticeships have been developed in the
past five years, led by industry consortia with higher education institution (HEI) partners. These
apprenticeships are flexible in delivery, including on-the-job learning (approx. 70%) and on-campus
learning (approx. 30%). Apprentices are employed under a formal contract and are paid for the
duration of their apprenticeship.
Four of these new apprenticeships relate to the engineering profession (Table 14). These
apprenticeships are generally placed at Level 7 on the NFQ with a B.Eng. award upon completion
after 2-3 years. There are currently 211 apprentices registered on these programmes and the first
cohort graduated in 2018. Further professional engineering apprenticeships are currently in
development.
Table 14 Professional engineering apprentices [from SOLAS/DES]
New apprenticeships NFQ Duration HEI Industry 2016 2017 2018
lead lead
Industrial Electrical Engineering Level 7 2 years LIT Stryker 12 31 55
Manufacturing Technology Level 6 2 years GMIT Medtech Assoc - 40 69
Manufacturing Engineering Level 7 3 years GMIT Medtech Assoc - 36 50
Polymer Processing Technology Level 7 3 years AIT Plastics Ireland - 25 37
Total registered 12 132 211
It should also be noted that there is a major shortage of craft apprentices, numbers of which
declined dramatically during the economic recession. While these apprentices do not qualify as
engineers, many become engineering technicians or progress to study engineering. More
importantly, apprentices play a vital role in the wider engineering and construction sector and the
decline in apprentice registrations is a key component of skills shortages in the sector.
28Engineering 2019 report v3.qxp_Layout 1 27/02/2019 10:58 Page 34
Engineering 2019
4.5. Gender gap in education
Bridging the gender gap must be a key driver in engineering and wider STEM education. In this
light, it is very positive to note that women comprise the majority of students who sit Junior
Certificate higher level papers in both science and mathematics (51%). Overall, at Junior
Certificate level, 41% higher level STEM subject sitting are by female students, an increase of two
percentage points in the past five years (Table 15). For the Leaving Certificate, 43% higher level
STEM sittings are by female students, again an increase of two percentage points in the past five
years (Table 16). However, this proportion is skewed by the number of female students taking
higher level biology (62%) and chemistry (57%). Meanwhile, just 29% higher level physics students
are women.
Table 15 Gender gap in Junior Certificate higher level STEM sittings in 2018
Subject %Women Year-on-year 5 year trend
Science 51% n/c +1pp
Mathematics 51% n/c +1pp
Material Technology 17% +1pp +5pp
Technical Graphics 18% n/c +4pp
Metalwork 10% n/c +3pp
Technology 22% +4pp +6pp
All STEM subjects 41% n/c +2pp
Table 16 Gender gap in Leaving Certificate higher level STEM sittings in 2018
Subject %Women Year-on-year 5 year trend
Biology 62% n/c +1pp
Mathematics 48% +1pp +1pp
Chemistry 57% n/c +3pp
Construction studies 11% +1pp +5pp
Agricultural science 43% n/c +3pp
Physics 29% +2pp +4pp
Engineering 7% +1pp +2pp
Design & comm. 15% +1pp +3pp
Applied mathematics 27% +1pp +4pp
Technology 17% -1pp n/c
Physics & chemistry 43% +2pp +3pp
All STEM subjects 43% +1pp +2pp
pp = percentage points; n/c = no change
29Engineering 2019 report v3.qxp_Layout 1 27/02/2019 10:58 Page 35
Engineering education
Men greatly outnumber women at each stage of engineering higher education and in
apprenticeships (Table 17). Women comprise 13% of new entrants and graduates (undergraduate
and postgraduate), just one in eight.
The gender gap is larger in certain disciplines of engineering such as Civil & Building, Electrical &
Electronic and Mechanical & Manufacturing. The gender gap is particularly alarming for
apprenticeships where just 4% or 8 of 211 are women. This said, the gender gap has narrowed with
the proportion of female engineering students generally increasing by four percentage points over
the past five years.
Table 17 Percentage of students/apprentices who are women
2012 2013 2014 2015 2016 2017 Year- 5 year
on-year trend
New entrants
Chemical & Process 49% 38% 52% 45% 34% 37% +3pp -12pp
Civil & Building 5% 5% 5% 6% 7% 8% +2pp +3pp
Mechanical & Manufacturing 3% 3% 5% 6% 8% 9% +1pp +5pp
Electrical & Electronic 8% 6% 6% 8% 8% 8% n/c n/c
Other/General 15% 14% 17% 20% 20% 21% +1pp +6pp
Total 10% 9% 10% 12% 12% 13% +1pp +4pp
Graduates (Levels 7-10)
Chemical & Process 38% 36% 46% 49% 40% 41% +1pp +3pp
Civil & Building 8% 9% 10% 9% 9% 9% -1pp +1pp
Mechanical & Manufacturing 5% 8% 7% 9% 9% 8% -1pp +3pp
Electrical & Electronic 8% 8% 8% 8% 10% 9% -1pp +1pp
Other/General 15% 16% 17% 20% 20% 21% +1pp +6pp
Total 10% 11% 12% 13% 13% 13% n/c +4pp
Professional engineering apprentices
Total n/a n/a n/a n/a 0% 4% +4pp n/a
pp = percentage points; n/c = no change; n/a = not applicable
Percentage of graduates
(Levels 7-10) who are women
30Engineering 2019 report v3.qxp_Layout 1 27/02/2019 10:58 Page 36
Engineering 2019 report v3.qxp_Layout 1 27/02/2019 10:58 Page 37

                                                                                                          Conclusion

             Conclusion
             This final section of the report outlines four key trends, based on the preceding data, in engineering
             employment, perspectives and education. Understanding these trends helps Engineers Ireland and
             our members to advocate for the engineering profession and to deliver solutions for society. These
             trends also hold important lessons for industry, educational institutions, State bodies and industry
             who will all be instrumental in preparing Ireland for further changes in how we live, work and
             communicate.

             Trend 1: Demand for engineers grows
             The engineering employers we surveyed reported strong financial performance in 2018 with 77%
             growing their business, up from 63% in 2017. Only 6% of them experienced a decrease in their
             financial performance. These results echo the growth seen in engineering-related sectors of
             economy, as measured by the CSO. Engineering organisation’s outlook for the remainder of 2019 is
             even more positive with 89% expecting their financial position to improve.

                                                             of engineering employers expect
                                                             their business to grow in 2019,
                                                                 up from 78% one year ago

             This business performance is translating into significant demand for engineers across each of the
             sectors studied in this report. We derived an estimate of 6,014 for the number of engineers
             employers would like to recruit this year. Consulting engineering companies have the most
             ambitious recruitment plans and the demand for Civil & Building Engineers is striking. The high
             level of demand for engineers has seen graduate engineer salaries increase by 21% in the past five
             years to €33,750.

             Employers continue to value the Chartered Engineer title awarded by Engineers Ireland (which
             recognises professional expertise, leadership and ethical practice) such that Chartered Engineers
             earn €5,000 more per year than their untitled peers with the same number of years of experience.
             For example, the typical engineer with 6-10 years’ experience and without a professional title earns
             €45,000, while a Chartered Engineer who graduated in the same year earns €50,000 on average.

             Trend 2: Skills shortages become more acute
             In last year’s report, Engineering 2018, most employers told us that there was an inadequate
             supply of engineers to meet their needs in the medium term. This year, skills shortages have
             become more acute and the evidence of this has become even clearer. Almost all (94%)
             engineering employers consider a shortage of experienced engineers to be a barrier to growth –
             and 48% expect this situation to get worse in the year ahead.

                                                                                                                      32
You can also read