INVESTOR PRESENTATION - January 2019 - Investor Relations
←
→
Page content transcription
If your browser does not render page correctly, please read the page content below
INVESTOR PRESENTATION
January 2019
                        The Cove at Oyster Point (San Francisco, CA)
DISCLAIMERS
This presentation is being presented solely for your information, is subject to change and speaks only as of the date hereof. This presentation is not complete and is only a summary of the more detailed information included elsewhere, including in our Securities
and Exchange Commission (“SEC”) filings. No representation or warranty, expressed or implied is made and you should not place undue reliance on the accuracy, fairness or completeness of the information presented.

FORWARD-LOOKING STATEMENTS

Statements contained in this presentation, as well as statements made by management, that are not historical facts are "forward-looking statements" within the meaning of Section 27A of the Securities Act of 1933, as amended, and Section 21E of the Securities
Exchange Act of 1934, as amended. Forward-looking statements include, among other things, statements regarding our and our officers’ intent, belief or expectation as identified by the use of words such as “may,” “will,” “project,” “expect,” “believe,” “intend,”
“anticipate,” “seek,” “target,” “forecast,” “plan,” “potential,” “estimate,” “could,” “would,” “should” and other comparable and derivative terms or the negatives thereof. Although we believe that the expectations reflected in such forward-looking statements
were based upon reasonable assumptions at the time made, we can give no assurance that such results, plans or expectations will be achieved. Future events and actual results, financial and otherwise, may differ materially from the results discussed in or
implied by the forward-looking statements. Readers are cautioned not to rely on these forward-looking statements and are advised to consider risks and uncertainties discussed in the Company's Annual Report on Form 10-K for the year ended December 31, 2017
and in the other documents the Company has filed with the SEC subsequent to December 31, 2017.

Examples of forward-looking statements include, among other things, (i) demographic, industry, market and segment forecasts; (ii) timing, outcomes and other details relating to current, pending or contemplated acquisitions, dispositions, developments, joint
venture transactions, capital recycling and financing activities, and other transactions and terms and conditions thereof discussed in this presentation; (iii) pro forma asset concentration, operator exposure, tenant diversification, income, yield, balance sheet,
credit profile, credit metrics, and private pay percentage; and (iv) financial forecasts, financing plans, expected impact of transactions, and our economic guidance, outlook and expectations. Forward-looking statements reflect our current expectations and views
about future events and are subject to risks and uncertainties that could significantly affect our future financial condition and results of operations. While forward-looking statements reflect our good faith belief and assumptions we believe to be reasonable based
upon current information, we can give no assurance that our expectations or forecasts will be attained. Further, we cannot guarantee the accuracy of any such forward-looking statement contained in this presentation, and such forward-looking statements are
subject to known and unknown risks and uncertainties that are difficult to predict. These risks and uncertainties include, but are not limited to: HCP, Inc.’s (“HCP” or the “Company”) reliance on a concentration of a small number of tenants and operators for a
significant percentage of its revenues, the financial condition of the Company’s existing and future tenants, operators and borrowers, including potential bankruptcies and downturns in their businesses, and their legal and regulatory proceedings, which results in
uncertainties regarding the Company’s ability to continue to realize the full benefit of such tenants’ and operators’ leases and borrowers’ loans; the ability of the Company’s existing and future tenants, operators and borrowers to conduct their respective
businesses in a manner sufficient to maintain or increase their revenues and to generate sufficient income to make rent and loan payments to the Company and the Company’s ability to recover investments made, if applicable, in their operations; competition for
the acquisition and financing of suitable healthcare properties as well as competition for tenants and operators, including with respect to new leases and mortgages and the renewal or rollover of existing leases; the Company’s concentration in the healthcare
property sector, particularly in senior housing, life sciences and medical office buildings, which makes its profitability more vulnerable to a downturn in a specific sector than if the Company were investing in multiple industries; the Company’s ability to identify
replacement tenants and operators and the potential renovation costs and regulatory approvals associated therewith; the risks associated with property development and redevelopment, including costs above original estimates, project delays and lower
occupancy rates and rents than expected; the risks associated with the Company’s investments in joint ventures and unconsolidated entities, including its lack of sole decision making authority and its reliance on its partners’ financial condition and continued
cooperation; the Company’s ability to achieve the benefits of acquisitions or other investments within expected time frames or at all, or within expected cost projections; the potential impact on the Company and its tenants, operators and borrowers from current
and future litigation matters, including the possibility of larger than expected litigation costs, adverse results and related developments; operational risks associated with third party management contracts, including the additional regulation and liabilities of
RIDEA lease structures; the effect on the Company and its tenants and operators of legislation, executive orders and other legal requirements, including compliance with the Americans with Disabilities Act, fire, safety and health regulations, environmental laws,
the Affordable Care Act, licensure, certification and inspection requirements, and laws addressing entitlement programs and related services, including Medicare and Medicaid, which may result in future reductions in reimbursements or fines for noncompliance;
changes in federal, state or local laws and regulations, including those affecting the healthcare industry that affect the Company’s costs of compliance or increase the costs, or otherwise affect the operations, of its tenants and operators; the Company’s ability to
foreclose on collateral securing its real estate-related loans; volatility or uncertainty in the capital markets, the availability and cost of capital as impacted by interest rates, changes in the Company’s credit ratings, and the value of its common stock, and other
conditions that may adversely impact the Company’s ability to fund its obligations or consummate transactions, or reduce the earnings from potential transactions; changes in global, national and local economic and other conditions, including currency exchange
rates; the Company’s ability to manage its indebtedness level and changes in the terms of such indebtedness; competition for skilled management and other key personnel; the potential impact of uninsured or underinsured losses; the Company’s reliance on
information technology systems and the potential impact of system failures, disruptions or breaches; the Company’s ability to maintain its qualification as a real estate investment trust; and other risks and uncertainties described from time to time in the
Company’s SEC filings. Except as required by law, we do not undertake, and hereby disclaim, any obligation to update any forward-looking statements, which speak only as of the date on which they are made.

The estimated stabilized cash capitalization rates and yield ranges included in this presentation are calculated by dividing projected cash net operating income (adjusting for the impact of upfront rental concessions) for the applicable properties by the aggregate
purchase price or development cost, as applicable, for such properties. The aggregate cash net operating income projections used in calculating the cash capitalization rates and yield ranges are based on information currently available to us, including, in the case
of the cash capitalization rate for Sierra Point Towers, information made available to us by the seller, and certain assumptions applied by us related to anticipated occupancy, rental rates, property taxes and other expenses over a specified period of time in the
future based on historical data and the Company’s knowledge of and experience with this submarket. Newly acquired operating assets are generally considered stabilized at the earlier of lease-up (typically when the tenant(s) control(s) the physical use of at least
80% of the space) or 12 months from the acquisition date. Newly completed developments are considered stabilized at the earlier of lease-up or 24 months from the date the property is placed in service.

The actual cash capitalization rates for these properties may differ materially and adversely from the estimated stabilized cash capitalization rates and yield ranges discussed in this presentation based on numerous factors, including our difficulties achieving
assumed occupancy and/or rental rates, development delays, unanticipated expenses not payable by a tenant, increases in the Company’s financing costs, tenant defaults, the results of our final purchase price allocation, as well as the risk factors set forth in our
Annual Report on Form 10-K for the year ended December 31, 2017 and our subsequent filings with the SEC. As such, we can provide no assurance that the actual cash capitalization rates for these properties will be consistent with the estimated stabilized cash
capitalization rates and yield ranges set forth in this presentation. Moreover, the Sierra Point Towers acquisition remains subject to customary closing conditions. As such, we cannot assure you that the Sierra Point Towers acquisition will be consummated on
time or at all, nor can we assure you that if consummated, the property will perform to our expectations.

MARKET AND INDUSTRY DATA

This presentation also includes market and industry data that HCP has obtained from market research, publicly available information and industry publications. The accuracy and completeness of such information are not guaranteed. Such data is often based on
industry surveys and preparers’ experience in the industry. Similarly, although HCP believes that the surveys and market research that others have performed are reliable, such surveys and market research is subject to assumptions, estimates and other
uncertainties and HCP has not independently verified this information.

NON-GAAP FINANCIAL MEASURES

This presentation contains certain supplemental non-GAAP financial measures. While HCP believes that non-GAAP financial measures are helpful in evaluating its operating performance, the use of non-GAAP financial measures in this presentation should not be
considered in isolation from, or as an alternative for, a measure of financial or operating performance as defined by GAAP. You are cautioned that there are inherent limitations associated with the use of each of these supplemental non-GAAP financial measures
as an analytical tool. Additionally, HCP’s computation of non-GAAP financial measures may not be comparable to those reported by other REITs. You can find reconciliations of the non‐GAAP financial measures to the most directly comparable GAAP financial
measures, to the extent available without unreasonable efforts, at “3Q 2018 Discussion and Reconciliation of Non-GAAP Financial Measures” on the Investor Relations section of our website at www.hcpi.com

                                                                                                                                                                                                                                       HCP, Inc.                      2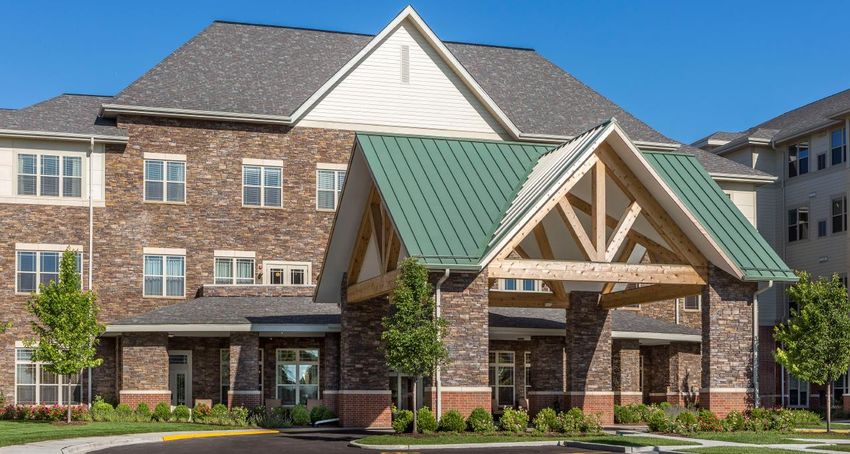
TABLE OF CONTENTS

1.   Introduction to HCP                     4-9

2.   Recent Updates                        10 – 15

3.   Development Overview                  16 - 23

4.   Portfolio Highlights                  24 - 39

5.   Segment Overviews
     A.       Life Science                 41 - 45
     B.       Medical Office               46 - 53
     C.       Senior Housing               54 - 59

6.   Balance Sheet & Sustainability        60 - 64

                                      HCP, Inc.      3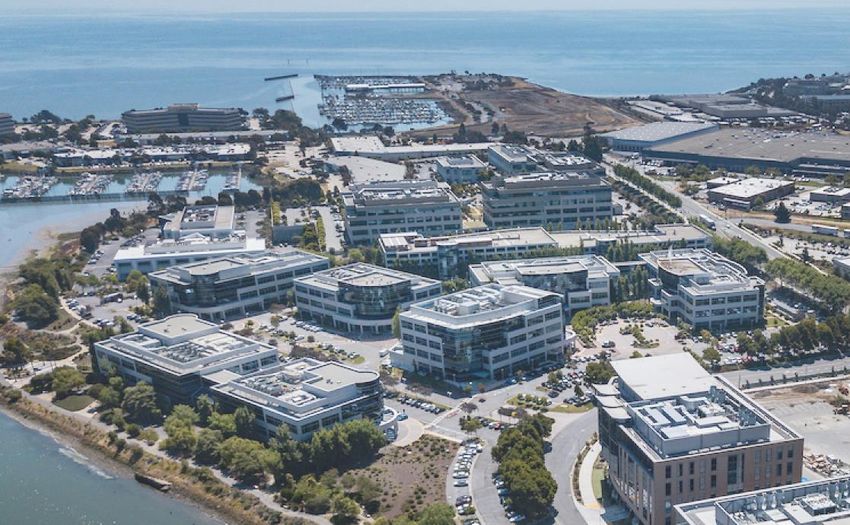
INTRODUCTION TO HCP

HCP, Inc.                Sky Ridge Medical Office Building | Aspen, CO
INTRODUCTION
HCP at a Glance

                              DIVERSIFIED                                                                                                                                                          SCALE

                 BALANCED PORTFOLIO                                                                                                                                                         775 PROPERTIES
             19 Million Sq. Ft. Medical Office                                                                                                                                        $21 Billion in Enterprise Value(1)

                7 Million Sq. Ft. Life Science                                                                                                                                           $13 Billion in Market Cap

                29,500 Senior Housing Units

                                                                                                              HIGH-QUALITY
                                                                                                                 PRIVATE PAY
                                                                                                                 DIVERSIFIED

                   INVESTMENT GRADE                                                                                                                                                           ESTABLISHED

              STRONG BALANCE SHEET                                                                                                                                            33 YEARS AS A PUBLIC COMPANY
                         S&P: BBB+ (Stable)                                                                                                                                                 Member of S&P 500

                     Moody’s: Baa2 (Stable)                                                                                                                                                5.2% Dividend Yield(2)

               Fitch: BBB (Positive Outlook)

___________________________
1. Enterprise value and market capitalization based on HCP’s share price of $28.30 on 01/07/19 and total consolidated debt and HCP’s share of unconsolidated JV debt as of 9/30/18.
2. Based on share price as of 01/07/19.

                                                                                                                                                                                                               HCP, Inc.   5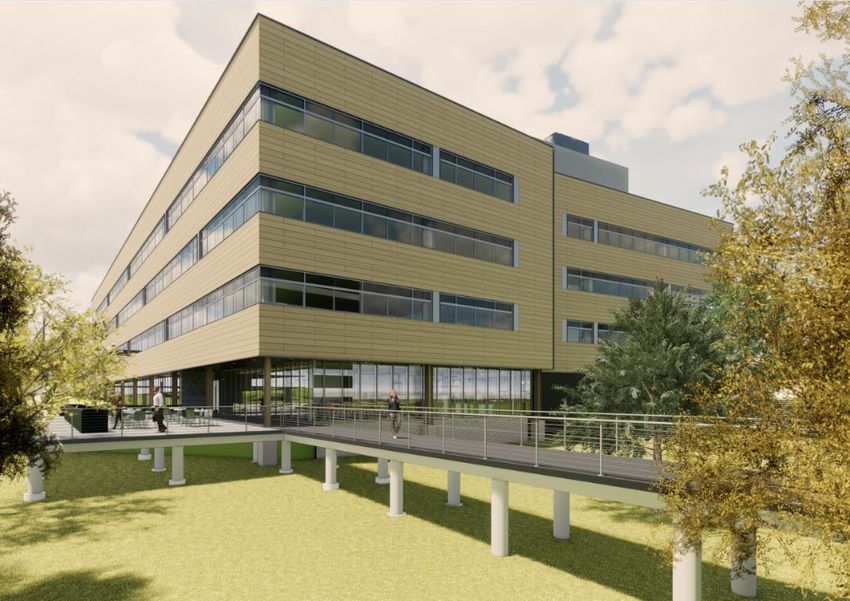
SENIOR LEADERSHIP

                                                        TOM HERZOG President & Chief Executive Officer
                                                        Mr. Herzog is our President and CEO and a member of our Board of
                                                        Directors. Mr. Herzog is responsible for all aspects of the Company’s
                                                        business. Prior to HCP, Mr. Herzog was CFO of UDR, Inc. from
                                                        January 2013 until June 2016. Prior to UDR, Mr. Herzog served as
                                                        both the CFO (2005 to 2009) and CAO (2004 to 2005) for Apartment
                                                        Investment and Management Company (AIMCO). From 2000 to
                                                        2004, Mr. Herzog served as the CAO and Global Controller for GE
                                                        Real Estate. His experience also includes 10 years at Deloitte &
                                                        Touche LLP’s audit and real estate group.

        SCOTT BRINKER Chief Investment Officer                                                           PETER SCOTT Chief Financial Officer
        Mr. Brinker is our EVP and Chief Investment Officer. In addition to                              Mr. Scott is our EVP and Chief Financial Officer and is responsible
        leading the Company’s investment activities, Mr. Brinker will also                               for all aspects of the Company’s finance, treasury, tax, risk
        oversee our senior housing platform. Prior to HCP, Mr. Brinker most                              management, and investor relations activities. In addition, Mr. Scott
        recently served as EVP and Chief Investment Officer at Welltower                                 sits on our Investment Committee. Prior to HCP in 2017, he served as
        from July 2014 to January 2017. Prior to that, he served as                                      Managing Director in the Real Estate Banking Group of Barclays
        Welltower’s EVP of Investments from January 2012 to July 2014.                                   from 2014 to 2017. His experience also includes various positions of
        From July 2001 to January 2012, he served in various investment and                              increasing responsibility at the financial services firms Credit Suisse
        portfolio management related capacities with Welltower.                                          from 2011 to 2014, Barclays from 2008 to 2011 and Lehman Brothers
                                                                                                         from 2002 to 2008.

        TOM KLARITCH Chief Operating Officer                                                             TROY McHENRY General Counsel & Corporate Secretary
        Mr. Klaritch is our EVP and Chief Operating Officer and oversees the                             Mr. McHenry is our EVP, General Counsel and Corporate Secretary
        Company’s office platforms with the life science and medical office                              and serves as the chief legal officer. He is responsible for providing
        businesses reporting to him, and works closely with the respective                               oversight and a legal perspective for the Company’s real estate and
        teams to advance the competitive performance and growth of this                                  financing transactions, litigation, as well as corporate governance
        platform. Prior to his current role, Mr. Klaritch served as Senior                               and SEC/NYSE compliance. He previously served as SVP – Legal and
        Managing Director – Medical Office Properties from April 2008 to                                 HR from July 2013 to February 2016, as well as other legal related
        August 2017. Mr. Klaritch has over 35 years of operational and                                   capacities since December 2010. Prior to HCP, Mr. McHenry held
        financial management experience in the medical office and hospital                               various legal leadership roles with MGM Resorts International, Boyd
        sectors.                                                                                         Gaming Corp., and DLA Piper.

                                                                                                                                                      HCP, Inc.               6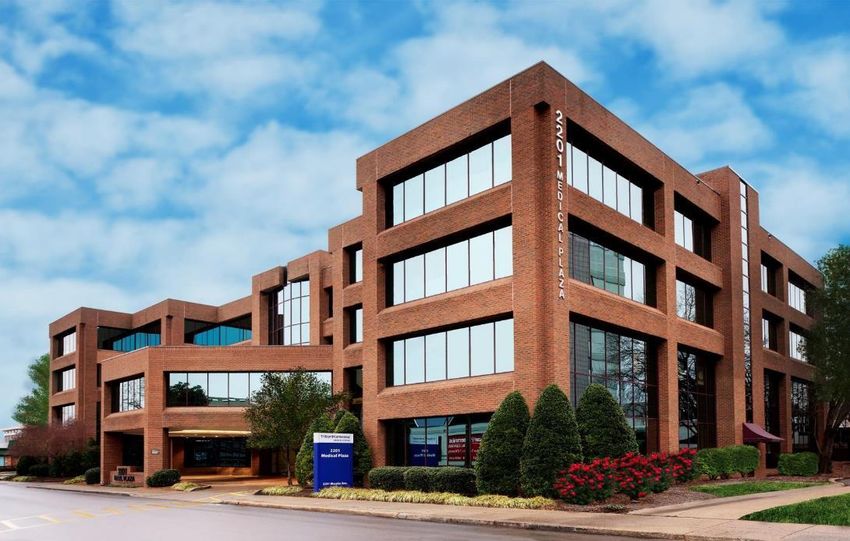
THE OPPORTUNITY
HCP Has a Significant Pipeline for Future Growth

                 U.S. HEALTHCARE REAL ESTATE(1)                                                                                                          HCP’s PRO FORMA PORTFOLIO(2)

                                                Other owners of
                                              healthcare real estate
                                                                                                                                                                            Medical                                 Life Science
                                                                                                                                                                             Office                                     23%
                                                                                                                                                                             29%

                                                        $1.1                                                                                                                                  $21B
                                                                                                      HCP                                                                                    Enterprise
                                                 Trillion                                      Other                                                                   Hospital                Value
                                                                                               public                                                                      7%
                                                                                               REITs                                                                                                      Senior Housing
                                                                                                                                              Other &       3%
                                                                                                                                         Unconsolidated JVs    6%                                                   32%
                                                                                                                                                                         CCRC JV

___________________________
1. Source: National Investment Center for Seniors Housing & Care (NIC), HCP research.
2. Target percentages represent 3Q 2018 Cash NOI and Interest Income (“Portfolio Income”) as of 9/30/18 pro forma to reflect asset sales in connection with the Master Transactions and Cooperation Agreement (“MTCA”) with Brookdale Senior Living, Inc. (“Brookdale”
   and certain other previously announced sales. Also includes pro forma adjustments to reflect the sale of our Shoreline Technology Center campus, and to reflect acquisitions, dispositions and operator transitions as if they occurred on the first day of the quarter.

                                                                                                                                                                                                                                          HCP, Inc.                           7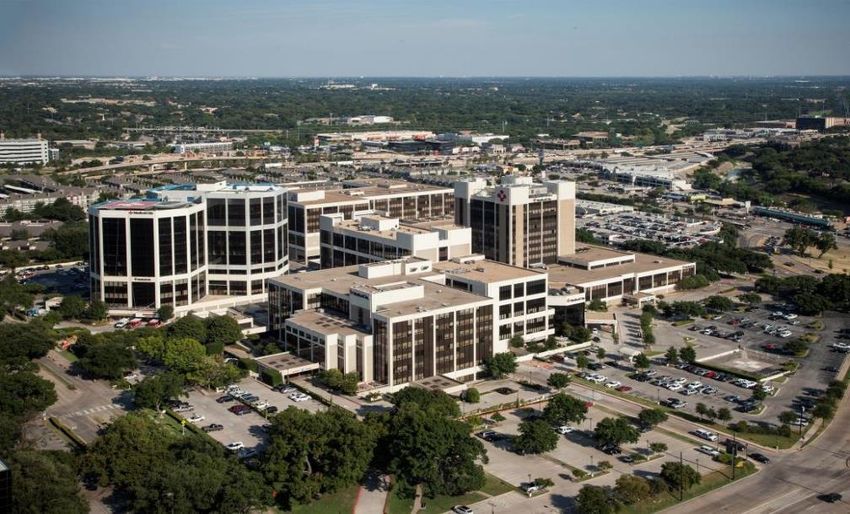
HCP’S PORTFOLIO & STRATEGY OVERVIEW
Strategic Growth Initiatives Across Segments
As Baby Boomers Age, They Will Continue to Seek…
Senior Housing communities
Outpatient services and specialist New and innovative drugs,
doctor visits performed more offering social activities, daily
treatments and healthcare
efficiently in a Medical Office living assistance, and
devices, which will be serviced by
building setting coordination with outside
our Life Science portfolios
healthcare providers
Parker Adventist Denver, CO The Cove San Francisco, CA The Solana Preserve Houston, TX
Grow relationships with top Focus on the three major Life Focus on locations with strong 5-
hospitals and health systems Science markets mile / 20-min drive time
demographics and favorable
Pursue on-campus and select off- Assemble clusters of assets
supply outlooks
campus assets with strong hospitals through acquisitions, development
and health systems in relevant and redevelopment Active asset and portfolio
markets management to reduce risks
Grow existing relationships by
Redevelop portions of our older, on- providing expansion opportunities Capitalize on select development
campus portfolio to our tenants and redevelopment opportunities
HCP, Inc. 8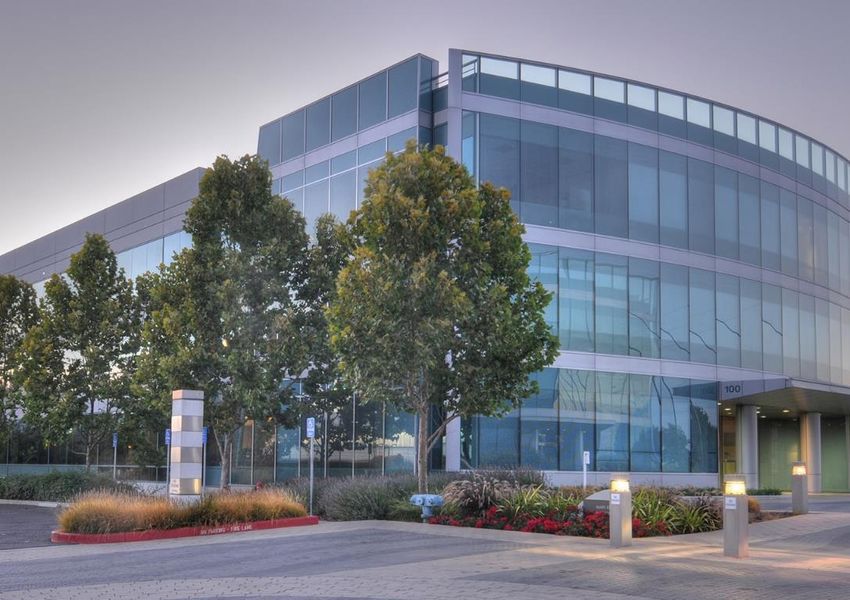
WHAT DIFFERENTIATES HCP
•      High-quality, 95% private-pay portfolio with a balanced emphasis on Medical Office, Life Science, and
       Senior Housing real estate
•      ~52% of pro forma cash NOI from primarily on-campus Medical Office portfolio and premier Life Science
       properties in San Francisco, San Diego and Boston
•      Virtually no exposure to post-acute/skilled-nursing or mezzanine debt investments

•      ~38% of pro forma cash NOI from a diversified senior housing portfolio with a balanced mix of well-
       covered triple-net leases and operating properties
•      Portfolio-wide average lease maturity of 5.2 years (1) gives HCP the opportunity to mark leases to market in
       a rising rate environment
•      $1.4 billion development and redevelopment pipeline with additional life science land and entitlements to
       create an ~$420 million shadow pipeline
•      Investment grade balance sheet with ample liquidity
•      Global leader in sustainability & best-in-class disclosures and transparency

 Briargate MOB                                                                            Colorado Springs, CO                          Shoreline Technology Center                                                                 San Francisco, CA
___________________________
1. Portfolio average lease duration calculated based on annualized base rent for senior housing triple-net, medical office, and life science and annualized Cash NOI for SHOP. SHOP average remaining lease duration assumed at 0.5 years.

                                                                                                                                                                                                                                             HCP, Inc.   9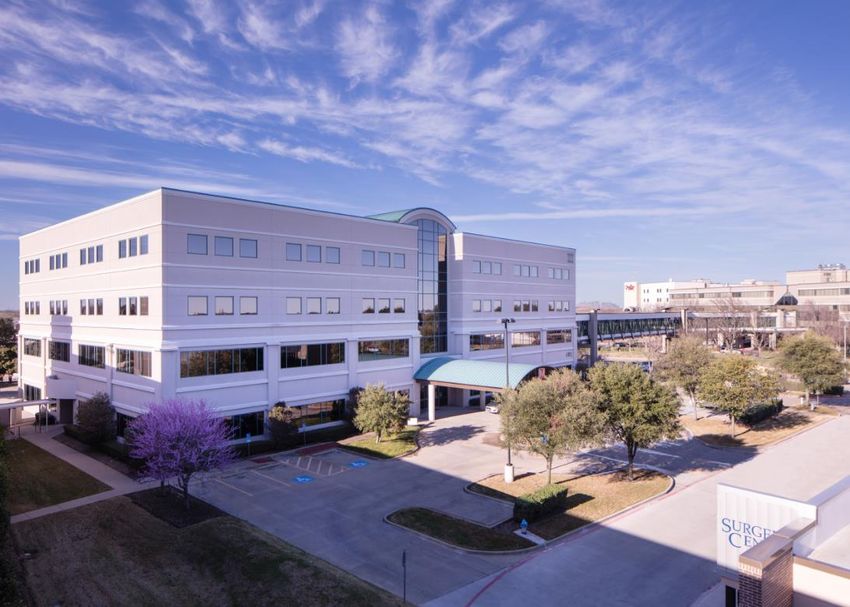
RECENT UPDATES

HCP, Inc.           Cypress Medical Office Building | Cypress, TX
RECENT UPDATES AND NEW INVESTMENTS
                                                                                                        On November 20, 2018, we closed on the sale of Shoreline Technology
                       ✔              Shoreline Tech Center                                             Center Campus in Mountain View, California for gross proceeds of ~$1.0
                                                                                                        billion
Recent Updates

                                                                                                        In November 2018, we redeemed our $450 million aggregate principal
                                                                                                        amount of 3.75% senior notes due in 2019 and repaid $224 million on our
                       ✔                     Debt Repayment                                             unsecured term loan with maturity in 2019 and $505 million on our
                                                                                                        revolving credit facility using proceeds from dispositions

                                                                                                         In November and December 2018 we raised ~$156 million of gross
                       ✔            Capital Markets Activity                                             proceeds under our At-The-Market (ATM) common stock offering
                                                                                                         program; additionally on December 10, 2018 we agreed to sell ~$500
                                                                                                         million of common stock in a public offering(1)

                                                                                                        On November 30, 2018, we acquired the remaining joint venture interests
                       ✔              Life Science JV Buyout                                            in four life science assets located in San Diego and San Francisco,
                                                                                                        California for $92 million; estimated stabilized cash cap rate of ~6.0%(2)
New Investments

                                                                                                         We are under contract to acquire Sierra Point Towers, a two building
                                                                                                         ~427,000 square foot office and life science campus located adjacent to
                        ✔                Sierra Point Towers
                                                                                                         HCP’s The Shore at Sierra Point development project in the life science
                                                                                                         submarket of South San Francisco for $245 million

                                                                                                         We are accelerating construction on additional phases of The Shore at
                                                                                                         Sierra Point to take advantage of our leasing progress at Phase I (100%
                        ✔          The Shore at Sierra Point                                             pre-leased) and the strength of the life science market; total costs for
                                                                                                         Phases II and III are approximately $382 million with expected
          ___________________________                                                                    stabilization in 2022(2)
          1. Please refer to the prospectus supplement we filed with the SEC on December 11, 2018 for additional details.
          2. See “Disclaimers” on page 2 for information on how we calculate estimated stabilized cash capitalization rate and stabilization.

                                                                                                                                                                     HCP, Inc.      11
NEW INVESTMENTS: LIFE SCIENCE JOINT VENTURE PARTNER BUYOUT
Attractive valuation, simplified ownership, expanded footprint in core markets
• In November 2018, we acquired our partner’s
43.5% minority interest in four life science
assets for a net price of $92 million
Purchase price represents an estimated
stabilized cash cap rate of ~6.0%(1)
• Transaction expands HCP’s life science
portfolio while eliminating the only
unconsolidated JV within the segment
• Portfolio Highlights
Torrey Pines: Two properties located in
the heart of Torrey Pines representing
131,000 square feet, 100% leased to
leading lab tenants in the strongest life
science submarket of San Diego.
South San Francisco: Two properties
totaling 169,000 square feet within HCP’s
wholly owned, four building Biotech
Gateway campus. The well-insulated,
multi-tenant campus is located in the heart
of South San Francisco and currently
undergoing a Class A repositioning and
modernization.
___________________________
1. See “Disclaimers” on page 2 for information on how we calculate estimated stabilized cash capitalization rate and stabilization.
HCP, Inc. 12NEW INVESTMENTS: SIERRA POINT TOWERS AND ADDITIONAL PHASES
OF THE SHORE
Adding to our density in South San Francisco
Investments Announced Dec 10, 2018 Existing HCP Assets
Sierra Point Towers (~427K sq. ft.)
Britannia Oyster Point I & II (~916K sq. ft.)
The Shore at Sierra Point(1) (~587K sq. ft.)
6000 Shoreline (~139K sq. ft.)
___________________________
1. Announced investment represents the acceleration of additional phases of The Shore at Sierra Point development.
HCP, Inc. 13SIGNIFICANT DENSITY IN A STRONG SUB-MARKET
Ability to integrate our two campuses and drive leasing and operational synergies
Under Contract
Sierra Point Towers
~427,000 sq. ft.
$245M investment
~100% leased
The Shore Phases II & III Rendering The Shore Phase I Rendering
~365,000 sq. ft. ~222,000 sq. ft., 100% pre-leased
$382M est. total cost $224M est. total cost
6-6.5% est. stabilized yield(1) 6-6.5% est. stabilized yield(1)
___________________________
1. See “Disclaimers” on page 2 for information on how we calculate estimated stabilization yield.
HCP, Inc. 14NEW INVESTMENTS: SIERRA POINT TOWERS AND ADDITIONAL PHASES
OF THE SHORE
Ability to integrate our two campuses and drive leasing and operational synergies
SIERRA POINT TOWERS THE SHORE AT SIERRA POINT DEVELOPMENT
• HCP is under contract to acquire Sierra Point • Development site encompassing five buildings
Towers, an ~427,000 square foot, two-building totaling ~587,000 square feet
office and life science campus located in the core
• Phase I commenced in Q4 2017 and is currently
life science submarket of South San Francisco
100% pre-leased
$245 million purchase price; expected closing
Consists of ~222,000 square feet with an
in H1 2019
estimated cost of $224 million (expected to
~100% leased with more than 5 years of deliver in late 2019)
average remaining lease term
Projected cash capitalization rate of ~6.0%(1)
• Based on the leasing progress for Phase I and
continued market demand, we are accelerating
in 2020
commencement of the remaining two phases
• Significant excess surface parking creates long-
term densification opportunities
• Phases II & III represent ~365,000 total square
feet with an estimated cost of $382 million
(expected stabilization in 2022)(1)
~100% leased with expected long-term upside and 23-acre campus offering state-of-the-art lab and
potential future density at an attractive cap rate office space and amenity base
___________________________
1. See “Disclaimers” on page 2 for information on how we calculate estimated cash capitalization rate and stabilization.
HCP, Inc. 15DEVELOPMENT OVERVIEW HCP, Inc. 75 Hayden (Rendering)| Boston, MA
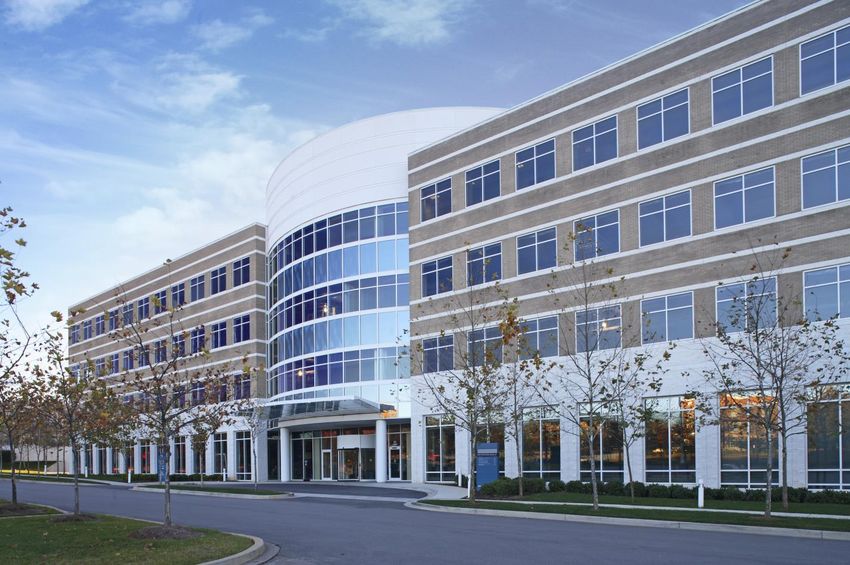
HCP DEVELOPMENT PLATFORM OVERVIEW
•    Development remains an attractive opportunity and HCP has a robust pipeline expected to create significant
     value over time
•    Funding of projects expected to continue via capital recycling

DEVELOPMENT SPEND BY YEAR
$ in millions

    $400                                                                Expect significant earn-in
                                                                       benefit from leasing success
    $350                                                                   of current pipeline
                                                                                                          $300
    $300                                                                                                   to
                                                                                                          $400
                                                                                            $290
    $250
                                                            $230          $240
    $200

    $150
                                             $160
    $100

     $50        $23
                              $40
      $0
                                                                                                        2019-2021
                2013          2014           2015           2016          2017        Expected 2018   Target Next 3
                                                                                                      Target Per Year
                                                                                                          Years
                                                                                                        Dev Spend

      HCP has methodically increased development spending over the past three years and is
         targeting an average spend of $300-$400 million per year over the next 3 years

                                                                                                      HCP, Inc.     17
ACTIVE DEVELOPMENT PIPELINE
ACTIVE DEVELOPMENT PROJECTS(1)
Total Cost to Remaining Leasable Percent Est. Date of Est. Stab. Yield Stabilized Cash
Project Market
Costs ($M) Date(2)($M) Costs ($M) Area (000s) Leased Stab. Occ. Range(3) NOI ($M)
(4)
Ridgeview San Diego $63 $58 $4 306 SF 100% Q2 2019 5.5% - 6.0% $4
The Cove Phase III San Francisco 237 145 92 324 SF 100% Q3 2019 9.0% - 9.5% 22
Sorrento Summit San Diego 17 3 14 28 SF 100% Q3 2019 7.7% - 8.2% 1
The Cove Phase IV San Francisco 107 26 82 164 SF 100% Q1 2020 9.0% - 9.5% 10
The Shore Ph. I(5) San Francisco 224 86 138 222 SF 100% Q1 2020 6.0% - 6.5% 14
(5)(6)
The Shore Ph. II & III San Francisco 382 53 329 365 SF - Q1 2022 6.0% - 6.5% 24
Grand Strand MOB Myrtle Beach 26 0 26 90 SF 47% Q4 2022 7.0% - 7.5% 2
75 Hayden Boston 160 35 126 214 SF - Q4 2022 7.4% - 7.9% 12
(7)
Total/Weighted Average $1,215 $406 $809 1,713 SF 63% 7.0% - 7.5% $89
Denotes recently added development projects
PROJECT RENDERINGS
Sorrento Summit San Diego The Shore San Francisco 75 Hayden Boston
___________________________
1. Excludes unconsolidated joint venture developments. Total Costs, Remaining Costs, Estimated Date of Stabilized Occupancy and Estimated Stabilized Yield Range are based on based on management’s estimate and are forward looking.
2. Cost to date represents Construction in Process balance of 9/30/18.
3. See “Disclaimers” on page 2 for information on how we calculate estimated stabilized yield.
4. Represents projected stabilized cash NOI following lease-up and expiration of any free rents; economic stabilization typically occurs three to six months following stabilized occupancy. Cash NOIs presented in the table may not sum due to rounding.
5. Development costs and returns inclusive of legacy pre-development site work and capitalized interest which resulted in a higher land basis; yield assuming a market value of land would be approximately 100 basis points higher. Additionally, Phase I includes costs
associated with construction of campus-wide amenity space while Phase II includes costs associated with a parking structure.
6. Cost to date represents the book value of land held for development as of 9/30/18.
7. Represents total for: Total Costs, Cost to Date, Remaining Costs and Leasable Area. Percent Leased is weighted by leasable area. Est. Stab. Yield Range is weighted by Total Costs.
HCP, Inc. 18SIGNIFICANT EARN-IN OPPORTUNITY FROM ACTIVE PIPELINE
Development Deliveries Will Compliment Our Organic Earnings Growth(1)
EXPECTED INCREMENTAL CASH NOI BY YEAR FROM CURRENT DEVELOPMENT PIPELINE(2)(3)
$ in millions
$100
$12 $89
$19
$75
Almost $90M NOI Opportunity
$22
$50
$27
$25
$8
$0
2019 2020 2021 2022 2023 NOI Potential
Development pipeline is expected to generate an incremental $89 million of cash NOI over
the next five years
___________________________
1. FFO earn-in will include incremental development NOI partially offset by a reduction in capitalized interest.
2. Excludes unconsolidated joint venture developments.
3. Incremental cash NOI by year shown above excludes the impact of contractual rent escalators; including this, contractual cash NOI growth would result in an additional ~$3 million of NOI potential.
HCP, Inc. 19VALUE CREATION FROM DEVELOPMENT
✔ Pipeline Expected to Drive ✔ Dev Yield Expected to Generate a ✔ Projects Totaling $648M are
~$557M of Value Creation ~225bps Spread Over Market Cap Rates 100% Pre-Leased
ACTIVE DEVELOPMENT PIPELINE(1) ILLUSTRATIVE NAV CREATION FROM ACTIVE DEVELOPMENTS
$ in millions
Costs Percent Est. Stab. Yield Market Cap
Project (2) (3)
($M) Leased Range Rate Range
Ridgeview $63 100% 5.5% - 6.0%
~$557 $1,772
Cove Phase III 237 100% 9.0% - 9.5%
Sorrento Summit 17 100% 7.7% - 8.2% ~$1.13/sh of
$1,215 Value Creation
Cove Phase IV 107 100% 9.0% - 9.5%
Sierra Point I(4) 224 100% 6.0% - 6.5%
(4)
Sierra Point II & III 382 - 6.0% - 6.5%
Grand Strand 26 47% 7.0% - 7.5%
75 Hayden 160 - 7.4% - 7.9%
Active Projects $1,215 63% 7.0% - 7.5% 4.5% - 5.5%
Land and Value Creation(5) Stabilized Value(6)
Denotes recently added development projects Development Costs
In-Process Developments are a Source of Future NAV Growth
___________________________
1. Excludes unconsolidated joint venture developments.
2. See “Disclaimers” on page 2 for information on how we calculate estimated stabilized yield.
3. Represent estimated range of fair market cap rates at stabilization.
4. Development costs and returns inclusive of legacy pre-development site work and capitalized interest which resulted in a higher land basis; yield assuming a market value of land would be approximately 100 basis points higher. Additionally, Phase I includes costs
associated with construction of campus-wide amenity space while Phase II includes costs associated with a parking structure.
5. Value creation defined as the undiscounted stabilized cash NOI divided by current market cap rate less cost of development.
6. Assumes developments generate an approximate 7.0% to 7.5% cash yield and the resulting cash NOI is valued at the mid-point of the fair market cap rate of 4.5 to 5.5%.
HCP, Inc. 20CASE STUDY: THE COVE AT OYSTER POINT
~$540 Million of Value Creation(1)
Phase III
100% Leased
Phase II
100% Leased
Phase IV
100% Leased
Upscale Hotel
✔ ✔ ✔ ✔
PHASE I | 100% OCCUPIED PHASE II |100% OCCUPIED PHASE III | 100% LEASED PHASE IV | 100% LEASED
$200M Development Cost $245M Development Cost $237M Development Cost $107M Development Cost
247,000 Square Feet 231,000 Square Feet 324,000 Square Feet 164,000 Square Feet
Stabilized Cash NOI: $15M Stabilized Cash NOI: $16M Stabilized Cash NOI: $22M Stabilized Cash NOI: $10M
Completed Completed Active Development Active Development
___________________________
Note: The rendering is representative of the campus tenant base; not all tenants are included in the illustration.
1. Stabilized cash NOI valued at the estimated fair market cap rate of 4.75% less total development costs including land.
HCP, Inc. 21LIFE SCIENCE LAND BANK AND ENTITLEMENTS
Approximately 600,000 square feet of potential future
development opportunity on fully-entitled land
Land bank is comprised of sites located in the key West Coast
life science markets of San Francisco and San Diego
Plan to methodically activate land bank over time as leasing
progress and market conditions warrant
KEY FUTURE LIFE SCIENCE DEVELOPMENT OPPORTUNITIES
Est. Rentable Book Value
Project Market
Sq.Ft. (in 000s) ($M)
Forbes Research Center San Francisco 326 $47
Modular Labs III San Francisco 106 11
Torrey Pines Science Center San Diego 93 12
Directors Place San Diego 82 6
Total Life Science Land Bank 607 76
Forbes Research Center (Rendering) San Francisco
Entitled land bank represents a shadow development pipeline in excess of $420 million(1)
___________________________
1. Assumes an average cost per square foot of ~$700.
HCP, Inc. 22ACTIVE REDEVELOPMENT
• Our portfolio has approximately $100+ million per year embedded redevelopment potential over the next
few years
• We target average cash-on-cash returns of 9 to 12% for these low-risk redevelopment opportunities
BEFORE AFTER
LIFE SCIENCE
Wateridge
San Diego, CA
$14M project cost
~10+% return on cost(1)
MOB
Aurora Medical Office
Denver, CO
$8M project cost
~10+% return on cost(1)
SENIOR HOUSING
Atria Woodbridge
Irvine, CA
$9M project cost
~10+% return on cost(1)
___________________________
1. Represents estimated stabilized cash-on-cash return.
HCP, Inc. 23PORTFOLIO HIGHLIGHTS HCP, Inc. Seaport Plaza | Redwood City, CA
HCP’S PREMIER REAL ESTATE PORTFOLIO

Medical City Dallas         Medical Office/Hospital    Britannia Oyster Point         Life Science    Greenville Portfolio            Medical Office
Dallas, TX                                Stabilized   San Francisco, CA                Stabilized    Greenville, SC                     Stabilized

Hayden Research Campus                 Life Science    The Cove At Oyster Point       Life Science    The Shore at Sierra Point         Life Science
Boston, MA                         Value-Add / Dev.    San Francisco, CA          Stabilized / Dev.   San Francisco, CA                Development

                                                                                                                              B
                                                                                                                              L
                                                                                                                              D
                                                                                                                              G
                                                                                                                              .
                                                                                                                              A

Swedish First Hill Campus            Medical Office    Sorrento Summit                Life Science    Centennial Campus               Medical Office
Seattle, WA                             Stabilized     San Diego, CA               Redevelopment      Nashville, TN                      Stabilized

                                                                                                                                  HCP, Inc.            25
MEDICAL CITY DALLAS
Fully Integrated, Highly Specialized 2M Square Foot Campus
32-acre medical campus located within
Park Central in North Dallas, TX
(acquired in 2007)
2M sq. ft. fully integrated medical
office, outpatient, inpatient hospital
campus
Four medical office buildings
representing 750K sq. ft.
1.3M sq. ft. hospital with over 700 beds;
generated ~$5B in 2017 gross patient
revenues
Lease structure allows HCP to share in
the expansion and success of the
hospital
Cash NOI yield on undepreciated book
has increased from ~7% in 2007 to
~9% today
Nationally acclaimed hospital leased
and operated by leading publicly-traded
operator HCA
Represents annualized Q3 2018 cash
Dallas, TX MOB & Hospital NOI of $37 million
HCP, Inc. 26MEDICAL CITY DALLAS (CONT’D)
Fully Integrated, Highly Specialized 2M Square Foot Campus
Hospital Medical Office Hospital
Medical Office
Medical Office
HCP, Inc. 27BRITANNIA OYSTER POINT
Prime South San Francisco Bayfront Campus
• Located in a leading market
for biotechnology research
and development
• ± 900K sq. ft. campus of
office and lab on the South
San Francisco Bayfront
• Strong credit tenant base
including Amgen, Intrexon,
Janssen Research &
Development
• Represents annualized Q3
San Francisco, CA Life Science
2018 cash NOI of $66 million
HCP, Inc. 28BRITANNIA OYSTER POINT (CONT’D)
Prime South San Francisco Bayfront Campus
The Cove Campus
1 Million Sq. Ft.
100% Leased
HCP, Inc. 29GREENVILLE PORTFOLIO
95% On Campus MOB Portfolio with the Largest Health System in South Carolina
• 13 MOBs totaling 832,000 square
feet and 95% on-campus
• Portfolio anchored by A-rated
Greenville Health System, which
leases 94% of the square footage
and is the largest health system
in South Carolina
• Greenville is the largest MSA in
South Carolina and a favorable
business climate is driving
continued growth
• Acquired in 2018 and
subsequently contributed to a
joint venture with Morgan
Stanley Real Estate Investing
Greenville, SC Medical Office
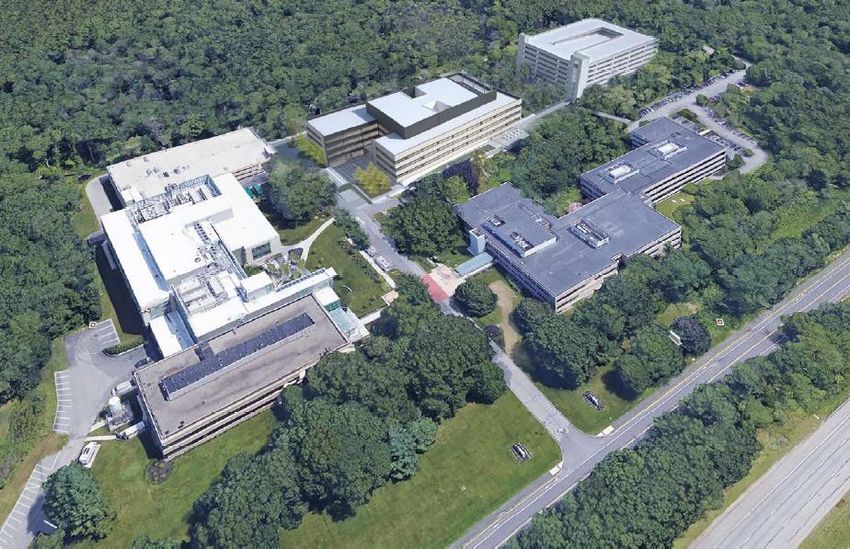
HCP, Inc. 30HAYDEN RESEARCH CAMPUS
A ‘Go-To’ Life Science Destination in Suburban Boston
Distinct value proposition for
tenants with direct access to
Cambridge and downtown Boston (9
miles northwest)
± 600K total sq. ft. state-of-the-art
Class A office and lab
Launched $160M, 214K sq. ft.
campus expansion in 2Q 2018;
expect to generate a yield between
7% and 8% and deliver in 2020
Leading biopharma tenants
including Shire and Merck (43% of
sq. ft.)
Execution of value-add strategy and
campus repositioning
100% leased (66% at acquisition)
Embedded growth opportunities
with mark-to-market leasing and
potential office to lab conversions
Represents $25 million of estimated
Boston, MA Life Science annual cash NOI upon stabilization(1)
___________________________
1. Estimated based on annual NNN market rates for office use in the high $20s PSF and market rate ranges for laboratory space in the high $40s to low $50s PSF. Office space on campus represents ~180K sq. ft., existing laboratory and office mix of 215K sq. ft., and
future mixed lab and office development of 214K sq. ft.
HCP, Inc. 31HAYDEN RESEARCH CAMPUS (CONT’D)
A ‘Go-To’ Life Science Destination in Suburban Boston
65 Hayden
3 Buildings 2 Parking Structures 2 Cafes, Fitness, Bike Storage, Showers
Including one potential future build-out 2.4 per 1,000 sq. ft. (one future build-out) Enhanced amenity base
± 600K Square Feet Route 2 and 128
Includes 214K sq. ft. of active development 9 miles northwest of Cambridge, easy access via shuttles to Alewife Red Line T-Stop
HCP, Inc. 32THE COVE AT OYSTER POINT
Fully Integrated, Best-in-Class Life Science Campus
• Best-in-class ± 1M sq. ft. Life Science
campus with state-of-the-art
laboratory, office and amenities;
resetting standards for design and
quality
LEED Silver rating with rich
amenity profile including food
service, fitness, retail and an
upscale hotel
• Successfully executed the first two of
four phase development; phases III
and IV expected to deliver in early
2019 and 2020, respectively
• 100% leased across the campus to
tenants such as: AstraZeneca, Five
Prime and Denali
Anticipate combined yield across
all phases between 7.5% to 8.5%
• Represents $63 million of estimated
San Francisco, CA Life Science annual cash NOI upon completion
HCP, Inc. 33THE SHORE AT SIERRA POINT
Creating a World Class Life Science Destination
• 23-acre waterfront site with world
class campus design, offering state-of-
the-art laboratory and office space and
premier amenity base
Includes five buildings totaling
~587,000 square feet
• Located within a short distance of The
Cove and Oyster Point campuses,
creating a truly differentiated Life
Science destination
• Commenced Phase I of the multi-phase
development in 2018
Phase I consists of 222K sq. ft. with
an estimated cost of $224 million
(expected to deliver in late 2019)
Phase I 100% leased
• Accelerating commencement of Phase
II and III based on market demand
Phases II & III represent ~365,000
total square feet with an estimated
cost of $382 million (expected
stabilization in 2022)
San Francisco, CA Life Science
• Campus represents $38 million of
estimated annual cash NOI upon
completion(1)
___________________________
1. Estimated based on annual NNN market rates for new laboratory and office in the high $50s to low $60s PSF.
HCP, Inc. 34SWEDISH FIRST HILL CAMPUS
Trophy Four Building On-Campus Portfolio Located in Seattle’s “Pill Hill”
• Four-building 550K sq. ft. on-
campus medical office portfolio
centrally located in Seattle’s First
Hill neighborhood, nicknamed
“Pill Hill” for its high
concentration of hospitals
All MOBs have direct access to
hospital
• Located on Swedish’s main
Seattle campus
Swedish is the largest not-for-
profit system in the Seattle
area
• Historically strong occupancy in
the 95+% range(1)
• Generates annualized Q3 2018
cash NOI of $21 million
Seattle, WA Medical Office
___________________________
1. Occupancy for the campus was 93% as of 9/30/18, which includes Nordstrom Tower, an active redevelopment project. Excluding Nordstrom Tower, the campus was 99% leased as of 9/30/18.
HCP, Inc. 35SWEDISH FIRST HILL CAMPUS (CONT’D)
Trophy Four Building On-Campus Portfolio Located in Seattle’s “Pill Hill”
1101 Madison Tower
Swedish First Hill Campus
Arnold Medical Pavilion
Sky Bridge
Swedish Nordstrom Medical Tower
Access Tunnel
600 Broadway
First Hill Street Car
Swedish Campus HCP On-Campus MOB Public Transit Line
HCP, Inc. 36SORRENTO SUMMIT
Fully Customized, Modern Build-to-Suit and Expansion
• ± 250K sq. ft. single tenant campus
Includes tenant expansion into
additional ~80K sq. ft., with a
campus-wide modernization
program and additional 28K sq. ft.
cutting-edge amenities building
Enhancements to include outdoor
collaboration, dining and seating
space, a surgical suite, in addition
to fitness and conference centers
• 15-acre campus with peak, hilltop
positioning provides extensive views
to the Pacific Ocean and suburban San
Diego market
• Well-established medical device
company, NuVasive, will occupy the
entire campus
• Represents $8 million of estimated
San Diego, CA Life Science annual cash NOI upon completion(1)
___________________________
1. Estimated based on publicly available lease agreement which includes existing leased space, future expansion space and build-to-suit (expected to be completed in Q3 2019).
HCP, Inc. 37SORRENTO SUMMIT (CONT’D)
Fully Customized, Modern Build-to-Suit and Expansion
HCP, Inc. 38CENTENNIAL MOB
On-Campus Portfolio Driving Above-Market Fundamentals
• Seven-building 615K sq. ft. on-
campus medical office cluster
strategically located in prime
Nashville market
• Located at HCA’s Centennial
Medical Center which includes
three acute care hospitals
Approximately 650 beds and
30K admissions per year
• 100% leased across campus with
tenants that include HCA,
Pediatric Association of Davidson
Co., Sterling Primary Care, and
Premier Orthopedics
• Generates annualized Q3 2018
cash NOI of $12 million
Nashville, TN Medical Office
HCP, Inc. 39SEGMENT OVERVIEWS HCP, Inc. Plano MOB III | Plano, TX
LIFE SCIENCE

HCP, Inc.      Hayden Research Campus | Boston, MA
LIFE SCIENCE
Demographic Trends Driving Health Care Needs

           The combination of increased life expectancy with an associated increase in chronic conditions and
                       escalating healthcare costs is driving growth in the life science industry

                                                                                                                                                U.S. LIFE SCIENCE
       U.S. AVERAGE LIFE EXPECTANCY                                                             CHRONIC DISEASE MORTALITY                  VENTURE CAPITAL INVESTMENT

    (Years)                                                                                                                             ($ in billions)

                                                                       79                                                               $40
    80
                                                                                                                                                                           $35
                                                                                                                      ~50% of
              70                                                                                                     U.S. adults        $30         V.C. Investments
    70                                                                                                                live with                          Doubled
                                                                       72
                                                                                                                       chronic
                                                                                                                     conditions         $20               $18

    60
                                                                                                                                        $10

              53
    50
                                                                                                                                          $0
                                                                                                      Chronic Disease Mortality
                                                                                                                                                   2008 - 2012         2013 - 2017
                                                                                                      Other Causes

                    U.S. Life Expectancy
                    Worldwide Life Expectancy

___________________________
Source: World Bank, Centers for Medicare & Medicaid Services, Rand Corporation, World Health Organization and PwC MoneyTree, Q4 2017.

                                                                                                                                                                       HCP, Inc.     42
LIFE SCIENCE
Innovation Attracting Capital and Requirements for Space
Venture capital funding continues to rise with a majority of capital funding targeted for core clusters in
California and Massachusetts where supply is constrained and demand for space is high
CALIFORNIA & MASSACHUSETTS SHARE OF LIFE SCIENCE VENTURE CAPITAL INVESTMENTS(1)
$ in billions
CA & MA represent
$2.5
~70% of investment
$2.0
$1.5
$1.0
$0.5
$0.0
2008 2009 2010 2011 2012 2013 2014 2015 2016 2017
California & Massachusetts All Other States
U.S. METROPOLITAN LIFE SCIENCE MARKETS(2)
Core Clusters San Francisco-
Average Rent Per Sq. Ft.
San Jose Bay Area
Boston-Cambridge $60
$45
San Diego
New Jersey
Raleigh Durham $30
Philadelphia
$15
$0
25.0% 20.0% 15.0% 10.0% 5.0% 0.0%
% Vacancy Rate
___________________________
Source: PwC MoneyTree, Q4 2017 and CBRE.
1. Life Science investments represent Biotech, Disease Diagnosis, Drug Delivery, Drug Discovery, Drug Development, Drug Manufacturing and Pharmaceuticals / Drugs.
2. Bubbles represent size of metro lab inventory.
HCP, Inc. 43LIFE SCIENCE
Class A Real Estate in Premier Life Science Epicenters
81%
107 / 94% 7M 96% $257M
On-Campus
Properties (1) / Affiliated Square Feet (1) Occupancy Cash NOI(2)
San Francisco San Diego Boston
Irreplaceable real estate
Preeminent Life Science real estate Focused, value-add market
strategically positioned in leading
owner in South San Francisco with positioning with a pathway for
biotechnology hotbed with more
nearly 30% share growth
than 15% market share
69 3.7M 28 1.9M 2 400K
Properties (1) Square Feet (1) Properties Square Feet Properties Square Feet (3)
___________________________
Note: Salt Lake City and Durham properties are included within portfolio totals. Figures as of 3Q 2018 unless otherwise noted.
1. Pro forma for the disposition of Shoreline Technology Center.
2. Represents annualized Q3 2018 cash NOI pro forma for the disposition of Shoreline Technology Center ($35M of annualized NOI).
3. Property count and square footage excludes 75 Hayden development, a 214,000 square feet Class A development located at our Hayden Research Campus.
HCP, Inc. 44LIFE SCIENCE
Class A Real Estate in Premier Life Science Clusters
The Cove at Oyster Point 1M Britannia Oyster Point 900K Seaport Center 600K
San Francisco, CA square feet San Francisco, CA square feet Redwood City, CA square feet
Fully integrated, best-in-class life science campus Prime 900K sq. ft. campus located on the South San Bayside campus centrally located near major academic
resetting standards for design and quality Francisco Bayfront institutions
Hayden Research Campus 600K Torrey Pines Science Park 650K Sorrento Summit 250K
Boston, MA square feet San Diego, CA square feet San Diego, CA square feet
State-of-the-art Class A campus positioned as the go-to Strategically positioned campus in the heart of the leading Fully customized, modern build-to-suit with peak, hilltop
life science destination in suburban Boston San Diego submarket positioning and extensive views
___________________________
Figures shown are rounded. Square footage may include on-going or potential future developments.
HCP, Inc. 45MEDICAL OFFICE HCP, Inc. 2201 Medical Plaza | Nashville, TN
MEDICAL OFFICE
Point of Care Evolution Driven By Aging Patients

  Demand for outpatient care outpaced inpatient services for the first time in 2015, as an older patient population
that requires more consistent care has recognized the advantages of shorter duration, lower price-point office visits

                    AGE 65+ POPULATION                                    COST EFFECTIVE CARE               ANNUAL MEDICAL VISITS

      (in Millions)                                                % of Net Patient Revenue

                                                                                                                                      6.6
      70                                                           54%         Patients have a preference                            Visits
              19%
               40%increase byby
                    increase  2030
                                2030                                             for outpatient services
                                                                   52%
      65      8% increase by 2025
                                                                   50%                                                    3.7
                                                                                                                         Visits
                                                                                                              2.7
                                                                                                             Visits
      60                                                           48%

                                                                   46%
      55
                                                                   44%
                                                                          2012 2013 2014 2015 2016 2017      65
      50
                                                                               Outpatient Revenue
                     2018                  2025             2030                                                      Age Group
                                                                               Inpatient Revenue

___________________________
Source: National Ambulatory Medical Care Survey, Revista.

                                                                                                                                  HCP, Inc.   47
INDUSTRY-LEADING ON-CAMPUS MEDICAL OFFICE PORTFOLIO
268 Properties Comprised of 19 Million Square Feet
80%+ 82% / 94% 92%+
Specialty Focused
On-Campus / Affiliated Consistent Occupancy
Physicians(1)
% of Cash
Top 10 Markets(2) Sq. Ft.
NOI
Dallas 12% 2.3M
Houston 11% 2.8M
Seattle 8% 700K
Denver 7% 1.1M
Nashville 6% 1.3M
Louisville 5% 1.0M
Greenville 5% 800K
Philadelphia 4% 1.0M
Salt Lake City 4% 800K
HCP’s Top 10 Market Phoenix 4% 700K
Additional Markets Top 10 Markets 66% 12.5M
___________________________
1. Represents percentage of physician tenants classified as non-primary care.
2. Pro forma for a full quarter of income from the Greenville Health System acquisition, which closed during Q3 2018.
HCP, Inc. 48MEDICAL OFFICE
Strong Relationships Drive Steady Performance
HISTORICAL SAME-PROPERTY OCCUPANCY KEY RELATIONSHIPS
Occupancy %
95%
90%
#2 Ranked Health System(1)
85%
91% 92% 93% 91% 91% 92% 92% Largest for-profit hospital
operator
80% 40% of HCP’s medical office
square footage affiliated
with HCA
75%
2011 2012 2013 2014 2015 2016 2017
HISTORICAL SAME-PROPERTY CASH NOI GROWTH
% Growth
4%
3%
Largest non-profit health
2%
system in southeast Texas
A1 investment-grade credit
3% 3% 3% rating
3%
1% 2% 2% 2%
9% of HCP’s medical office
square footage affiliated
with Memorial Hermann
0%
2011 2012 2013 2014 2015 2016 2017
___________________________
1. Ranked by revenue based on the 2016 Modern Healthcare’s Systems Financial Database.
HCP, Inc. 49MEDICAL OFFICE
High Tenant Satisfaction and Strong Retention
• Tenant satisfaction continues to outperform the Kingsley Index
• Strong locations and service drive retention and limit tenant turnover and related capital expenditures
TENANT SATISFACTION (0 TO 5 SCALE)(1) HCP’S TENANT RETENTION
4.5 85%
HCP Kingsley Index 4.4
4.4 83% 83%
4.3 83%
4.3 81%
4.2
4.2 80%
4.2
4.2 79%
4.2 4.2
78%
4.1 4.1 4.1 4.1
4.0 75%
2014 2015 2016 2017 2018 2014 2015 2016 2017
High Tenant Satisfaction Leads to High Tenant Retention Over Time
___________________________
1. Kingsley Associates’ tenant survey measuring tenant satisfaction with medical office landlords on a 0 to 5 scale, with 5 representing the highest level of tenant satisfaction.
HCP, Inc. 50MEDICAL OFFICE TENANT MIX
Focus on Specialty Physicians Differentiates Our Portfolio
• Our disproportionately high percentage of specialty physicians reflects our on campus focus and insulates our portfolio from
evolving lower acuity healthcare delivery locations such as neighborhood urgent care centers and telemedicine
PORTFOLIO TENANCY(1) PHYSICIAN SPECIALTY
U.S. Patient
Physicians 46%
HCP Care
Physicians(3)
Ancillary Medical Services(2) 31%
Other Support Services 23% Specialties 81% 67%
Primary Care 19% 33%
Types of Specialties:
Obstetrics / Gynecology 9% 5%
Leased Directly to
Hospital 48% Ambulatory Surgery Center 8% N/A
General / Specialty Surgery 8% 7%
Imaging / Radiology 8% 3%
Non-Hospital
Leased 52% Orthopedics 8% 4%
Cardiovascular 7% 4%
Oncology 3% 3%
Neurology 3% 2%
Gastroenterology 3% 2%
Physicians 68%
Other 24% 37%
Ancillary Medical Services 17%
Total Specialists 81% 67%
Other Support Services 15%
___________________________
1. Excludes some master leased properties due to data accessibility. Also excludes the Greenville Health System portfolio acquired subsequent to Q2-2018.
2. Non-hospital ancillary medical includes services such as labs, imaging, dialysis and physical therapy, among others.
3. U.S. physicians breakdown from AAMC, 2016 Physician Specialty Data Book.
HCP, Inc. 51MEDICAL OFFICE
Premier On Campus Presence
Seattle Swedish Campus 550K Centennial Campus 615K Sky Ridge Campus 350K
Seattle, WA square feet Nashville, TN square feet Denver, CO square feet
Four on-campus MOBs located on “Pill Hill” in Seattle Seven on-campus MOBs at HCA’s flagship hospital campus Three on-campus MOBs in high-growth Denver suburb
with strong rental growth
Woodlands Campus 400K Denver Swedish Campus 300K St. Matthews Campus 400K
Houston, TX square feet Denver, CO square feet Louisville, KY square feet
Four on-campus MOBs; 100% master leased to Memorial Four multi-tenant on-campus MOBs, achieving strong growth Four on-campus MOBs where Norton Healthcare recently
Hermann for 10 years through occupancy and rental rates invested $120 million in expansion upgrades
HCP, Inc. 52HOSPITAL PORTFOLIO
Hoag and Medical City Dallas Hospitals Account For ~50% of Hospital Cash NOI
7.3x 71% 1.5% to 2.5%
Cash NOI from 4 Avg. NNN Annual Rent
EBITDAR Lease Coverage(1)
Acute-Care Hospitals(2) Escalators
Enter your text here
Line 2
Hoag Hospital Irvine, CA Medical City Dallas Dallas, TX
___________________________
1. EBITDAR lease coverage is for the trailing 12-months ended September 30, 2018, reported one quarter in arrears.
2. Based on Q3 2018 Cash NOI.
HCP, Inc. 53SENIOR HOUSING HCP, Inc. The Solana at Deer Park | Deer Park, IL
SENIOR HOUSING
Long-term Fundamentals Position Segment for Success Over Time

 Increased product awareness and acceptance combined with increasing longevity will drive a dramatic increase
     in demand over time. New supply and higher labor costs are weighing on the industry in the near term.

                                                                                                          STEADILY INCREASING
                 AGE 80+ POPULATION                                                                                                                    NASCENT INDUSTRY
                                                                                                          PENETRATION RATES(1)

   (in Millions)                                                                               % Penetration                                Senior Housing Units (000s)

    20                                                                                                                                      1,800
                56% increase by 2030                                                            13%

    18

                                                                                                12%                                         1,200
    16          23% increase by 2025

    14
                                                                                                11%                                          600

     12
                                                                                                                  Actual         Forecast
    10                                                                                         10%                                              0
                Current                 2025E                 2030E                                                                                  Independent      Assisted   Total SH
                                                                                                                                                        Living         Living    Industry

___________________________
Source: US Census, American Community Survey (ACS).
1. Penetration rate from 2009-2017 is based on NIC data. Projected penetration rates based on Green Street Advisors estimates.

                                                                                                                                                                           HCP, Inc.        55
DIVERSIFIED SENIOR HOUSING PORTFOLIO(1)
~80% of NOI from East Coast, West Coast, Texas and Denver
223 25,200 90%
Communities Units NOI from NIC-99
Denver 6%
West Coast
17%
East Coast
43%
Texas
13%
Balanced mix of triple-net and operating communities
___________________________
1. Metrics and geographic exposure are as of Q3 2018 cash NOI and are pro forma to reflect the Brookdale transaction and certain other previously announced sales. Excludes unconsolidated joint ventures and CCRC portfolio.
HCP, Inc. 56SENIOR HOUSING PORTFOLIO MIX(1)
Well-Balanced Combination of Strong Operators & Locations
HCP’S CASH NOI BY OPERATOR TOP 10 MARKETS
(2)
Cash NOI by Market
Markets
Transitions Total NNN SHOP
& Other
18% Washington DC 9% 11% 6%
Houston 7% 1% 21%
HRA Brookdale New York 7% 9% 2%
5% 35%
Denver 5% 4% 9%
Aegis
Chicago 5% 4% 8%
5%
Philadelphia 4% 5% 2%
Atria Los Angeles 3% 4% 2%
8%
Dallas 3% 4% 3%
Miami 3% 1% 8%
Sunrise
Seattle 3% 3% 2%
29%
Top 10 Markets 50% 44% 64%
Balanced mix of operators with diverse exposure to high barrier to entry and high growth markets
___________________________
1. Cash NOI by market is based on Q3 2018 Cash NOI as of 9/30/18 pro forma to reflect the MTCA and certain other previously announced sales. Pro forma Cash NOI is further adjusted to reflect dispositions as if they occurred on the first day of the quarter. Excludes
unconsolidated joint ventures and CCRC portfolio.
2. Total Top-10 market percentages may not add due to rounding.
HCP, Inc. 57SENIOR HOUSING
Premier Real Estate in Leading Markets
Sunrise Beverly Hills Sunrise Mill Basin The Quadrangle
NNN NNN NNN
Beverly Hills, CA Brooklyn, NY Haverford, PA
95+% occupied AL / MC property located in the heart of Infill community with beautiful views of Jamaica Bay and 90+% occupied community situated 12 miles west of
Beverly Hills wide range of local amenities Philadelphia city-center in an affluent submarket
Atria Woodbridge Sonata Boca Raton Residence at Watertown
SHOP SHOP SHOP
Irvine, CA Boca Raton, FL Watertown, MA
Resort-style community with superb services and Amenity rich facility that combines homelike environment Luxury infill community with modern design and amenities
amenities in affluent neighborhood with impeccable design serving residents in Boston
HCP, Inc. 58You can also read