ENTERIC PATHOGENS IN WATER SOURCES AND STOOLS OF RESIDENTS IN THE VENDA REGION OF THE LIMPOPO PROVINCE
←
→
Page content transcription
If your browser does not render page correctly, please read the page content below
ENTERIC PATHOGENS
     IN WATER SOURCES AND STOOLS
   OF RESIDENTS IN THE VENDA REGION
          OF THE LIMPOPO PROVINCE

            Report to the Water Research Commission

                              by

 Chikwelu Larry Obi, Natasha Potgieter and Pascal Obong Bessong
                  Department of Microbiology
         University of Venda for Science and Technology
       Private Bag X5050, Thohoyandou, 0950, South Africa

WRC REPORT NO. 1126/1/05
ISBN NO.: 1-77005-192-9

                          JUNE 2005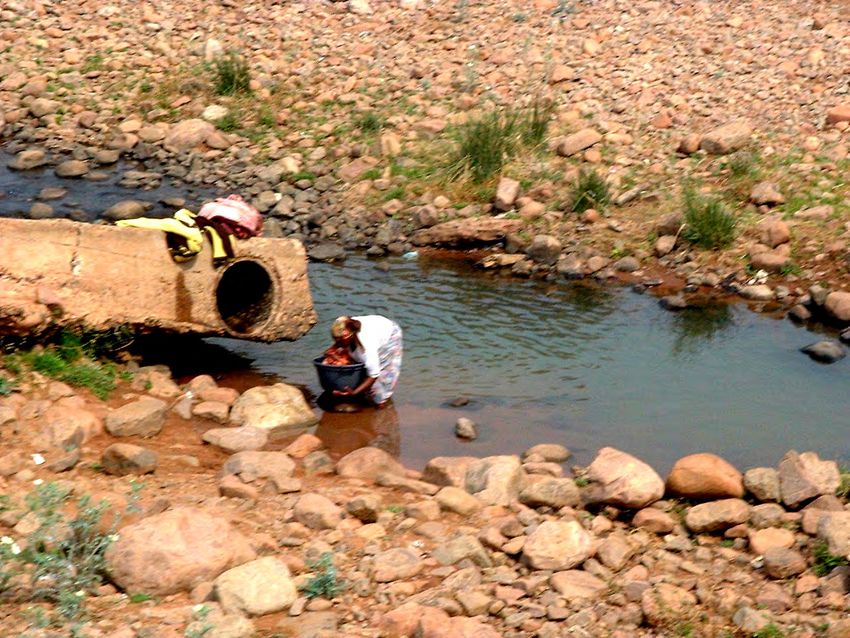
Disclaimer

This report emanates from a project financed by the Water Research Commission (WRC) and is
approved for publication. Approval does not signify that the contents necessarily reflect the views
and policies of the WRC or the members of the project steering committee, nor does mention of
trade names or commercial products constitute endorsement or recommendation for use.
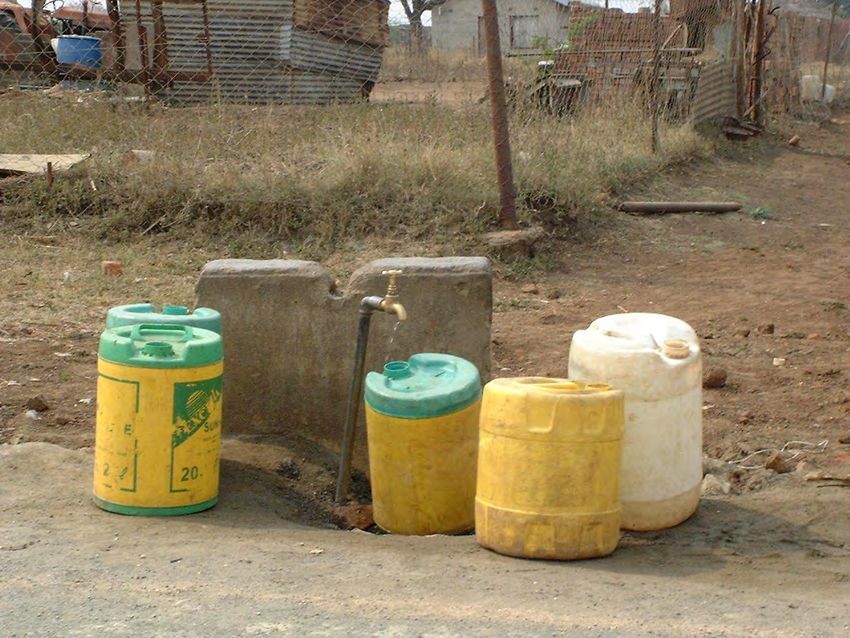
TABLE OF CONTENTS
                                                       Page

Executive Summary                                         3
Acknowledgement                                          14
List of Abbreviations                                    16
List of Tables                                           18
List of Figures                                          19

CHAPTER 1            ASSESSMENT OF THE MICROBIAL QUALITY OF
                     WATER SOURCES
1.1.   INTRODUCTION                                      21
1.2.   MATERIALS AND METHODS                             22
1.2.1. Study areas                                       22
1.2.2. Sample collection                                 22
1.2.3. Microbiological analysis                          23
1.2.3.1.   Indicator organisms                           23
1.2.3.2.   Enteropathogenic bacteria                     23
1.2.4. Antibiogram determination                         25
1.2.5. Statistical analysis                              26
1.3.   RESULTS                                           34
1.3.1. Heterotrophic plate counts                        34
1.3.2. Total coliforms                                   34
1.3.3. Faecal coliforms                                  35
1.3.4. Faecal enterococci                                35
1.3.5. Somatic coliphages                                36
1.3.6. Pathogenic bacteria                               36
1.3.7. Antibiogram determination                         36
1.4.   DISCUSSION                                        41
1.5.   REFERENCES                                        43

                                       1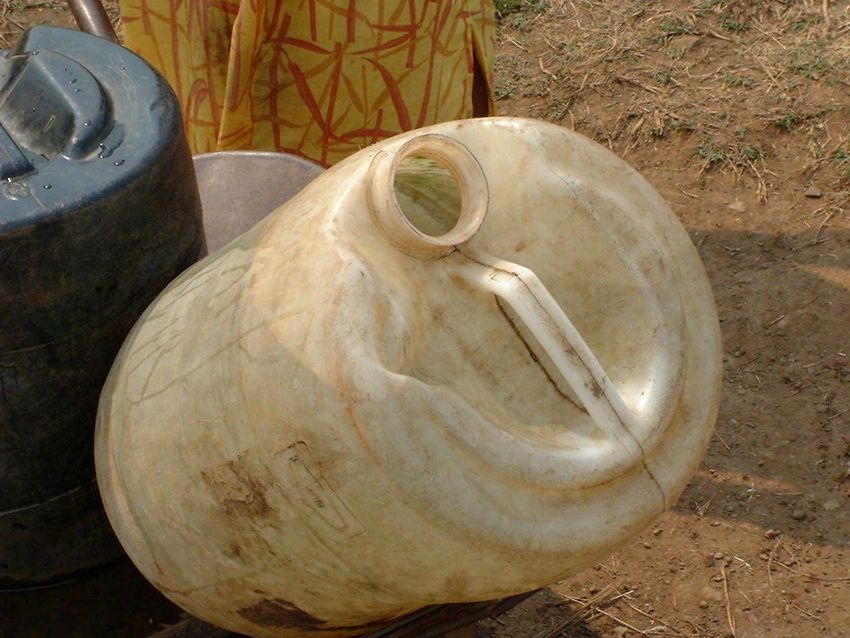
CHAPTER 2             BACTERIAL ENTEROPATHOGENS AND ROTAVIRUSES
                      IN DIARRHOEAL CASES
2.1.   INTRODUCTION                                          52
2.2.   MATERIAL AND METHODS                                  53
2.2.1. Study sites                                           53
2.2.2. Ethical approval                                     53
2.2.3. Sample collection                                     54
2.2.4. Bacteriological methods                              54
2.2.5. Identification of rotaviruses                         56
2.2.5.1.   Extraction of rotavirus RNA                      57
2.2.5.2.   VP4 and VP7 tying of rotavirus RNA                57
2.2.6. Antibiogram determination                            57
2.3.   RESULTS                                               58
2.3.1. Isolation rates of pathogens                         58
2.3.2. Age distribution of pathogens                        58
2.3.3. Seasonal variations in the isolation of pathogens    59
2.3.4. Serotypes and electropherotypes of rotaviruses        59
2.3.5. Antibiotic susceptibility profiles                   59
2.4.   DISCUSSION                                            63
2.5.   REFERENCES                                            65

CHAPTER 3       CONCLUSIONS
3.1.   ASSESSMENT OF THE MICROBIAL QUALITY OF RIVER
       WATER SOURCES                                         71
3.2.   BACTERIAL ENTEROPATHOGENS AND ROTAVIRUSES
       IN DIARRHOEAL CASES                                   71

                                            2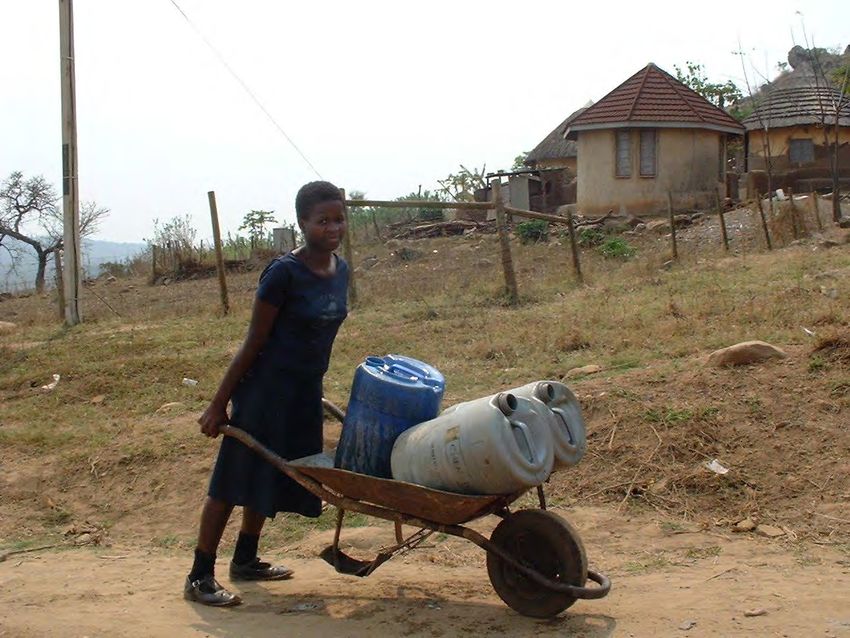
EXECUTIVE SUMMARY

1.    BACKGROUND TO THE STUDY AND PROBLEM STATEMENT

In developing countries, the majority of rural communities are poverty-stricken,
lack access to potable water supplies and rely mainly on water sources such
rivers, streams, ponds, fountains and boreholes for their daily water needs
(Nevondo and Cloete, 1991; Obi et al., 2002). Water from these sources are
used directly by the inhabitants and the water sources from most rural
communities are faecally contaminated and devoid of treatment. Consequently,
a significant proportion of residents in rural communities in South Africa are
exposed to water-borne diseases and their complications (Schalekamp, 1990).
These diseases include various bacterial, fungal, viral and parasitic infections
that cause crippling, devastating and debilitating effects on rural residents and
further exacerbates the already strained health burden and facilities in the
country (Genthe and Seager, 1996; Grabow, 1996). It is therefore imperative to
monitor the microbial quality of water supply in rural areas in order to highlight
the poor quality of water supplies and to provide the impetus for sustained
government intervention.

The Venda Region of the Limpopo Province is mostly rural and most of the
communities have limited or no access to good roads, electricity, water and
sanitation (Census, 2000). Currently, a paucity of data exists on the prevalence
of enteric pathogens in diarrhoeic stool samples obtained in the region. Several
pathogens are known to cause diarrhoea and include bacterial pathogens such
as Campylobacter, Salmonella, Escherichia coli, Aeromonas and Plesiomonas
(Obi et al., 1995, 1997, 1998; El-Sheikh and El-Assouli, 2002) and viruses such
as rotaviruses, astro viruses and Noro viruses (E’cheverria et al., 1983; El
Assouli et al., 1995; El-Sheikh and El-Assouli, 2001). Rotaviruses are globally
recognised as major pathogens of diarrhoea in children and adults (EL-Sheikh
and El-Assouli, 2002).

                                        3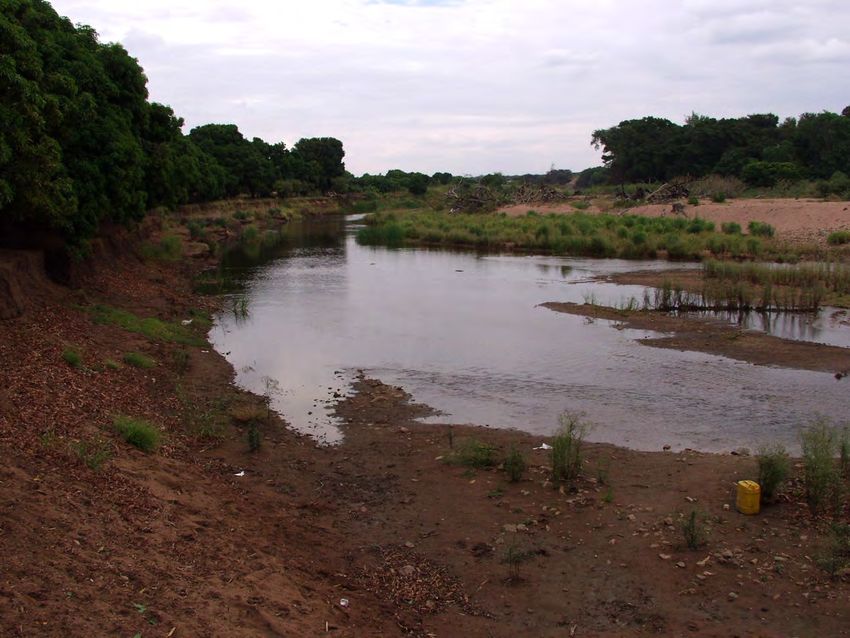
Children younger than the age of five years, especially those in areas devoid of
access to potable water supplies and sanitation are extremely prone to the
devastating effect of diarrhoea since diarrhoea may be transmitted by poor
water quality (Esrey et al., 1990, Parashar et al 2003). Incidence of morbidity
and mortality due to diarrhoea among children younger that five years of age
are significantly higher in such settlements where water supply and sanitation
falls below the level equivalent to those stipulated by the Department of Water
Affairs and Forestry (DWAF) (1995) for the Reconstruction and Development
Programme (RDP) in comparison to children in formal urban residential areas
with in-house connections (Payment et al., 1991; Tonglet et al., 1992).

Although increasing resistance of bacteria to antibiotics is well documented, the
management of diarrhoea and other complications may involve the use of
antibiotics. Antibiotics are known to shorten the duration of diarrhoea, decrease
stool output and abrogate some of the complications caused by diarrhoea
(Black, 1993; Obi et al., 1998). Antibiograms against bacterial pathogens are
known to vary from place to place and also with time. Therefore it is necessary
for periodic updates in order to uncover resistance patterns that may develop in
different regions. There are no baseline data on the antibiograms of potential
bacterial pathogens of diarrhoea isolated from water sources and diarrhoeic
stool specimens in rural communities in the Venda Region.

2.          PROJECT OBJECTIVES.

 i.    To determine the prevalence of enteric pathogens in water sources and
       stool samples of residents in the Venda region of the Limpopo Province.

ii.    To ascertain the extent to which enteric bacterial infections influence the
       incidence of diarrhoea among infants and adults in urban and rural areas
       in the Venda region of the Limpopo Province.

iii.   To determine the antibiograms of bacterial isolates from human and
       environmental sources in order to provide updated information on their
       susceptibility patterns.

                                         4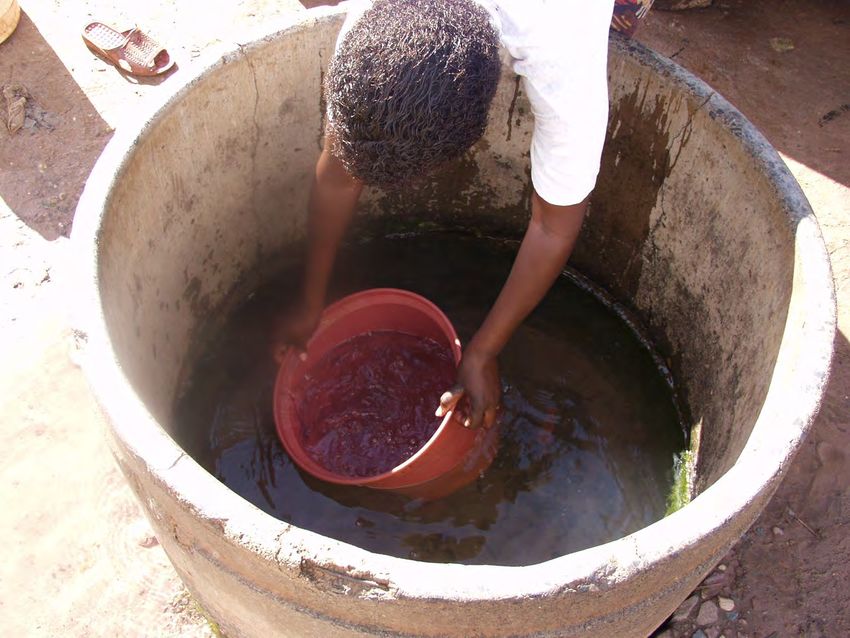
iv.   To explore the use of bacteriophages (viruses) and bacteria as indicators
      of water quality.

v.    To determine seasonal variations of enteropathogens isolated.

vi.   To provide feedback to communities on findings and implications
      regarding microbiological water quality.

3.    ACCOMPLISHMENT OF OBJECTIVES

All the objectives stated above have been accomplished. The microbial quality
of various water sources in the Venda region, Limpopo province has now been
documented. The prevalence of various enteropathogens in water sources and
stool samples as well as antibiograms of isolates were determined. The
frequency or extent of isolation of enteric bacterial pathogens in diarrhoeal
cases among infants and adults was also established. Seasonal distributions of
the various enteropathogens are reported. The use of bacteriophages (Viruses)
and bacteria as indicators of water quality was accomplished. Feedback to
communities on findings and implications regarding microbiological quality has
been initiated and is on-going. Accomplishment in terms of capacity building
included training of several postgraduate students at BSc (Honours), MSc and
PhD levels.

4.    METHODOLOGY USED

The microbial quality of various water sources, used by rural communities in the
Venda region of South Africa, was assessed over a period of two years to
highlight the possible occurrence of water-borne diseases. The water sources
studied included the Levubu, Mutale, Ngwedi, Tshinane, Makonde and
Mudaswali rivers and the Makonde and Mudaswali fountains.              Indicator
organisms such as total and faecal coliforms, faecal enterococci and somatic
coliphage counts were used to determine the microbiological quality of the
water sources.       The prevalence of bacterial enteropathogens such as

                                         5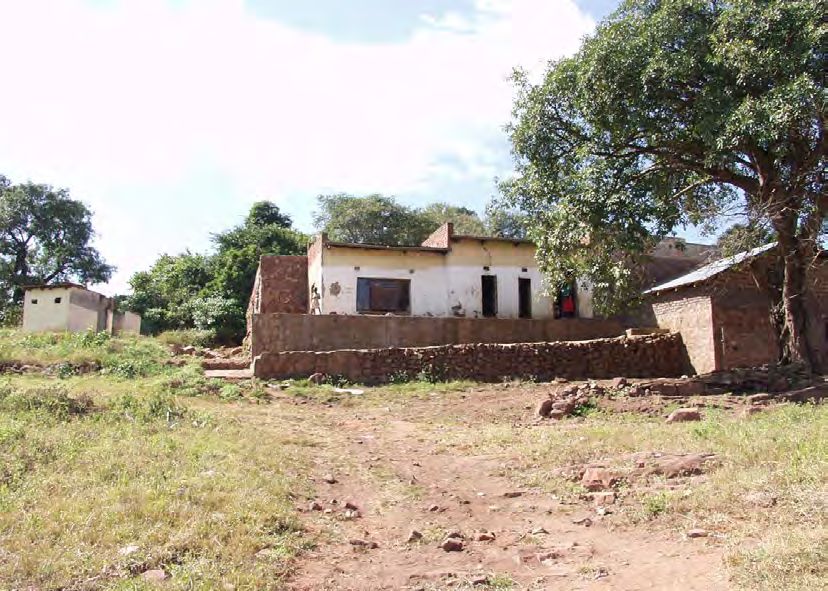
Salmonella, Shigella, Campylobacter, Plesiomonas, Escherichia coli, Yersinia,
Aeromonas and Vibrio cholerae in water and stool samples was determined
using standard biochemical tests.        Rotaviruses in stool specimens were
determined using a commercial Enzyme Link Immuno-sorbant Assay (ELISA)
test. Rotavirus serotypes were characterised using RT-PCR and the virulence
factors of Escherichia coli isolates were determined using the polymerase chain
reaction with specific primers. Antibiotic susceptibility profiles of both water and
clinical bacterial isolates were determined using the Kirby-Bauer disc diffusion
method.

5.   SUMMARY OF MAJOR FINDINGS

Prevalence of enteric pathogens in water sources and stool samples of
residents in the Venda region of the Limpopo Province.

Water sources:
Results obtained showed that the minimum and maximum counts of all the
sampling points investigated with regard to indicator organisms ranged between
1.0 x 101 cfu.ml-1 and 1.3 x 10⁶ cfu.ml-1 for heterotrophic plate counts, between
0 cfu.ml-1 and 1.0 x 10⁶ cfu.ml-1 for total and faecal coliforms, between 0 cfu.ml-1
and 5.1 x 10⁴ cfu.ml-1 for faecal enterococci and for somatic coliphages the
counts ranged between 0 and 154 pfu.100 ml-1. The results for the indicator
organisms were higher than the guideline values for safe drinking water
stipulated by the Department of Water Affairs and Forestry of South Africa.
According to these guidelines, the maximum values are as follows: 1.0 x 10²
cfu.ml-1for heterotrophic plate count, 5 cfu.100 ml-1 for total coliforms, 0 cfu.100
ml-1 for faecal coliforms, 0 cfu.ml-1 for faecal enterococci and 1 pfu.100 ml-1 for
somatic coliphages. The microbial quality of the water sources could be unsafe
for human consumption. Enteric pathogens isolated from the studied water
sources    included   Escherichia    coli,   Plesiomonas     shigelloides,   Vibrio,
Enterobacter cloacae, Shigella, Salmonella, Aeromonas hydrophila, Aeromonas
caviae and Campylobacter. A high percentage of the Escherichia coli isolates
from water (87.7%) and sediment (67.5%) samples contained one or more of
the genes responsible for pathogenicity.

                                         6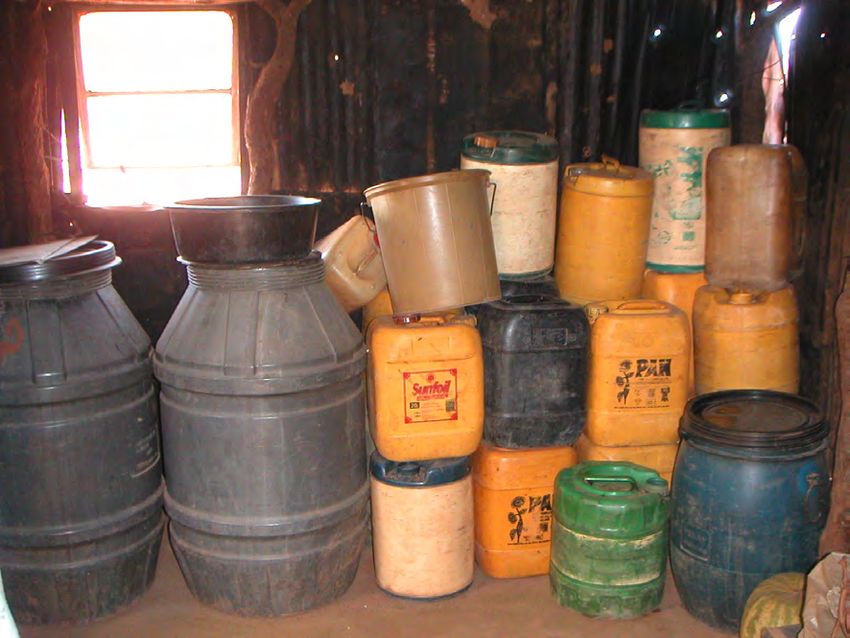
Stool samples:
Results indicated Escherichia coli as the most prevalent bacterial isolate (20%),
followed by Campylobacter jejuni/coli (19,7%), Salmonella species (14,5%),
Shigella (12,5%), Plesiomonas shigelloides (10.7%) and the least (3,7%) was
recorded for Vibrio cholerae. Rotaviruses were detected at a frequency of
26.7%. Isolation rates of enteric bacteria and rotaviruses were statistically
higher in children aged less than five years than in older age groups (6 – 10, 11
– 20 and > 20 years). Detection of bacterial enteropathogens was seen
throughout the year but showed a slightly higher tendency in the summer
months in comparison with observations for other months (p
patterns of virtually all the human isolates to tetracycline, ampicillin,
erythromycin and chloramphenicol were observed.

The use of bacteriophages (viruses) and bacteria as indicators of water
quality.

In this study somatic coliphages were used as indicators for the presence of
enteric viruses in the water sources. The prevalence of somatic coliphages in
all the sampling points could indicate the presence of faecal contamination and
hence potential viral contamination.

Seasonal variations of isolated enteropathogens.

Detection of bacterial enteropathogens was recorded throughout the year but
showed a higher tendency in the months of summer in comparison with data for
the other seasons (p
recommended antibiotics to be used for the treatment of diarrhoea cases
requiring antibiotic therapy.
7. RECOMMENDATIONS FOR INTERVENTION STUDIES
Interventions to improve the quality of drinking water at the household
level must include sanitation and hygiene education
Education of rural communities must be based on the biology of water-
borne diseases and how to prevent these diseases through basic hygiene
and sanitation interventions
Sustainability of water quality intervention strategies must be monitored
periodically and will be achieved only with the active participation of Water
Affair Officers, Health Officers, the community residents and other stake
holders
Intervention measures should include point-of-use treatment of
contaminated water sources and safe storage.
8. RECOMMENDATIONS FOR FUTURE RESEARCH
In order to build on the thrust of this project, the following future research
studies are recommended:
Conduct molecular epidemiological studies of diarrhoeal agents from water
sources and stool samples in order to link the water pathogens and stool
pathogens.
Conduct periodic monitoring of antibiotic susceptibility profiles of bacteria
from environmental and clinical samples in order to provide updated data
on resistance patterns.
Determine the factors influencing household water quality and incidence of
diarrhoeal diseases in rural Venda communities.
9 Assess the virulence characteristics of Campylobacter and Salmonella
from water and stool samples.
Conduct studies on E. coli and Salmonella using molecular and serological
typing for virulence to link the water pathogens to the stool pathogens.
9. CAPACITY BUILDING
9.1. BSc Honours Microbiology
Mr KE Maswime (2001) Prevalence of Campylobacter, Escherichia,
Salmonella, Shigella and Clostridium and their antibiograms in stools of
residents of Venda, South Africa.
Mr E Green (2001) Antibiotic susceptibility profiles of potential enteric
pathogens isolated from water sources in the Venda region of the Northern
Province of South Africa.
Mr R Sono (2001) The prevalence of Aeromonas, Plesiomonas and Vibrio
species in stools of patients with diarrhoea in rural communities in the
Venda region and the antibiograms of isolates.
Miss LP Mamathunsha (2001) The effect of different storage containers
on water quality.
Mr T Mudau (2001) Incidence of enteric pathogens and diarrhoea cases
in the Venda region of the Northern Province of South Africa.
Miss G Matsaung (2002) Isolation and antibiotic susceptibility patterns of
potential enteric bacterial pathogens from water sources in the Venda
region.
Miss J Mulaudzi (2002) The incidence of diarrhoeal pathogens in stool
samples from infants in Venda.
10 Miss MM Moraba (2003) Assessment of raw water sources using somatic
and F-RNA coliphages as indicators of water quality in the Limpopo
Province of South Africa.
Miss RL Ramulumo (2003) Antibiotic susceptibility patterns of Clostridium
perfringens and Campylobacter jejuni isolated from water and stool
samples in the Venda region of South Africa.
9.2. MSc Microbiology
Mr E Green (2003) Molecular characterization of Escherichia coli isolates
from water and stool samples in the Venda Region of South Africa.
Miss MGF Mashau (2003) The use of coliphages in monitoring water
quality and tracing sources of microbial contamination.
Mr E Musie (2003) Molecular epidemiology of Salmonella isolates from
clinical, food, sediment and water samples.
10. TECHNOLOGY TRANSFER
10.1. PUBLISHED ARTICLES
Obi CL, Potgieter N, Bessong PO and Matsaung G (2002) Assessment of the
microbial quality of river water sources in rural Venda communities in South
Africa. Water SA 28 (3) 287-292.
Obi CL, Potgieter N, Bessong PO and Matsaung G (2003) Scope of potential
bacterial agents of diarrhoea and microbial assessment of quality of river water
sources in rural Venda communities in South Africa. Water Science and
Technology 47 (3) 59-64.
Obi CL, Green E, Bessong PO, De Villiers B, Hoosen AA, Igumbor EO and
Potgieter N (2004) Gene encoding virulence markers among Escherichia coli
isolates from diarrhoic stool samples and river sources in rural Venda
communities of South Africa. Water SA 30 (1) 37-42.
11Obi CL, Potgieter N, Bessong PO, Igumbor EO and Green E (2004)
Prevalence of pathogenic bacteria and rotaviruses in stools of patients
presenting with diarrhoea from Venda rural communities, South Africa. South
African Journal of Science (In press).
Obi CL, Bessong PO, Momba MNB, Potgieter N and Igumbor EO (2004)
Profiles of antibiotic susceptibilities of water isolates and physico-chemical
quality of water supply in rural venda communities, South Africa. Water SA (In
press).
10.2. PAPERS IN PREPARATION FOR PUBLICATION
Obi CL, Potgieter N, Musie ME, Bessong PO, Sammi A and Venter SN (2004)
Molecular epidemiology of Salmonella isolates from clinical and environmental
samples. To be submitted to Water Research.
Potgieter N, Obi CL, Mashau MGF, Bessong PO, Sammi A and Igumbor EO
(2004) The use of coliphages in assessing water quality and tracing sources of
microbial contamination. To be submitted to Water SA.
Potgieter N, Obi CL, Bessong PO, Igumbor EO, Sammi A and Ramulumo RI
(2004) Antibiotic susceptibility patterns of Clostridium perfringens and
Campylobacter jejuni isolated from water and stool samples in the Limpopo
Province of South Africa. To be submitted to Water Research.
10.3. CONFERENCE PRESENTATION
Obi CL, Potgieter N, Maswime E, Green E, Sono R and Bessong PO (2001)
Incidence of enteric bacterial pathogens in water sources and stools of
residents in rural communities in the Venda region of South Africa. Poster
presentation at the International Water Association, (IWA) 2nd World Water
Congress, Berlin, Germany, 15 - 19 October, 2001.
Obi CL, Green E, Bessong PO, De Villiers B, Hoosen AA, Igumbor EO and
Potgieter N (2003) Gene encoding virulence markers among Escherichia coli
isolates from diarrhoic stool samples and river sources in rural Venda
12communities of South Africa. Oral presentation at the International Water
Association (IWA), World Water Congress, Cape Town, South Africa, 14 - 19
September, 2003.
10.4. PROPOSAL FOR ARCHIVING OF DATA
Data obtained on the various aspects of this study will be kept at the
Department of Microbiology, University of Venda for Science and Technology,
Thohoyandou, South Africa.
10.5. TECHNOLOGY TRANSFER TO COMMUNITIES AND CLINICS
In order to sustain water quality intervention strategies, technology transfer to
local water affairs officers, health and environmental officers and other
stakeholders are part of ongoing research projects.
13ACKNOWLEDGMENTS
The Water Research Commission Project Steering committee members
responsible for this project:
Mrs APM Moolman Water Research Commission (Chairperson)
Prof WOK Grabow University of Pretoria
Prof MNB Momba University of Fort Hare
Prof VP Onyango-Otieno University of Venda
Dr JM Barnes University of Stellenbosch
Dr ML van der Walt Medical Research Council, Pretoria
Mrs B Genthe CSIR (Stellenbosch)
Mr M Vumbi Thohoyandou Local Government
Mr MW Mandlguzi Health and Welfare, Giyani
Mr S Mosai DWAF, Pretoria
Mr L Moisela Resource Quality Services
This project was only possible with the cooperation of many individuals and
institutions. The authors therefore wish to record their sincere thanks to the
following individuals:
Prof AA Hooseen Department of Microbiology,
Medical University of Southern Africa.
Prof AD Steele MRC Diarrhoeal Research Unit,
Medical University of Southern Africa.
Prof TE Cloete Department of Microbiology and Plant Pathology,
University of Pretoria.
Prof GM Nkondo Vice-Chancellor and Principal,
University of Venda for Science and Technology
Dr SN Venter Department of Microbiology and Plant pathology,
University of Pretoria.
Dr S Gundry AQUAPOL Project,
Bristol University, UK.
14Mr B De Villiers Department of Microbiology,
Medical University of Southern Africa.
Ms P Malangi Research and Publications Office,
University of Venda for Sceince and Technology.
Mrs R Khakhu Committee section,
University of Venda for Science and Technology.
Mr S Mukoma Finance section,
University of Venda for Science and Technology.
15LIST OF ABBREVIATIONS
A. hydrophilia : Aeromonas hydrophilia
AKC : Amikacin
AP : Ampicillin
APN : alkaline peptone water
C. jejuni : Campylobacter jejuni
C. coli : Campylobacter coli
CEF : Ceftriazone
CHL : Chloramphenicol
COT : Cotrimoxazole
CFU : Colony forming unit
DCA : Deoxycholate citrate agar
ds RNA : double stranded ribonucleic acid
DWAF : Department of Water Affairs and Forestry
E. coli : Escherichia coli
ELISA : Enzyme linked immunosorbent assay
ERY : Erythromycin
FC : Faecal coliforms
GM : Gentamicin
h : hour
HPC : Heterotrophic plate count
MAB : monoclonal antibody
MAX : maximum
MHA : Muellar – Hinton Agar
MIN : minimum
min : minute
NA : Nalidixic acid
NaCl : Sodium Chloride
ND : Not Done
Nl : Nitrofurantoin
P : Protease Sensitive Protein
16PBS : Phosphate buffered saline
PCR : Polymerase Chain Reaction
PFU : Plaque forming unit
P. shigelloides : Plesiomonas shigelloides
RDP : Reconstruction and Development Programme
RT-PCR : Reverse Transcriptase Polymerase Chain Reaction
SD : Standard Deviation
SF : Selenite F-broth
SS Agar : Salmonella – Shigella agar
TC : Total coliforms
TCBS : Thiocitrate bile salt
TE : Tetracycline
VP4 : Virion’s outer capsid spike protein
VP7 : Virion’s outer capsid viral glycoprotein
WRC : Water Research Commission
XDCA : Xylose Deoxycholate Citrate agar.
17LIST OF TABLES
PAGE
Table 1.1 Microbiological assessment of water quality from various
water sources used for drinking purposes in rural Venda
communities 38
Table 1.2 Pathogenic bacteria isolated from water sources in the
Venda region of South Africa 39
Table 1.3 Antibiograms of bacterial isolates from water sources in the
Venda region, South Africa 40
Table 2.1 Occurrence of Rotavirus VP4, VP7 and electropherotypes in
diarrhoeal stool samples 62
Table 2.2 Antibiotic susceptibilities of enteric bacterial pathogens from
stool specimens of patients with diarrhoea 64
18LIST OF FIGURES
PAGE
Figure 1.1 The Venda region in the Limpopo Province 27
Figure 1.2 Typical households found in rural Venda communities 28
Figure 1.3 Two different types of water sources used by the rural
communities as drinking water sources 29
Figure 1.4 Various activities taking place at the water sources 30
Figure 1.5 Types of containers used in the collection and storage of water 31
Figure 1.6 Transportation of drinking water to the household 32
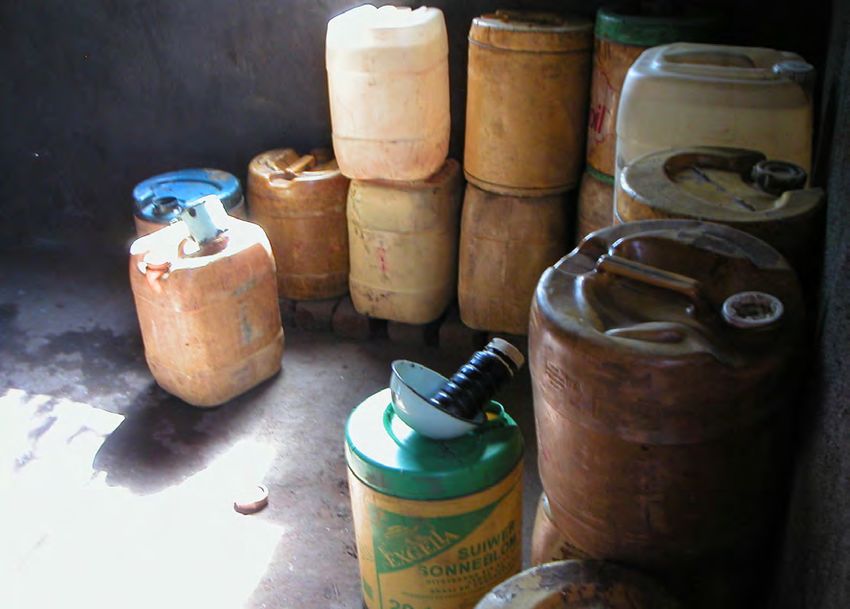
Figure 1.7 Storage of water in the household 33
Figure 2.1 Frequency of isolation of potential enteric pathogens from
stool specimens of patients with diarrhoea in the Venda region 61
Figure 2.2 Age distribution of enteric organisms isolated from patients
with diarrhoea in the Venda region 61
Figure 2.3 Seasonal distribution of enteropathogens isolated from
Diarrhoeal cases in the Venda region 62
1920
CHAPTER 1

                   ASSESSMENT OF THE MICROBIAL
                      QUALITY OF WATER SOURCES

1.1.     INTRODUCTION

Rural communities in developing countries such as the Venda region of South
Africa are poverty-stricken, lack access to potable water supplies and rely
mainly on river, stream, fountain and borehole water sources for their daily
water needs (Nevondo and Cloete, 1991) (Figures 1.1, 1.2). Consequently, the
water sources used by most rural communities are faecally contaminated and
devoid of treatment which pose a significant health risk because of the danger
of waterborne diseases and their complications (Schalekamp 1990, Bailey and
Archer, 2001). Water-borne diseases which my be caused by bacterial, fungal,
viral and parasitic pathogens are responsible for crippling, devastating and
debilitating effects on rural residents and further exacerbate the already strained
health burden and facilities in the country (Genthe and Seager, 1996; Grabow,
1996).    Therefore it is important to critically monitor the microbial quality of
water supply in rural areas in order to provide the impetus for sustained
government intervention (Acho-Chi, 2001).

Although government has made some efforts to ensure access to potable water
supply to rural communities in South Africa, these projects have been fraught
with financial and human resource constraints, making it unlikely that high-
quality water will be made available to the bulk of rural residents in the future
(Nevondo and Cloete, 1999). In areas where potable water supplies have been
provided, these supplies are unreliable and insufficient, forcing residents to
revert to contaminated river sources (WRC, 1993; Nevondo and Cloete, 1999).
Figures 1.3 and 1.4

The major health risk associated with these drinking water sources is
contamination by human or animal faeces (Lehloesa and Muyima, 2000). Since

                                        21
it is impractical to test water supply for all pathogens related to water-borne
diseases due to the complexity of the testing, time and cost (Lehloesa and
Muyima, 2000), indicator organisms are used (Hazen, 1988; Grabow, 2001).
However, no simple indicator that complies with all the criteria is available,
hence more than one indicator organism is employed (Genthe and Seager,
1996).
In spite of the problem of poor water quality in rural areas, little data exists on
the bacterial quality of water supply in these settings, since most studies
approach the problem by focusing on urban communities (Nevondo and Cloete,
1999). In this study indicators of pollution (heterotrophic plate counts, total
coliforms, faecal coliforms, faecal enterococci and somatic coliphages) were
used to determine the microbial quality of water sources of rural communities in
the Venda region and these results were compared with guideline values
described by the Department of Water Affairs and Forestry (DWAF, 1998).
1.2. MATERIALS AND METHODS
1.2.1. Study areas
The study sites included various rural communities in the Venda Region of the
Limpopo Province, South Africa (Figures 1.1 and 1.2). The main water sources
used by the people in these communities were identified and sampled (Figures
1.3 and 1.4). They comprised: Mutshindudi, Tshinane, Ngwedi, Mutale,
Mudaswali and Levuvhu rivers and the Makonde and Mudaswali fountains.
1.2.2. Sample collection
The collection of water samples from the various water sources were carried out
on a weekly basis from August 2000 to July 2002. Water samples were
collected aseptically into 1litre Nalgene containers and transported on ice to the
base laboratories in the Department of Microbiology, University of Venda for
Science and Technology, South Africa. Microbiological investigations were
performed within 8 h after collection.
221.2.3. Microbiological analysis
1.2.3.1. Indicator organisms
Microbiological analyses of water samples were performed as previously
described (Standard Methods, 1998). Briefly, for heterotrophic bacteria, the
pour plate method was carried out using Plate Count agar (Merck) and plates
were incubated at 37ºC for 48h. Bacterial indicator organisms were detected
and enumerated using the membrane filtration method. Total coliforms were
assessed on m-Endo agar (Merck) after 24h with an incubation temperature of
37ºC. Faecal coliforms were enumerated on m-Fc medium and incubated at
44.5ºC for 24h. The m-Enterococcus agar (Merck) was used for the isolation of
faecal enterococci after an incubation at 37ºC for 48h. For somatic coliphage
counts, the double agar layer plaque assay on phage agar described by
Grabow et al (1996, 2000, 2001) at 37ºC for 24h was used. The nalidixic acid
resistant Escherichia coli WG5 strain was used as host.
1.2.3.2. Enteropathogenic bacteria
Standard methods (1998) were employed for the isolation and identification of
Campylobacter, Aeromonas, Plesiomonas, Salmonella, Shigella, Vibrio and
Yersinia species. Media, supplements and chemicals were obtained from
Merck, South Africa and Oxoid, South Africa.
Aeromonas and Plesiomonas isolation and identification
Specimens were inoculated onto Xylose Deoxycholate Citrate Agar (XDCA),
incubated at 37ºC for 24h. Non-xylose fermenting colonies on XDCA were
screened for oxidase production (Alabi and Odugbeni, 1990). Oxidase-positive
colonies were further confirmed as belonging to Aeromonas or Plesiomonas
shigelloides. Aeromonas spp give positive reactions for ornithine
decarboxylase, DNase tests and resistance to vibrostatic agent O/129, while
Plesiomonas shigelloides produces neither gas nor H2S on Triple sugar iron
agar (Von Gravenitz, 1985).
23Campylobacter isolation and identification
Isolation of Campylobacter from stool was done on Skirrow’s and Butzler’s
media as previously described (Coker and Dosunmu-Ogumbi, 1984; Alabi and
Odugbemi, 1990; Obi et al., 1998). Briefly, the plates were incubated at 42ºC
under microaerophilic conditions for 72h. Organisms were considered to be
Campylobacter if they were S-shaped, Gram negative, motile, oxidase-positive,
grew at 42ºC but not at 25ºC and sensitive to nalidixic acid. C. jejuni and C. coli
isolates were differentiated on the basis of hippurate and indoxyl acetate
hydrolysis. C. jejuni is positive for both tests while C. coli is positive for indoxyl
acetate hydrolysis only (Nachamkin, 1999; Prasad et al., 2000).
Escherichia coli isolation and identification
Samples were streaked on Eosin Methylene Blue agar (EMB) and incubated
aerobically for 24h at 37ºC. Blue-purple or metallic green sheen colonies
indicative of E. coli were confirmed by positive reactions for indole, o-
nitrophenyl-β-D-galactopyranoside (ONPG), xylose, citrate utilization and
negative reactions for oxidase, DNase, KCN, phenylalanine deaminase and
Voges-Proskauer tests (Ogunsanya et al., 1994).
Salmonella isolation and identification
Stool specimen was streaked on Bismuth sulphite agar and incubated for 48h at
37ºC. Black colonies with metallic silver sheen suggestive of Salmonella were
confirmed by positive reactions for motility, fermentation of mannitol and
sorbitol, and negative reactions for DNase, indole, phenylalanine deaminase,
urease, Voges-Proskauer, growth in Potassium cyanide (KCN), ONPG and
fermentation of adonitol, sucrose, lactose, raffinose and salicin (Simango et al.,
1992).
24Shigella isolation and identification
Samples were cultured on Salmonella-Shigella agar (SS) for 24h at 37ºC.
Colonies suggestive of Shigella were screened for negative reactions for
motility, adonitol, citrate, DNase, gas from glucose, H2S, lysine, phenylalanine,
sucrose, urease, Voges-Proskauer, inositol, KCN, lactose, malonate, salicin and
xylose (Obi et al., 1998; Nachamkim, 1999).
Vibrio isolation and identification
For each sample 1 ml of water was inoculated in 10 ml of alkaline peptone
water, pH 8.6 (APW) and incubated for 24h at 37ºC. A loopful from the surface
of the APW culture was sub-cultured on Thiosulphate Citrate Bile Salt Sucrose
agar (TCBS) and incubated overnight at 37ºC. Yellow colonies suggestive of
Vibrio growth were sought and screened using V. cholerae O1 antiserum
(Wellcome Reagents, Wellcome Research Laboratories, Beckenham) (Alabi
and Odugbeni, 1990; Ogunsanya et al., 1994).
Yersinia enterocolitica isolation and identification
Samples were cultured on Yersinia agar enriched with Yersinia selective
supplement SR109 (Oxoid) (Simango et al., 1992) and incubated at 37ºC for
24h. Presumptive colonies of Y. enterocolitica were characterized by positive
tests for ornithine carboxylase and sucrose fermentation, and negative
reactions for raffinose, rhamnose and melibiose fermentation (Alabi and
Odugbeni, 1990).
1.2.4. Antibiogram determination
Antibiotic susceptibility testing of bacterial isolates was determined on Mueller-
Hinton agar using the Kirby – Bauer disk diffusion method (Bauer et al., 1966;
Obi et al., 1998). Antibiotics employed were commercially obtained from Davies
Diagnostics (South Africa) and included ampicillin (10ug), gentamicin (10ug),
25penicillin (10 ug), carbenicillin (30 ug), tetracycline (30ug), chloramphenicol
(30ug), erythromycin (15ug) and cephalosporin (30ug).
1.2.5. Statistical analysis
Excel statistical package was employed for statistical analysis.
26Figure 1.1: Map showing the Venda region in the Limpopo Province
27Figure 1.2: Typical households found in rural Venda communities
28Figure 1.3: Two different types of water sources used by rural
communities as drinking water sources
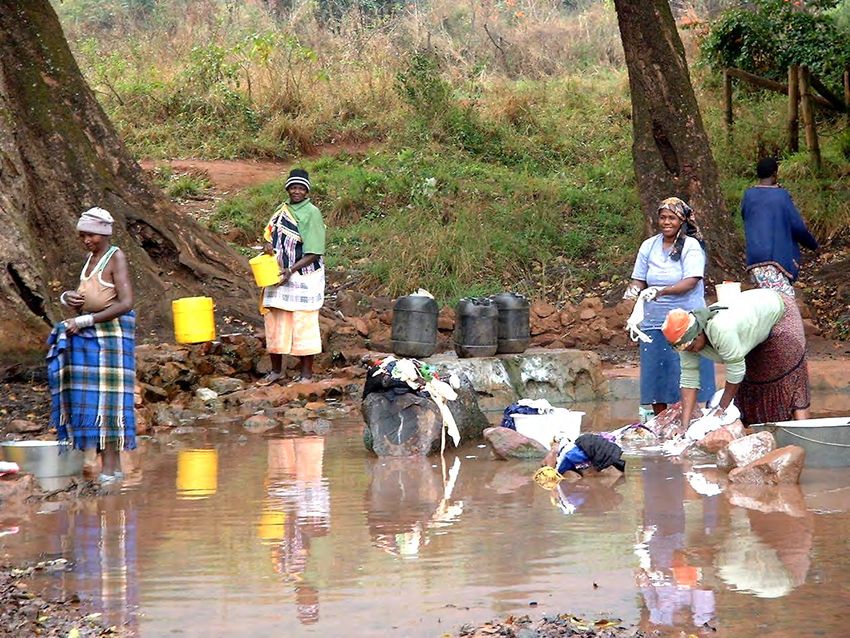
29Figure 1.4: Various activities taking place at river water sources
30Figure 1.5: Types of containers used in the collection and storage of
water
31Figure 1.6: Transportation of drinking water to the household
32Figure 1.7: Storage of drinking water in the household
331.3. RESULTS
1.3.1. Heterotrophic plate counts
Heterotrophic bacterial counts in the Levubu river were in the range of between
6.0 x 10³ and 1.3 x 10⁶ cfu.ml-1 for Masetoni point, between 5.0 x 10³ and 3.1 x
104 cfu.ml-1 for Mhinga point, between 7.7 x 10³ and 2.6 x 10⁴ cfu.ml-1 for Dididi
point, between 9.6 x 10² and 1.4 x 10⁴ cfu.ml-1 for Tshikonelo point, between 1.8
x 102 and 2.0 x 10³ cfu.ml-1 for Grootpad point, between 1.0 x 10³ and 3.0 x 10³
cfu.ml-1 for Mutoti point and between 7.0 x 10³ and 2.7 x 10⁵ cfu.ml-1 for the
Vuwani point. For the other rivers, the counts ranged between 1.0 x 10³ and
3.0 x 10⁴ cfu.ml-1 for Mutale River, between 6.2 x 10³ and 7.9 x 10⁴ cfu.ml-1 for
Ngwedi river, between 1.9 x 10² and 1.7 x 10³ cfu.ml-1 for Tshinane River and
between 1.9 x 10² and 1.7 x 10³ cfu.ml-1 for Mudaswali River (Table 1.1.) The
counts for the Mudaswali fountain ranged between 1.8 x 101 and 1.9 x 10²
cfu.ml-1 and between 1.0 x 101 and 1.4 x 10² cfu.ml-1 for Makonde fountain
(Table 1.1). The recommended limit for no risk in terms of heterotrophic
bacterial count is 1.0 x 10² cfu. ml -1 (DWAF, 1998, WRC, 1998).
1.3.2. Total coliforms
The minimum and maximum total coliform counts were in the following ranges
for the Levubu river points: between 6.0 x 10² and 7.6 x 10³ cfu.100ml-1 for
Masetoni point, between 8.9 x 10² and 2.3 x 10⁴ cfu.100ml-1 for Mhinga point,
between 4.9 x 10³ and 1.5 x10⁴ cfu.100ml-1 for Dididi point, between1.1 x 103
and 1.8 x 10³ cfu.100ml-1 for Tshikonelo point, between 1.3 x 10⁴ and 2.1 x 10⁴
cfu.100ml-1 for Grootpad point, between and 9.2 x 10² and 1.5 x 10³ cfu.100ml-1
for Mutoti point and between 7.3 x 10³ and 1.8 x 10⁴ cfu.100ml-1 for Vuwani
point. The minimum and maximum counts for the other rivers respectively
ranged between 9.2 x 10³ and 1.9 x 10⁴ cfu.100ml-1 for Mutale River, between
2.0 x 10⁴ and 3.4 x 10⁴ cfu.100ml-1 for Tshinane River, between 2.8 x 10³ and
3.7 x 10⁴ cfu.100ml-1 for Ngwedi river and between 0.3 x 101 and 1.0 x 10⁶
cfu.100ml-1 for Mudaswali river (Table 1.1). The counts for the Mudaswali
fountain ranged between 0 and 1.24 x 10 cfu.100ml-1 and between 1.3 x 101
4
34and 8.3 x 101 cfu.100 ml-1 for Makonde fountain (Table 1.1). The counts
exceeded the 5 cfu. 100 ml-1, which is the recommended limit for no risk
(DWAF, 1998, WRC, 1998)
1.3.3. Faecal coliforms
The minimum and maximum faecal coliform counts for the various sites were as
follows in the Levubu river: between 1.5 x 10³ and 6.3 x 10⁴ cfu.100 ml-1 for
Masetoni point, between 5.2 x 10³ and 1.72 x 10⁴ cfu.100 ml-1 for Mhinga point,
between 9.0 x 10² and 1.5 x 10³ cfu.100 ml-1 for Tshikonelo point, between 6.1 x
103 and 1.2 x 10⁴ cfu.100 ml-1 for Grootpad point, between 5.6 x 10³ and 7.2 x
103 cfu.100ml-1 for Mutoti point, between 4.1 x 10² and 7.5 x 10² cfu.100 ml-1 for
Dididi point, and between 2.9 x 10² and 1.1 x 10⁴ cfu.100 ml-1 for Vuwani point.
The minimum and maximum faecal coliform counts for the other rivers ranged
between 5.6 x 10³ and 2.0 x 10³ cfu.100 ml-1 for Mutale River, between 7.4 x 10²
and 3.9 x 10³ cfu.100 ml-1 for Tshinane River, between 1.8 x 10² and 8.2 x 10²
cfu.100 ml-1 for Ngwedi river and between 0.1 x 101 and 1.0 x 10⁶ cfu.100 ml-1
for Mudaswali river (Table 1.1). The counts for the Mudaswali fountain ranged
between 0 and 3.5 x 10⁴ cfu.100ml-1 and between 0.4 x 101 and 7.4 x 101
cfu.100 ml-1 for Makonde fountain (Table 1.1). The recommended limit for no
risk of faecal coliforms is 0 cfu.100 ml-1.
1.3.4. Faecal enterococci
Enterococci counts for the Levubu river points ranged between 2.0 x 10³ and
5.5 x 10³ cfu.100 ml-1 for Masetoni point, between 5.0 x 10² and 2.3 x 10³
cfu.100 ml-1 for Mhinga point, between 1.2 x 10³ and 3.1 x 10³ cfu.100 ml-1 for
Tshikonela point, between 1.0 x 10³ and 1.0 x 10⁴ cfu.100 ml-1 for Dididi point,
between 4.0 x 10³ and 2.1 x 10⁴ cfu.100 ml-1 for Grootpad point, between 1.9 x
103 and 2.5 x 10⁴ cfu.100 ml-1 for Mutoti point and between 1.0 x 101 and 5.1 x
102 cfu.100 ml-1 for Vuwani point. Enterococci counts for the other rivers
ranged between 1.9 x 10² and 2.1 x 10³ cfu.100 ml-1 for Mutale River, between 0
and 6.4 x 101 cfu.100 ml-1 for Mudaswali River, between 4.0 x 101 and 3.2 x 10²
cfu.100 ml-1 for Tshinane River and between 6.6 x 10³ and 2.2 x 10⁴ cfu.100 ml-1
35for Ngwedi River (Table 1.1). Enterococci counts for the Mudaswali fountain
ranged between 0 and 1.12 x 10⁴ cfu.100 ml-1 and between 0 and 8.3 x 101
cfu.100 ml-1 for Makonde fountain (Table 1.1). The recommended limit for no
risk of faecal enterococci is 5 cfu.100ml-1 (DWAF 1998).
1.3.5. Somatic coliphages
Somatic coliphage counts obtained from the various water sources are
presented in Table 1.1. Briefly, coliphage counts for all the water sampling
points ranged between 0 and 210 pfu.100 ml-1. The recommended limit for no
risk of somatic coliphages is 1 pfu.100 ml-1.
1.3.6. Pathogenic bacteria
Bacteria such as Escherichia coli, Vibrio cholerae, Aeromonas hydrophila,
Aeromonas caviae, Shigella, Plesiomonas shigelloides, Enterobacter cloacae,
Campylobacter and Salmonella were isolated and identified from the various
water sources. The results are indicated in Table 1.2.
1.3.7. Antibiogram determination
Antibiogram results of bacterial enteropathogens presented in Table 1.3
revealed marked susceptibilities (over 90%) of Campylobacter, Salmonella and
Escherichia coli to nalidixic acid, ciprofloxacin and amikacin. All 100% of
Salmonella species were susceptible to amikacin. Eighty-eight percent of
Campylobacter species and over 90% of Escherichia coli, Salmonella,
Plesiomonas and Shigella species were susceptible to gentamicin. Aeromonas,
Enterobacter and Vibrio cholerae demonstrated over 90% susceptibilities to
ciprofloxacin and over 85% of the three isolates were in addition susceptible to
amikacin. In general, over 80% of the bacterial isolates were susceptible to
nalidixic, gentamicin, ciprofloxacin, amikacin and ceftiriazone with the exception
of Vibrio cholerae with susceptibility rates of 73%, 60%, 53% to nalidixic acid,
ceftriazone and gentamicin respectively and Campylobacter species with 62%
susceptibility to ceftriazone.
36Majority of bacterial isolates demonstrated multiple antibiotic resistance to
cotrimoxazole, tetracycline, ampicillin, erythromycin and chloramphericol. A
total of 35% of the Campylobacter isolates were resistant to erythromycin
whereas 20% - 30% of Campylobacter, Salmonella, Shigella, Plesiomonas,
Aeromonas and Enterobacter isolates showed resistance to cotrimoxazole,
tetracycline, ampicillin, erythromycin and chloramphenicol.
37Table 1.1 Microbiological assessment of water quality from various
water sources used for drinking purposes in rural Venda
communities.
Heterotrophic Total Faecal Faecal Somatic
Water bacteria coliforms coliforms enterococci Coliphages
Sources
-1 -1 -1 -1 -1
(cfu. ml ) (cfu.100 ml ) cfu.100 ml ) (cfu.100 ml ) (pfu.100 ml )
3 2 3 3
Min : 6.0 x 10 Min : 6.0 x 10 Min : 1.5 x 10 Min : 2.0 x 10 Min : 0
6 3 4 3
Levubu River : Max : 1.3 x 10 Max : 7.6 x 10 Max : 6.3 x 10 Max : 5.5 x 10 Max : 7
5 3 3 3
Masetoni point Mean : 6.5 x 10 Mean : 3.2 x 10 Mean : 3.3 x 10 Mean : 3,75 x 10 Mean : 1.77
5 2 3 2
SD : 3.5 x 10 SD : 8.0 x 10 SD : 2.4 x 10 SD : 1.5 x 10 SD : 2.60
3 2 3 2
Min : 5.0 x 10 Min : 8.9 x 10 Min : 5.2 x 10 Min : 5.0 x 10 Min : 0
4 4 4 3
Levubu River : Max : 3.1 x 10 Max : 2.3 x 10 Max : 1.72 x 10 Max : 2.3 x 10 Max : 154
4 3 3 3
Mhinga point Mean : 1.8 x 10 Mean : 1.6 x 10 Mean : 1.12 x 10 Mean : 1.4 x 10 Mean : 20.4
4 2 4 2
SD : 1.3 x 10 SD : 7.2 x 10 SD : 6.5 x 10 SD : 9.0 x 10 SD : 42.1
3 3 2 3
Min : 7.7 x 10 Min :4.9 x 10 Min : 4.1 x 10 Min : 1.0 x 10 Min : 0
4 4 2 4
Levubu River : Max : 2.6 x 10 Max : 1.5 x 10 Max : 7.5 x 10 Max :1.0 x 10 Max : 3
4 3 2 3
Dididi point Mean : 1.7 x 10 Mean : 9.95 x 10 Mean : 5.8 x 10 Mean : 5.5 x 10 Mean : 0.88
4 2 2 2
SD : 1.0 x 10 SD : 5.0 x 10 SD : 1.8 x 10 SD : 5.5 x 10 SD : 1.05
2 3 2 3
Min : 9.6 x 10 Min : 1.1 x 10 Min : 9.0 x 10 Min : 1.2 x 10 Min : 0
4 3 3 3
Levubu River : Max : 1.4 x 10 Max : 1.8 x 10 Max : 1.5 x 10 Max : 3.1 x 10 Max : 7
3 3 3 3
Tshikonela point Mean : 7.5 x 10 Mean : 1.5 x 10 Mean : 1.2 x 10 Mean : 2.2 x 10 Mean : 1.77
3 2 2 2
SD : 2.3 x 10 SD : 4.3 x 10 SD : 3.3 x 10 SD : 1.0 x 10 SD : 2.60
2 4 3 3
Min : 1.8 x 10 Min : 1.3 x 10 Min : 6.1 x 10 Min : 4.0 x 10 Min : 0
3 4 4 4
Levubu River : Max : 2.0 x 10 Max : 2.1 x 10 Max : 1.2 x 10 Max : 2.1 x 10 Max : 12
3 4 3 4
Grootpad point Mean : 1.1 x 10 Mean : 1.7 x 10 Mean : 9.0 x 10 Mean : 1.3 x 10 Mean : 0.9
2 2 3 3
SD : 2.8 x 10 SD : 4.3 x 10 SD : 2.9 x 10 SD : 8.6 x 10 SD : 3.32
3 2 3 3
Min : 1.0 x 10 Min : 9.2 x 10 Min : 5.6 x 10 Min : 1.9 x 10 Min : 0
3 3 3 4
Levubu River : Max : 3.0 x 10 Max : 1.45 x 10 Max : 7.2 x 10 Max : 2.1 x 10 Max : 3
3 3 3 3
Mutoti point Mean : 1.0 x 10 Mean : 5.0 x 10 Mean : 2.5 x 10 Mean : 3.4 x 10 Mean : 0.88
3 4 3 4
SD : 3.0 x 10 SD : 1.91 x 10 SD : 1.0 x 10 SD : 2.5 x 10 SD : 1.05
3 3 2 1
Min : 7.0 x 10 Min : 7.3 x 10 Min : 2.9 x 10 Min : 1.0 x 10 Min : 0
5 4 4 2
Levubu River: Max : 2.7 x 10 Max : 1.8 x 10 Max : 1.1 x 10 Max : 5.1 x 10 Max : 5
5 4 3 1
Vuwani point Mean : 1.4 x 10 Mean : 1.3 x 10 Mean : 5.6 x 10 Mean : 2.6 x 10 Mean : 1.1
4 3 3 1
SD : 1.1 x 10 SD : 6.4 x 10 SD : 4.2 x 10 SD : 2.5 x 10 SD : 1.96
3 3 2 2
Min : 1.0 x 10 Min : 9..2 x 10 Min : 5.6 x 10 Min : 1.9 x 10 Min : 0
4 4 3 3
Mutale river Max : 3.0 x 10 Max : 1.9 x 10 Max : 2.0 x 10 Max : 2.5 x 10 Max : 114
4 4 3 3
Mean : 1.6 x 10 Mean : 1.4 x 10 Mean : 1.3 x 10 Mean : 1.3 x 10 Mean : 20
3 3 2 2
SD : 1.4 x 10 SD : 5.0 x 10 SD : 2.5 x 10 SD : 3.45 x 10 SD : 37.2
3 3 1 3
Min : 6.2 x 10 Min : 2.8 x 10 Min : 1.8 x 10 Min : 6.6 x 10 Min : 0
4 4 2 4
Ngwedi River Max : 7.9 x 10 Max : 3.7 x 10 Max : 8.2 x 10 Max : 2.2 x 10 Max : 154
4 4 2 4
Mean : 7.1x 10 Mean : 2.0 x 10 Mean : 4.2 x 10 Mean : 1.4 x 10 Mean : 20.4
4 3 2 3
SD : 5.4 x 10 SD : 2.1 x 10 SD : 4.0 x 10 SD : 1.9 x 10 SD : 42.1
2 4 2 1
Min : 1.9 x 10 Min : 2.0 x 10 Min : 7.4 x 10 Min : 4.0 x 10 Min : 0
3 4 3 2
Tshinane River Max : 1.7 x 10 Max : 3.4 x 10 Max : 3.9 x 10 Max : 3.2 x 10 Max : 210
2 4 3 2
Mean : 9.5 x 10 Mean : 2.7 x 10 Mean : 2.3 x 10 Mean : 1.8 x 10 Mean : 23.4
2 3 2 2
SD : 4.4 x 10 SD : 2.6 x 10 SD : 5.0 x 10 SD : 1.5 x 10 SD : 57.3
2 1 1
Mudaswali river Min : 1.9 x 10 Min : 0.3 x 10 Min : 0.1x 10 Min : 0 Min : 0
3 6 6 1
Max : 1.7 x 10 Max : 1.0 x 10 Max : 1.0 x 10 Max : 6.4 x 10 Max : 95
2 5 5 1
Mean : 9.5 x 10 Mean : 7.7 x 10 Mean : 7.7 x 10 Mean: 8.1 x 10 Mean : 13.8
2 5 5 1
SD : 4.4 x 10 SD : 2.8 x 10 SD : 2.8 x 10 SD : 6.7 x 10 SD : 31.9
1
Mudaswali Min : 1.8 x 10 Min : 0 Min : 0 Min : 0 Min : 0
2 4 4 4
fountain Max : 1.9 x 10 Max : 1.24 x 10 Max : 3.7 x 10 Max : 1.12 x 10 Max : 12
2 3 3 3
Mean : 0.5 x 10 Mean : 2.47 x 10 Mean : 1.06 x 10 Mean : 1.58 x 10 Mean : 0.9
1 1 1 1
SD : 1.4 x 10 SD : 2.64 x 10 SD : 1.14 x 10 SD : 2.48 x 10 SD : 3.32
1 1 1
Makonde fountain Min : 1.0 x 10 Min : 1.3 x 10 Min : 0.4 x 10 Min : 0 Min : 0
2 1 1 1
Max : 1.4 x 10 Max : 8.3 x 10 Max : 7.4 x 10 Max : 8.3 x 10 Max : 63
2 1 1 1
Mean : 1.0 x 10 Mean : 3.7 x 10 Mean : 2.6 x 10 Mean : 2.7 x 10 Mean : 5.4
1 1 1 1
SD : 0.8 x 10 SD : 3.3 x 10 SD : 2.5 x 10 SD : 3.1 x 10 SD : 17.35
cfu = colony forming unit
ml = millilitres
min = minimum
max = maximum
SD = standard deviation
pfu = plaque forming unit
38Table 1.2 Pathogenic bacteria isolated from water sources in the Venda
region of South Africa
Water sources Enteric bacteria isolated from each source
Levubuvhu river: Escherichia coli
Plesiomonas shigelloides
Vuwani point
Vibrio isolates
Enterobacter cloacae
Shigella isolates
Salmonella isolates
Levuvhu river: Escherichia coli
Enterobacter cloacae
Tshikonela point
Vibrio isolates
Levuvhu river: Escherichia coli
Salmonella isolates
Masetoni point
Shigella isolates
Enterobacter cloacae.
Levuvhu river: Aeromonas hydrophila
Aeromonas caviae
Grootpad point
Salmonella isolates
Shigella isolates
Vibrio isolates
Levuvhu river: Aeromonas hydrohila
Aeromonas caviae
Dididi point
Vibrio isolates
Escherichia coli
Shigella isolates
Levuvhu river: Salmonella isolates
Shigella isolates
Mhinga point
Aeromonas hydrophila
Vibrio isolates
Levuvhu river: Enterobacter cloacae
Vibrio isolates
Mutoti point
Escherichia coli
Mudaswali River Vibrio isolates
Enterobacter cloacae
Shigella isolates
Salmonella isolates
Mudaswali fountain Escherichia coli
Shigella isolates
Aeromonas caviae
Vibrio isolates
Tshinane River Escherichia coli
Aeromonas isolates
Campylobacter isolates
Salmonella isolates
Ngwedi River Escherichia coli
Plesiomonas shigelloides
Shigella isolates
Campylobacter isolates
Mutale River Shigella isolates
Salmonella isolates
Aeromonas isolates
Makonde fountain Escherichia coli
Shigella isolates
Aeromonas hydrophila
Aeromonas caviae
Plesiomonas shigelloides
Vibrio isolates
39Table 1.3 Antibiograms of enteric bacterial isolates from water sources in the Venda region, South Africa
ANTIBIOTIC SUSCEPTIBILITY NO (%)
Bacteria NA GM COT CIP TE AP ERY CHL AKC CEF
Campylobacter isolates 24 (92%) 23 (88%) 18 (69%) 25 (96%) 18 (69%) 15 (58%) 17 (65%) 16 (62%) 25(96%) 16 (62%)
(n = 26)
Escherichia coli 36 (90%) 37 (92.5%) 30 (75%) 38 (95%) 28 (70%) 20 (50%) 21 (52.5) 18 (45%) 39 (97.5%) 37 (92.5%)
(n = 40)
Salmonella isolates 28 (93%) 29 (96.6%) 20 (66.6%) 29 (96.6%) 14 (46.6%) 16 (53%) 24 (80%) 24 (80%) 30 (100%) 28 (93%)
(n = 30)
Shigella isolates 26 (86.6%) 28 (93%) 19 (63%) 28 (93%) 16 (53.3%) 15 (50%) 16 (53.5%) 18 (60%) 29 (96.6%) 28 (93%)
(n = 30)
Plesiomonas shigelloides 18 (90%) 18 (90%) 15 (75%) 19 (95%) 14 (70%) 13 (65%) 10 (50%) 11 (55%) 19 (95%) 18 (90%)
(n = 20)
Aeromonas 18 (90%) 17 (85%) 14 (70%) 18 (90%) 15 (75%) 12 (60%) 9 (45%) 10 (50%) 18 (90%) 16 (80%)
(n = 20)
Vibro cholerae 11 (73%) 8 (53%) 10 (66.6%) 14 (93.3%) 7 (47%) 8 (53%) 6 (40%) 9 (60%) 13 (87%) 9 (60%)
(n = 15)
Enterobacter isolates 17 (85%) 15 (75%) 16 (80%) 18 (90%) 12 (60%) 11 (55%) 10 (50%) 11 (55%) 17 (85%) 16 (80%)
(n = 20)
NA = Nalidixic acid TE = Tetracycline GM = Gentamicin ERY = Erythromycin COT = Cotrimoxazole
AP = Ampicillin CIP = Ciprofloxacin AKC = Amikacin CEF = Ceftriazone CHL = Chloramphenicol
401.4. DISCUSSION
The high counts of indicator organisms revealed that the microbiological quality
of the water sources were above the recommended safety guidelines for
drinking water as stipulated by DWAF (1998). This is in agreement with findings
by other researchers who conducted similar studies in rural areas (Palupi et al.,
1995; Nevondo and Cloete, 1999).
The detection of somatic phages in the water sources could indicate faecal
contamination and hence potential viral infections (Grabow, 2001). However,
there is controversy since some findings have indicated that viruses were not
detected although coliphages were detected and in other cases viruses were
detected while coliphages were not. Coliphages can therefore only serve as
indicators or as possible models to indicate potential presence of viruses
(Grabow et al., 1984; Armon et al., 1997; Grabow et al., 2000; Grabow, 2001).
Potential pathogenic enteric bacteria including Escherichia coli, Vibrio cholerae,
Aeromonas hydrophila, Shigella, Plesiomonas and Campylobacter species
were isolated from the various water sources. The presence of these pathogens
in river water sources is in agreement with previous reports (Nevondo and
Cloete, 1999; Theron, 2001). These enteric bacteria are reportedly causative
agents of various diseases and their complications (Grabow, 1996). Such
diseases include dysentery caused mainly by Shigella species, Guillian-Barre
syndrome which is a complication of Campylobacter jejuni/coli infection,
haemolytic uraemic syndrome which is a sequelae of some Eschericha coli
species, and Vibrio cholerae which could cause manifestations such as
hypovalaemic shock, acidosis and haemoconcentration (Klein et al., 1986;
Thielman and Guerrant, 1999).
Possible sources of contamination of the water sources might include human
and animal faeces. However, birds and insects could also be factors that
contribute to the contamination of the drinking water sources, especially during
storage (Figure 1.7) (Paul et al., 1995; Nevondo and Cloete, 1999; Lehloesa
and Muyima, 2000). Most of the river sources are reportedly prone to higher
41bacterial levels due to heightened ecological activities, and may therefore not
be suitable for human consumption (Lazorchak et al., 1998). These multiple
sources of contamination are compounded by limited environmental awareness
in rural areas (Figures 1.3 and 1.4) (Lehloesa and Muyima, 2000).
It should however be noted that the presence of faecal coliforms in the water
sources may not be conclusive of a faecal origin of the bacteria (Paul et al.,
1995). Investigators have reported the presence of faecal coliforms in tropical
environments in the absence of any source of faecal contamination (Hardina
and Fujioka, 1991, Hazen, 1998). For this reason, we employed an additional
faecal indicator, faecal enterococci, which may be a better indicator of human
faecal pollution in water (Levin et al., 1975; Rice et al., 1993).
Results presented showed multiple antibiotic resistance of all bacteria isolates
to ampicillin, erythromycin, tetracycline, chloramphenicol and cotrimoxazole.
Multiple antibiotic resistance refers to resistance to two or more classes of
antibiotics. The multiple antibiotic resistance of Salmonella, Shigella,
Campylobacter, Aeromonas and Plesiomonas demonstrated in this study
accords with other findings (Robins-Browne et al.,1983; Coker and Adefeso,
1994; Obi et al., 1997, 1998). Erythromycin used to be the drug of choice for
Campylobacteriosis but increasing resistance of Campylobacter to erythromycin
is well known (Coker and Adefeso, 1994). In this study, 35% of Campylobacter
isolates were resistant to erythromycin. Strains of Salmonella, particularly
Salmonella typhi, accounted for several outbreaks in the United States and
worldwide, partly due to resistance to chloramphenicol, ampicillin and
trimethoprim (Rowe et al., 1997; Mermin et al., 1998). This resistance pattern
simulates the 20% and 47% resistance rates of Salmonella obtained in this
study to chloramphenicol and ampicillin respectively.
Antibiotic susceptibility profiles showed that all enteric bacterial isolates were
markedly sensitive to nalidixic acid, gentamicin, ciprofloxacin, amikacin and
ceftriazone. These drugs may therefore be of value for the treatment of enteric
infections requiring emperic antibiotic therapy. These reported susceptibilities
are in harmony with reports of other investigators (Wasfy et al., 2000). It should
42be noted that susceptibility of bacteria to antibiotics is not static and resistance
may be due to antibiotic abuse, antibiotic overuse or may be chromosomally or
plasmid mediated (Obi et al., 1998). Antibiotic usage must therefore be
carefully regulated and monitored.
This study and other studies on domestic consumption of water in rural
communities in the developing world showed the challenges for health and
water resources in South Africa and other developing countries (Palupi et al.,
1995; Nevondo and Cloete, 1999; Acho-chi, 2001; Lehloesa and Muyima,
2001). The provision of safe potable water supply in rural communities is
necessary in order to satisfy basic needs and is seen as important for assessing
social development in developing countries (Forch and Biemann, 1998; Acho-
chi, 2001). According to the results it can be concluded that the microbiological
quality of the water sources investigated in this study suggest a potential risk of
infection for consumers and necessitates calls for prompt interventions to
mitigate the socio-economic and health impact of water-borne diseases in these
rural communities.
1.5. REFERENCES
Acho-Chi C (2001) Management of water supply system in the Kano district of
Nigeria: Problems and possibilities. AQUA 50 (4) 199-207.
Alabi SA and Odugbemi TO (1990) Occurrence of Aeromonas species and
Plesiomonas shigelloides in patients with and without diarrhoea in Lagos,
Nigeria. Journal of Medical Microbiology 32 45-48.
Armon R, Araujo R, Koth Y, Lucena F and Jofre J (1997) Bacteriophages of
enteric bacteria in drinking water. Comparison of their distribution in two
countries. Journal of Applied Microbiology 83 627-633.
43Bailey IW and Archer L (2001) An assessment of the impact of RDP levels of
water supply on community and environmental health. Water Research
Commission Report No K5/925/0/1
Bauer AW, Kirby WMM, Sherris JC and Turck M (1996) Antibiotic susceptibility
testing by a standardised single disk method. American Journal of Clinical
Pathology 45 413-496.
Black RE (1993) Persistent diarrhoea in children in developing countries.
Pediatrics Infectious Disease Journal 12 751-761.
Chunge RN, Karumba PN, Kaleli N, Wamwea M, Mutiso N et al., (1992)
Prevalence and frequency of Giardia lamblia in children aged 0-60 months with
and without diarrhoea. East African Medical Journal 69 311-313.
Coker AO and Dosunmu-Ogumbi O (1984) Isolation of Campylobacter jejuni in
Lagos, Nigeria. A new bacterial agent of diarrhoea. East African Medical
Journal 61 52-55.
Coker AO and Adefoso AO (1994) The changing patterns of Campylobacter
jejuni/coli in Lagos, Nigeria after ten years. East African Medical Journal 71
437-440.
Department of Water Affairs and Forestry (DWAF) (1998) South African Water
Quality Guideline for Domestic Use (2nd Edition), Pretoria.
Department of Water Affairs and Forestry (DWAF) (1994) White paper on
Water and Sanitation.
Department of Water Affairs and Forestry (DWAF) (1995) Water supply and
sanitation white paper. Pretoria.
Du Pont HL (1995) Diarrhoeal diseases in the developing world. Infectious
Disease Clinician, North America 9 313-324.
44Echeverria P, Blacklow NR, Cukor S, Vibuldandhitkit S, Chang Chawalit S,
Boonthai P (1983) Rotaviruses as a cause of severe gastroenteritis in adults.
Journal of Clinical Microbiology 18 663-667.
El-Assouli SM, Mohammed KA and Banjar ZM (1995) Human rotavirus
genomic RNA electropherotypes in Jeddah, Saudi-Arabia from 1988-1992.
Annals of Tropical Paediatrics 15 45-53.
El-Sheikh SM and El-Assouli SM (2001) Prevalence of viral, bacterial and
parasitic enteropathogens among young children with acute diarrhoea in
Jeddah, Saudi-Arabia. Journal of Health Population and Nutrition 19 (1) 25-30.
Esrey SA, Potash J, Roberts L and Shiff C (1990) Health benefits from
improvements in water supply and sanitation: Survey and analysis of the
literature on selected diseases. WASH Report No 66.
Forch G and Bremann H (1998) Restoration of water supply schemes in the
context of town development: The Bhaktapur project in Nepal. Applied
Geographical Development 15 54-61.
Ford-Jones EL, Minndorff CM, Gold R and Petric M (1990) The incidence of
viral-associated diarrhoea after admission to a paediatric hospital. Journal of
Epidemiology 131 711-718.
Genthe B and Seager J (1996) The Effect of Water Supply, Handling and
Usage on Water Quality in Relation to Health Indices in Developing
Communities. Water Research Commission Report No 562/1/96.
Gentsch JR, Glass RI, Woods P, Gouvea V, Gorziglia M, Flores J, Das BK and
Bhan MK (1992) Identification of group a rotavirus gene 4 types by polymerase
chain reaction. Journal of Clinical Microbiology 30 1365-1373.
45Gouvea V, Glass RI, Woods P, Taniguchi K, Clark HF, Forrester B and Fang Z
(1990) Polymerase chain reaction amplification and typing of rotavirus nucleic
acid from stool specimens. Journal of Clinical Microbiology 28 276-282.
Gouvea V, De Castro L, Do Carmo Timenetsky M, Greenberg H and Santos N
(1994) Rotavirus Serotype 95 associated with diarrhoea in Brazilian children.
Journal of Clinical Microbiology 32 1408-1409.
Grabow WOK (1991) Human viruses in water. Water and Sewage 11 16-21.
Grabow WOK (1996) Waterborne diseases: Update on water quality
assessment and control. Water SA 22 193-210.
Grabow WOK, Coubrough P, Nupen EM and Bateman BW (1984) Evaluations
of coliphages as indicators of the virological quality of sewage-polluted water.
Water SA 10 (1) 7-14.
Grabow WOK, Taylor MB, Clay CG and De Villiers JC (2000) Molecular
detection of viruses in drinking water: Implications for safety and distribution.
Proc. 2nd Conference of the International Life Sciecne Institute. The safety of
water disinfection: Balancing chemical and microbiological risks. Radisson
Deauville Resort, Miami, Florida, USA. 15-17 November.
Grabow WOK (2001) Bacteriophages: Update on application as models for
viruses in water. Water SA 27 (2) 251-268.
Hardina CM and Fujioka RS (1991) Soil: The environmental source of
Escherichia coli and eteroccocci in Hawaii’s streams. Environtal Toxicology and
Water Quality 6 185-195.
Hazen TC (1998) Faecal coliforms as indicators in tropical waters: A review.
Toxicology Assessment 3 461-477.
46Joseph T (1987) The isolation rates of pathogenic bacteria from stools of
gastro-enteritis patients. Industrial Microbiology 25 189-193.
Klein JO, Feigin RD and McCracken Jr GH (1986) Report of the task force on
diagnosis and management of meningitis. Pediatrics 78 959-982.
Lacorchak JM, Klem DJ and Peck DV (1998) Environmental monitoring and
assessement program – surface waters: field operations and methods for
measuring the ecological condition of wadable streams. EPA/620/R – 94/004F.
US Environmental Protection Agency, Washington DC.
Lehloesa LJ and Muyima NYO (2000) Evaluation of the impact of household
treatment procedures on the quality of groundwater supplies in the rural
community of the Victoria district, Eastern Cape. Water SA 26 (2) 285-290.
Levin MA, Fischer JR and Cabelli VJ (1975) Membrane filtration technique for
enumeration of enterococci in marine waters. Applied Environmental
Microbiology 30 66-71.
Lourenco MH, Nicholas JC, Cohen J, Scherrer R and Bricout F (1981) Study of
Human Rotavirus Genomen by electrophoresis: Attempt of Classification among
strains isolated in France. Annals in Virology (Paris) 131 161-173.
Matar GM, Adbo D, Khneisser I, Youssef M, Zouheiry H and Hakeh HS (2002)
The multiplex-PCR based detection and genotyping of diarrhoeagenic
Escherichia coli in diarrhoeic stools. Annals in Tropical Medical Parasitology 96
(3) 317-324.
Mermin JH, Townes JM, Gerber M, Dolan N, Mintz ED and Tauxe RV (1998).
Typhoid fever in the United States, 1985-1994: Changing risks of international
travel and increasing antimicrobial resistance. Archives in Internal Medicine
158 633-638.
47You can also read